Release Notes
4.1.2
Changed
- Updated WebTx mappings to support Transaction Events universal field updates.
Fixed
- Fixed ingestion for selected fields in JSON format.
4.1.1
Added
- Added support for skipping the priority from the JSON-formatted data.
4.1.0
Added
- Added support for skipping the timestamp and log source identifier fields in JSON-formatted data.
- Updated the mappings for Network events and Audit events.
4.0.1
Fixed
- Fixed CEF transformation for nested JSON fields in data.
4.0.0
Added
- Added support for invoking mapping validation separately.
Changed
- Enhanced the efficiency of database interactions.
3.3.0
Added
- Added support for the content and device alert type.
- Added support for clientstatus and BWAN events.
3.2.2
Added
- Enhancement in the error handling.
- Added support for the endpoint event type. To pull and ingest this event type update your CE version to 5.1.0.
3.2.1
Added
- Added support for JA3 fields in WebTx and Application events.
3.2.0
Added
- Added the RFC fields prefix in the JSON formatted data.
- Added support to send Debug logs.
3.1.0
Added
- Added support for WebTx JSON format to send specific fields to SIEM platform.
3.0.0
Added
- Added Support for the incident event type. To pull and ingest this event type update your CE version to 4.1.0.
- Added Support for the CTEP alert type. To pull and ingest this alert type update your CE version to 4.2.0.
- Added support for WebTx format3.
Changed
- Changed error logs to warning if a single field is skipped.
Fixed
- Fixed JSON format of raw data.
Removed
- Removed priority from the Syslog message for the logs that are not transformed in CEF.
2.0.1
Added
- Added Incident ID mapping field in all alerts and events.
2.0.0
Added
- Added support to send raw data to the SIEM Platform.
1.2.2
Fixed
- Fixed Severity mappings for Audit events.
1.2.1
Added
- Added support for Syslog service plugin for Netskope CE.
1.2.0
Added
- Added Log Source Identifier as configurable field.
1.1.1
Added
- Updated WebTx mappings.
1.1.0
Added
- Support for web transaction logs ingestion.
- Removed
- Valid extensions from plugin configuration.
- Transformations from the plugin.
1.0.0
Added
- Initial release.
This document explains how to configure the Syslog v4.1.2 plugin with the Log Shipper module of the Netskope Cloud Exchange platform. This plugin supports ingestion of Alerts (DLP, Malware, Policy, Compromised Credential, Malsite, Quarantine, Remediation, Security Assessment, Watchlist, UBA, CTEP, Device, Content), Events (Page, Application, Audit, Infrastructure, Network, Incident, Endpoint, Client Status), BWAN Events (Authentication, Audit, Client, Gateway, System), WebTx and Logs (Debug, Information, Error, Warning). The data will be ingested in the SIEM platform. This plugin supports ingestion in CEF and JSON format.
Prerequisites
To complete this configuration, you need:
- A Netskope tenant (or multiple, for example, production and development/test instances).
- A Netskope Cloud Exchange tenant with the Tenant plugin and Log Shipper plugin already configured.
- A Netskope Cloud Exchange tenant with the BWAN plugin already configured.
- The AWS Log Streaming plugin and Azure Log Streaming plugin already configured, for ingesting alerts, events and WebTx from the Netskope Log Streaming plugin.
- A Splunk instance.
- Connectivity to a syslog server.
Note
Endpoint event type requires minimum CE version to be 5.1.0. BWAN events, Events of type Client Status, and Alerts of type Device and Content requires minimum CE version to be 5.1.1.
Syslog Plugin Support
The Syslog plugin is used to ingest all the Alert, Events, WebTx, and Syslog CE Logs in CEF and JSON format to the specified syslog server. This plugin also supports ingestion of alerts, events and WebTx from the Netskope Log Streaming plugins.
| Data Type | Support |
|---|---|
| Events | Yes (Page, Application, Audit, Infrastructure, Network, Incident, Endpoint, Client Status) |
| Alerts | Yes (DLP, Malware, Policy, Compromised Credential, Malsite, Quarantine, Remediation, Security Assessment, Watchlist, UBA, CTEP, Device, Content) |
| Syslog CE Logs | Yes (Info, Error, Warning, Debug) |
| BWAN Events | Yes (Authentication, Audit, Client, Gateway, System) |
| WebTx | Yes (via Netskope LogStreaming) |
API Details
The plugin uses a logging third-party library to push the data to the Syslog collector.
Library: logging
This module defines functions and classes which implement a flexible event-logging system for applications and libraries.
The key benefit of having the logging API provided by a standard library module is that all Python modules can participate in logging, so your application log can include your own messages integrated with messages from third-party modules.
Refer to the official documentation for more information on the logging library: https://docs.python.org/3/library/logging.html.
List of Methods Used
Method: logging.getLogger(name=None)
Return a logger with the specified name or, if the name is None, return a logger which is the root logger of the hierarchy
All calls to this function with a given name return the same logger instance. This means that logger instances never need to be passed between different parts of an application.
Method: setLevel(level)
Sets the threshold for this logger to level. Logging messages that are less severe than the level will be ignored; logging messages that have a severity level or higher will be emitted by whichever handler or handlers service this logger, unless a handler’s level has been set to a higher severity level than the level.
Method: handlers
The list of handlers is directly attached to this logger instance.
Note:
This attribute should be treated as read-only; it is normally changed via the addHandler() and removeHandler() methods, which use locks to ensure thread-safe operation.
Method: removeHandler(hdlr): Removes the specified handler hdlr from this logger.
Method: addHandler(hdlr): Adds the specified handler hdlr to this logger.
Performance Matrix
This performance reading was conducted on a Large Stack in Cloud Exchange with these VM specifications. These readings are added with the consideration that it will ingest around 10k Netskope alerts/events in 2 seconds to the SIEM.
| Description | Specification |
|---|---|
| Stack details | Size: Large RAM: 32 GB CPU: 16 Cores |
| Alerts/Events ingested to SIEM | ~200k EPM |
| WebTx (via Netskope LogStreaming) ingested to SIEM (uncompressed) | ~165k EPM |
Workflow
- Create a Data Input on Splunk.
- Configure the Syslog Plugin for the Splunk integration.
- Configure a Log Shipper Business Rule for the Splunk integration.
- Configure Log Shipper Log Delivery for the Splunk integration.
- Validate the Syslog with Splunk plugin.
Watch a Video
Click play to watch a video:
Create a Data Input on Splunk
Follow the steps in this Document to install Splunk.
- Log in to the Splunk instance.
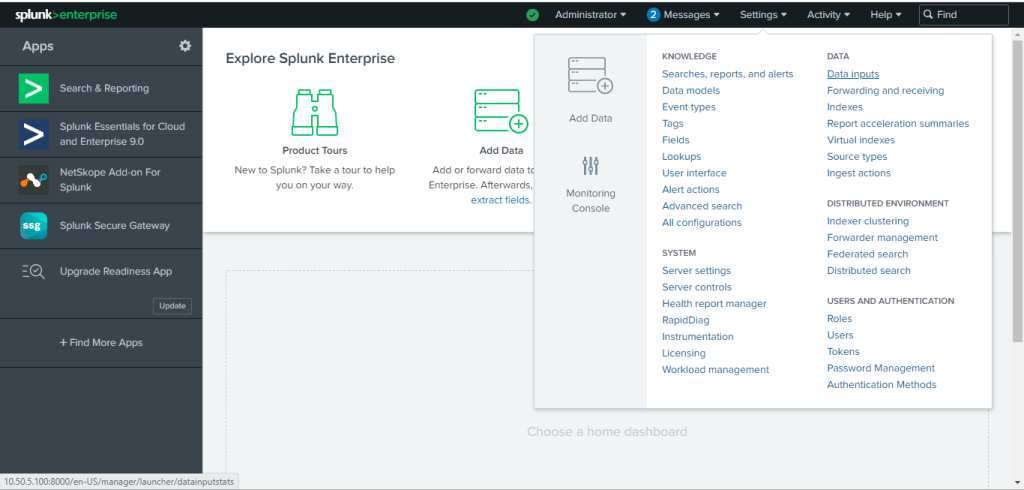
- From the dashboard, go to Settings > Data inputs.
- Click Add new for the TCP input.
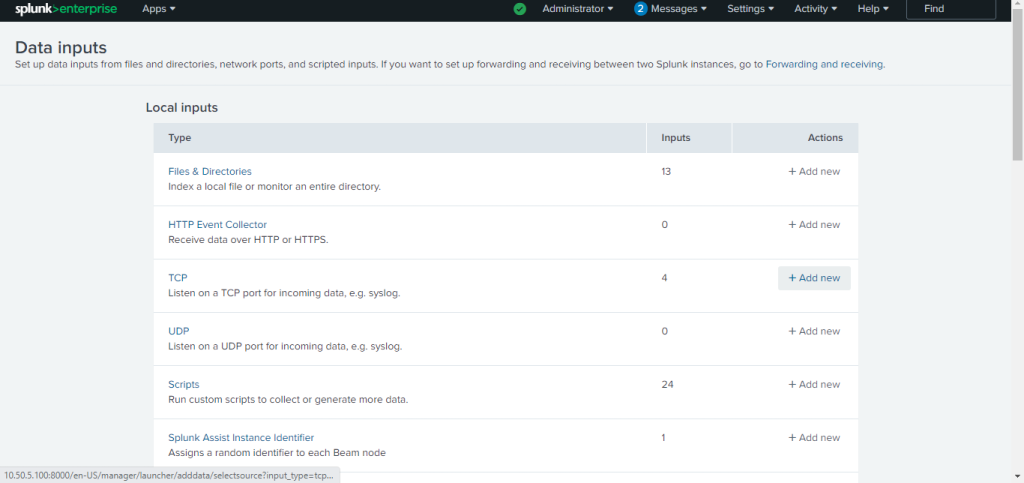


- Add your port and click Next. Note that the selected port must be exposed on the host machine to ingest the data to Data inputs.
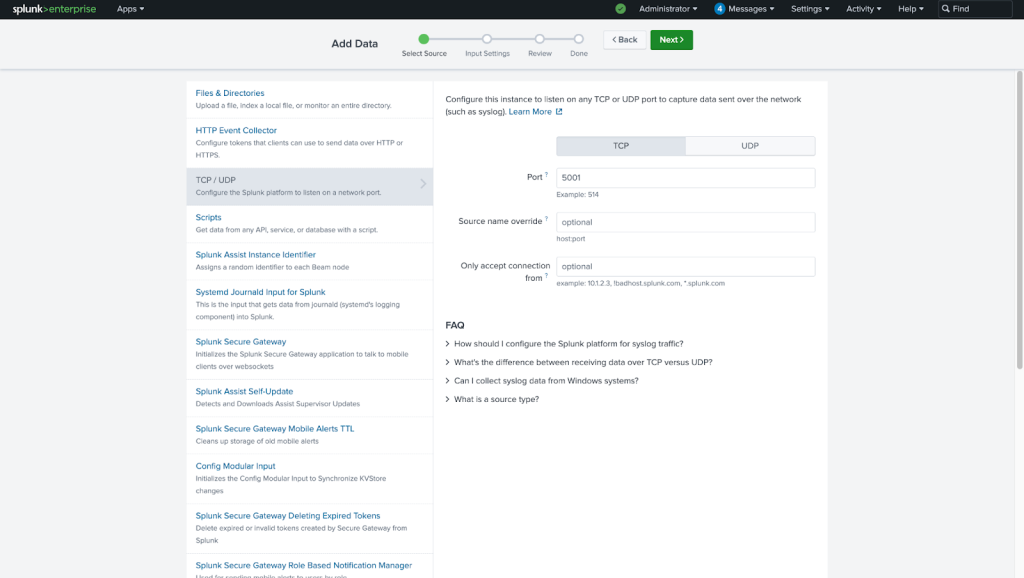
- Select the Source type if you already have any, or click New to create a new Source type.
- Enter the Source type. Select the Source Type Category based on your requirement, or keep it as it is.
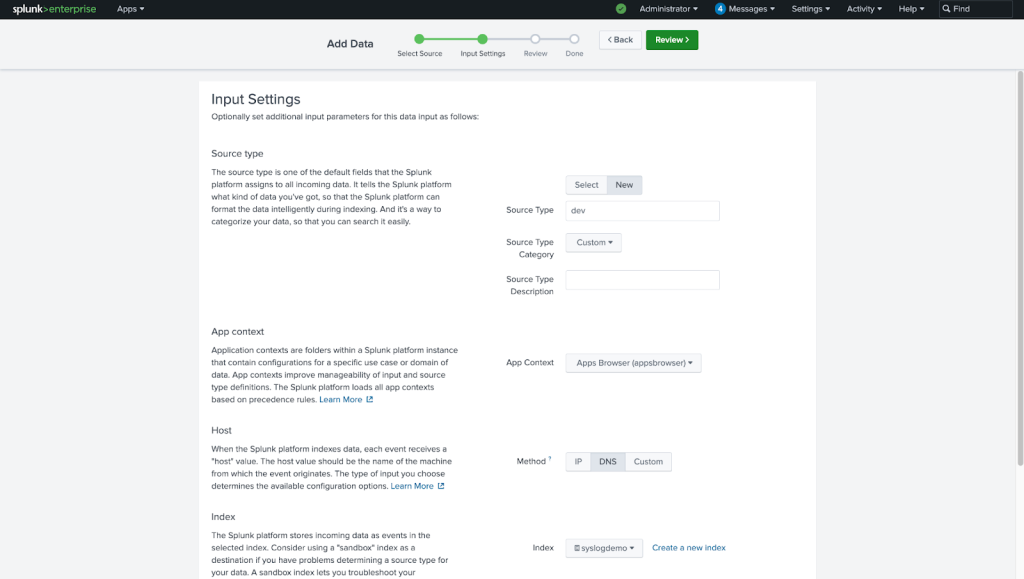
- Scroll down to Index. If you already have any index that you want to use. Select it from the Index dropdown; otherwise, click Create a new index. Add an Index Name, and click Save, and then click Review.
- Review all details and click Submit.
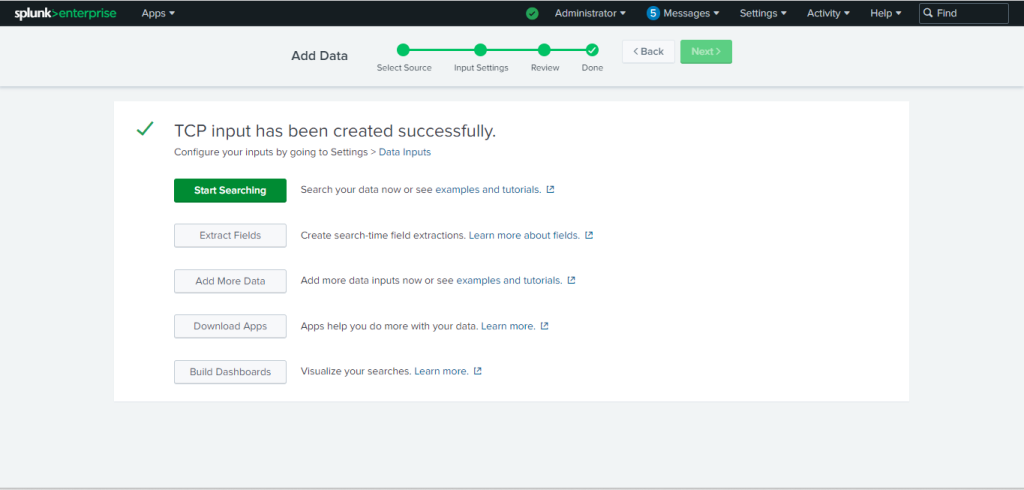
- Click Start Searching.


Configure the Syslog Plugin for the Splunk Integration
-
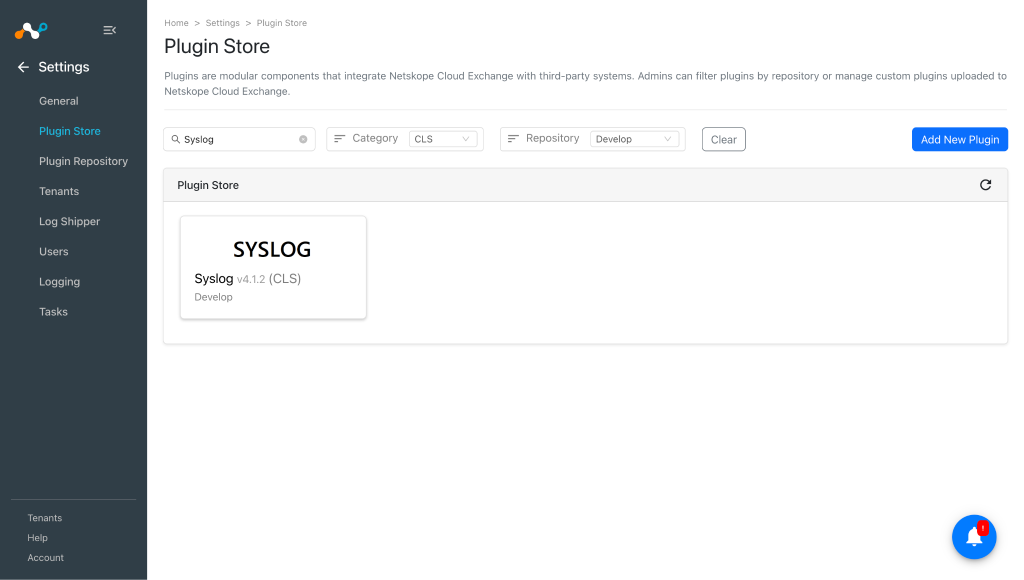
In Cloud Exchange, go to Settings > Plugin Store. Search for and select the Syslog v4.1.2 (CLS) plugin.
-
Enter a plugin configuration name and make sure you have the Syslog Default Mapping file selected if you want to use CEF format.
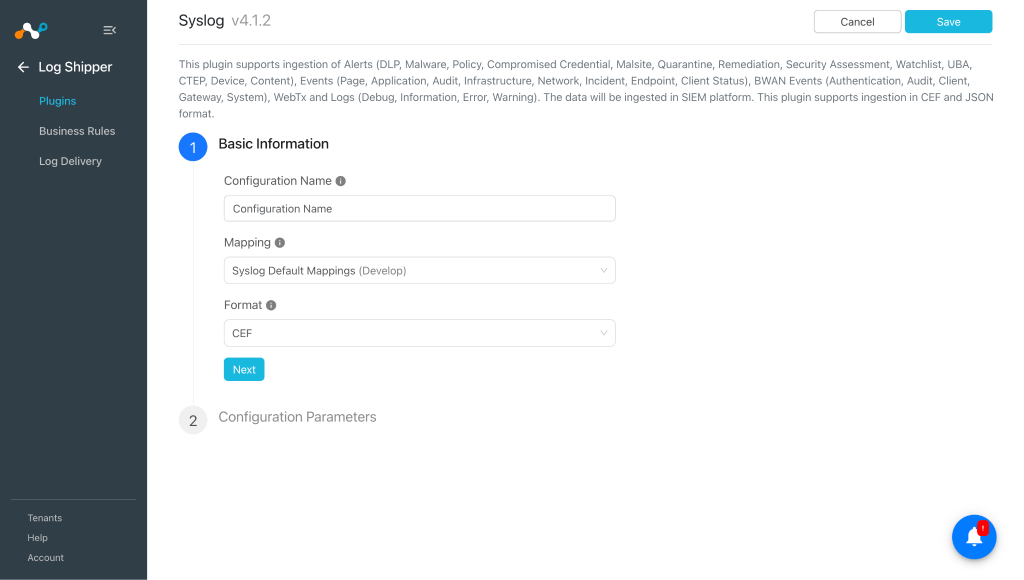 To ingest data in JSON format, select format as JSON under Basic Information.
 -
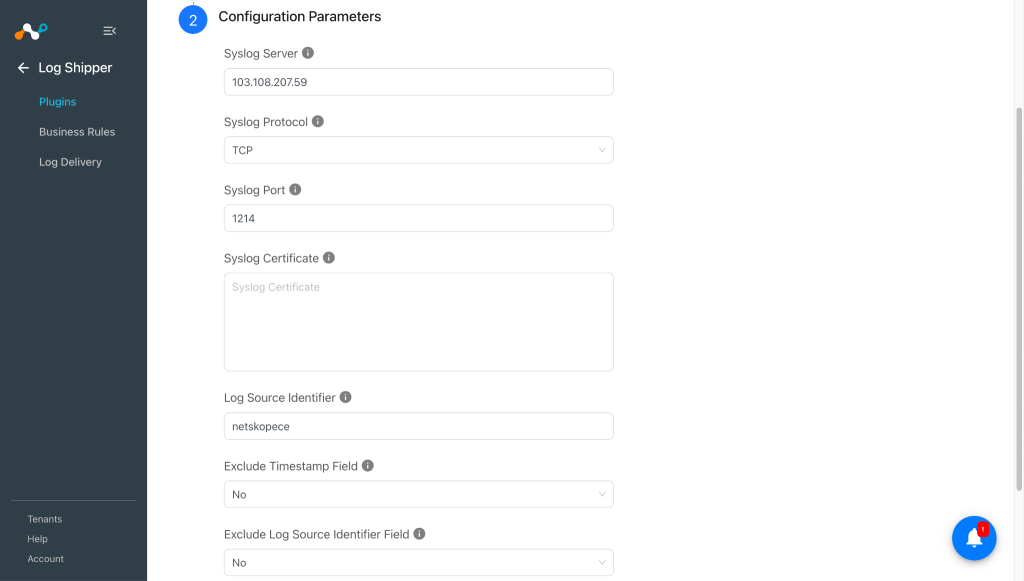
Click Next and enter the Configuration Parameters:
- Syslog server: IP address/FQDN of the Syslog server where the data will be ingested.
- Syslog Protocol: Protocol to be used while ingesting data.
- Syslog Port: The port used while creating the Data input configuration on Splunk.
- Syslog Certificate: Certificate is required only for TLS protocol.
- Log source Identifier: The identifier added as a prefix to all the logs.
- Exclude Timestamp Field: Select Yes to ingest the data without the timestamp field. This option is only applicable to JSON-formatted data.
- Exclude Log Source Identifier Field: Select Yes to ingest the data without the Log Source Identifier field. This option is only applicable to JSON-formatted data.
- Exclude Priority Field: Select Yes to ingest the data without the priority field in the syslog message. This option is only applicable to JSON-formatted data.
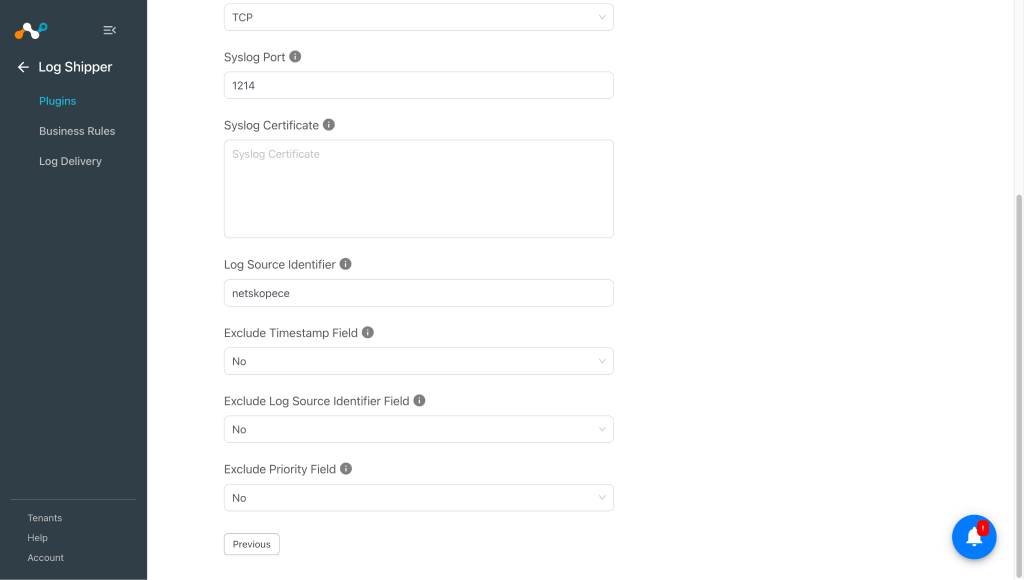 If Exclude Priority Field is kept as No, then it will use the default priority as 14 (Info) for all data.
 -
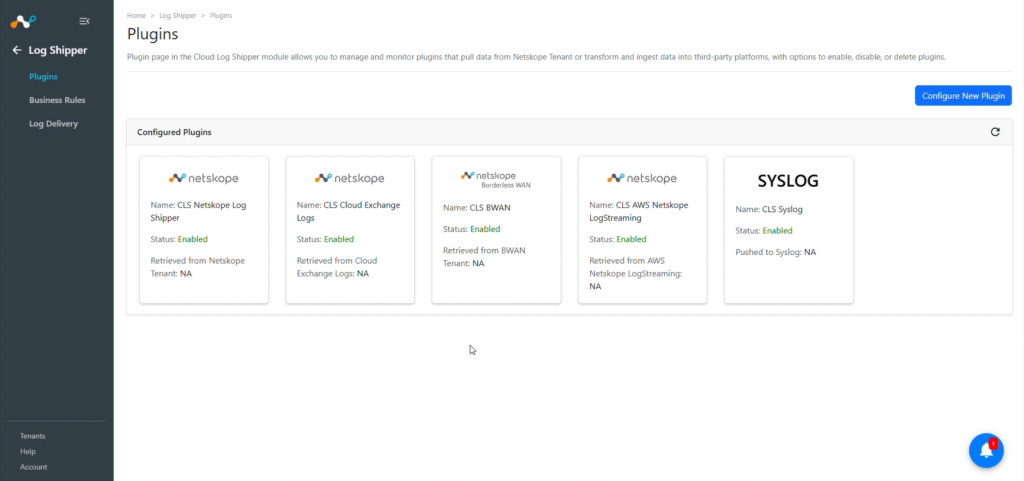
Click Save. The plugin configuration will be available on the Log Shipper > Plugins page.


Configure a Log Shipper Business Rule for the Splunk Integration
-
Go to the Business Rule page.
-
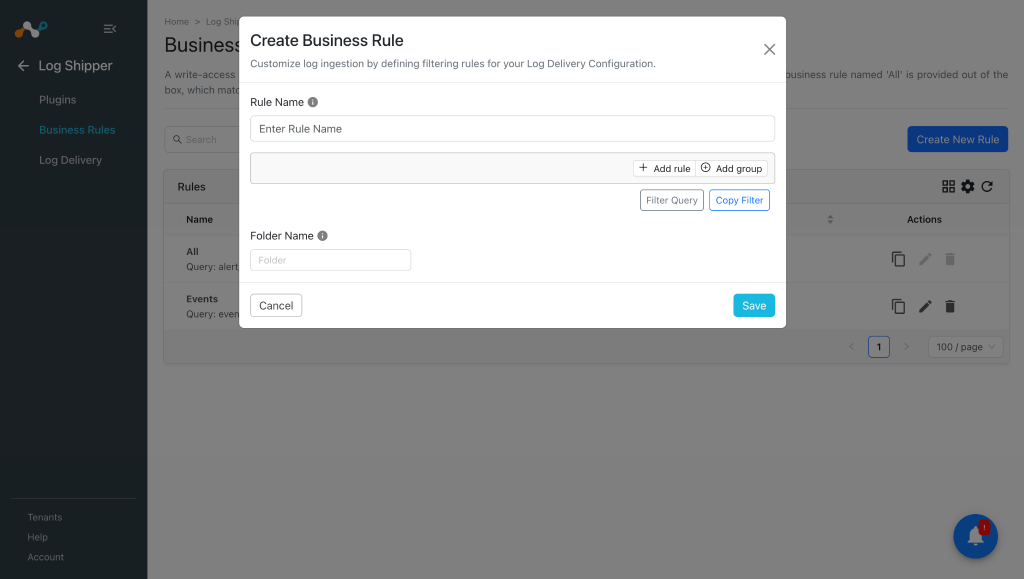
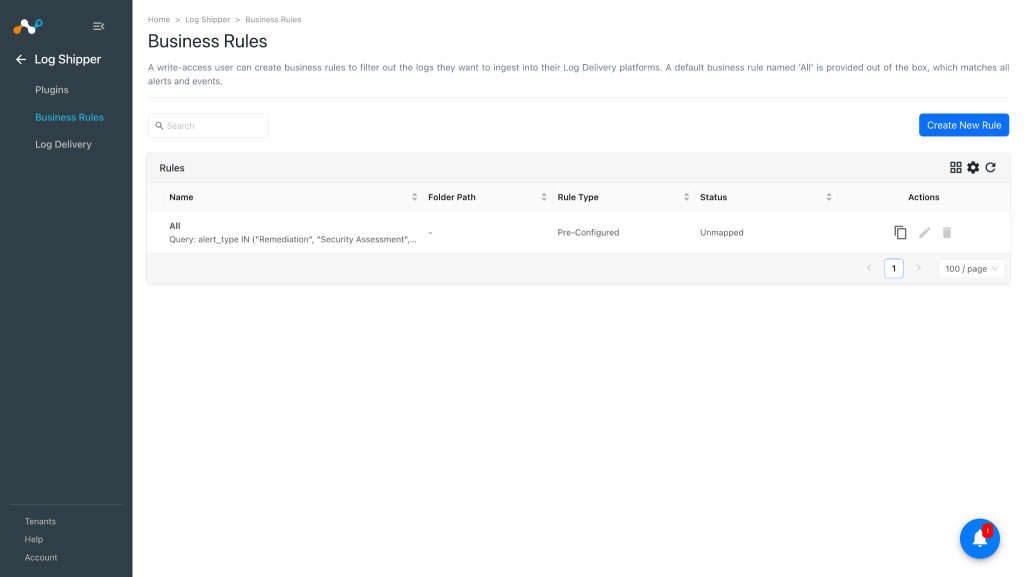
By default, there is a business rule that filters all alerts and events. If you want to filter out any specific type of alert or event, click Create New Rule and configure a new business rule by adding the rule name and filter.
-
Click Save.


Configure Log Shipper Log Delivery for the Splunk Integration
- In Log Shipper, go to Log Delivery and click Add Log Delivery Configuration.
- Select the Source plugin (CLS Netskope or any other source plugin), Destination plugin (CLS Syslog), your business rule, and click Save.
- For WebTx, select the Source plugin (CLS Netskope WebTx) and Destination plugin (CLS Syslog).
- For Logs sharing, select the Source plugin (CLS Cloud Exchange Logs) and Destination plugin (CLS Syslog).
- After the Log Delivery is added, the data will start to be pulled from the Netskope tenant or source platform, then transformed and ingested into the Syslog platform.

Validate the Syslog with Splunk Plugin
Validate the Pull
To validate the pulling of Events, Alerts, logs, BWAN events and Webtx from the Netskope tenant.
Go to the Logging in Cloud Exchange and search for the pulled logs.


Validate the Push
To validate the plugin workflow in Cloud Exchange, go to Logging and search for ingested Events, Alerts, WebTx & Logs with the filter “message contains ingested”. The ingested logs will be filtered.


To validate the push on the Splunk:
Log in to Splunk Platform.

Click Search & Reporting.

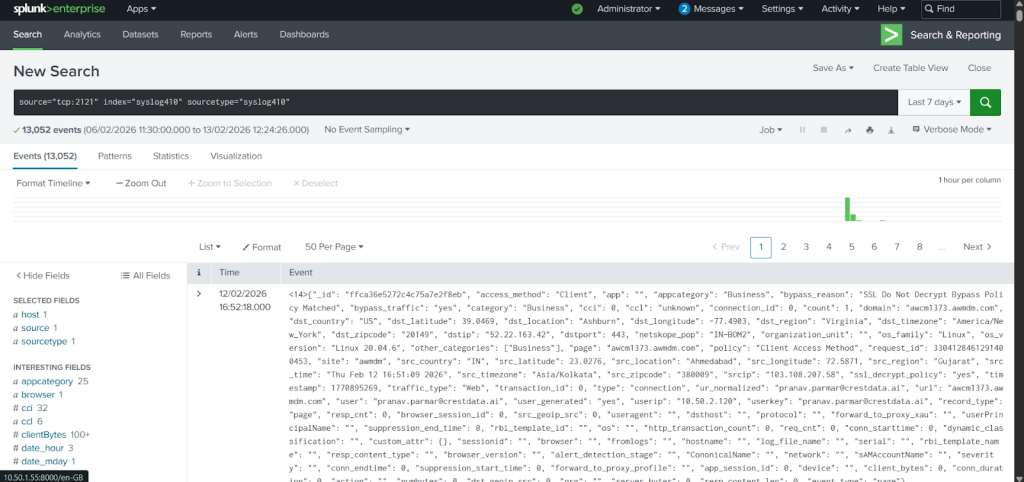
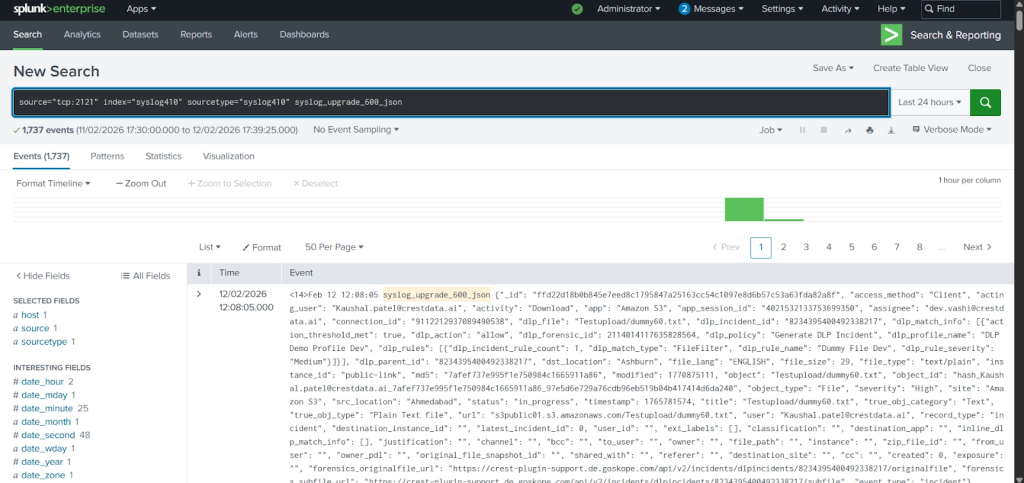
Enter the source and Protocol along with: and port along with Log Source Identifier (Example: source=”tcp:5001″ index=”syslogdemo” sourcetype=”dev” netskopece)
Here are examples of ingested Alerts:


Here are examples of ingested Events:


This is how BWAN Events look from plugin to Splunk:


This is how Syslog for CE Logs look from plugin to Splunk:


This is how WebTx data look from plugin to Splunk:

This is how Data looks when shared in JSON from plugin to Splunk (unparsed format):


Here is how the data will look if ingested in JSON format without Timestamp and Log source identifier fields:

Below is how the data will look if ingested in JSON format without Priority Field:


Sample ingested data in JSON format with custom mapping having only selected fields:

Troubleshooting the Syslog Plugin
An error occurred while configuring the Syslog Plugin
Despite entering all parameters and clicking Save, an error may occur, possibly due to one of these reasons:
- The server/port configuration may differ from the specified settings (Netskope CE/Splunk).
- The port is not exposed on the Splunk server.

What to do:
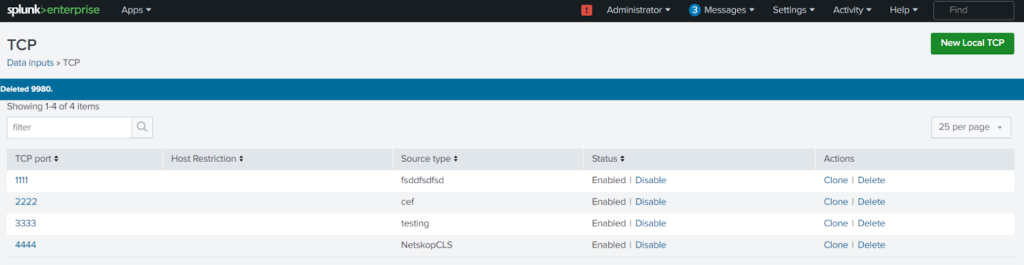
- In the Splunk Platform, go to Settings and click Data inputs > TCP (whichever configuration you have used). Check that both are the same.
- Expose the Port on the Splunk server.

Nested fields are not mapped properly while ingesting data via Syslog plugin
On the older versions of Syslog plugin, you will not be able to map the nested fields. This issue is resolved in the latest version of the Syslog plugin.
What to do: Upgrade the Syslog plugin to Syslog v4.0.1 or above.
Note
Users will not be able to directly map any fields inside a list. They can only map the nested fields present inside a JSON value.
An error occurred while ingesting data from Cloud Exchange to Syslog
If you are unable to push alerts/events/logs/webtx data on the Syslog platform, then it could be due to one of these reasons:
- Port is deleted/disabled on the Syslog platform.
- Splunk server storage is full.
What to do:
- Make sure the port is present and enabled. If not, then create a new port.
- Make sure to clean the event data if not necessary, or increase the storage of the Splunk server.
If ingested data is not reflected on the Syslog Platform
If you are unable to view alerts/events/logs/webtx data on the Syslog platform, it could be due to one of these reasons:
- The filter is not correct on the Splunk platform.
- There might be any error, but UDP is selected in the Port while configuring the syslog plugin, so ingested logs are not visible.
What to do:
- Make sure Data is searched using the correct filter.
- Make sure to select the TCP port to check if there is any issue.
Webtx data skipped due to parser order of Configured Log Streaming or disabled x-cs-timestamp field
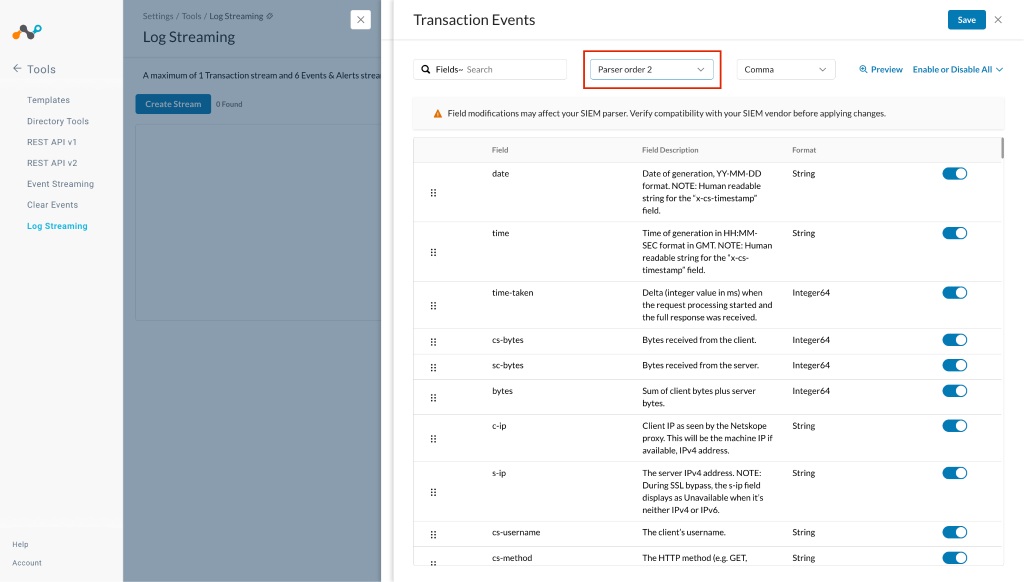
If the Webtx data is not ingested to the destination it may be due to incorrect mapping used while configuring the Syslog plugin or disabled x-cs-timestamp field. The default mappings for Syslog v4.1.2 are compatible with parser order 2.
What to do:
Update the parser order of your Log Streaming on the Netskope tenant to Parser order 2, or use the custom mapping. To update the parser order:
-
Edit the WebTx stream then under Transaction Events, click Manage Fields, and change the parser order to Parser order 2.
-
Also, make sure that the x-cs-timestamp field is enabled

Network Event skipped due to unexpected type for Network Session ID field
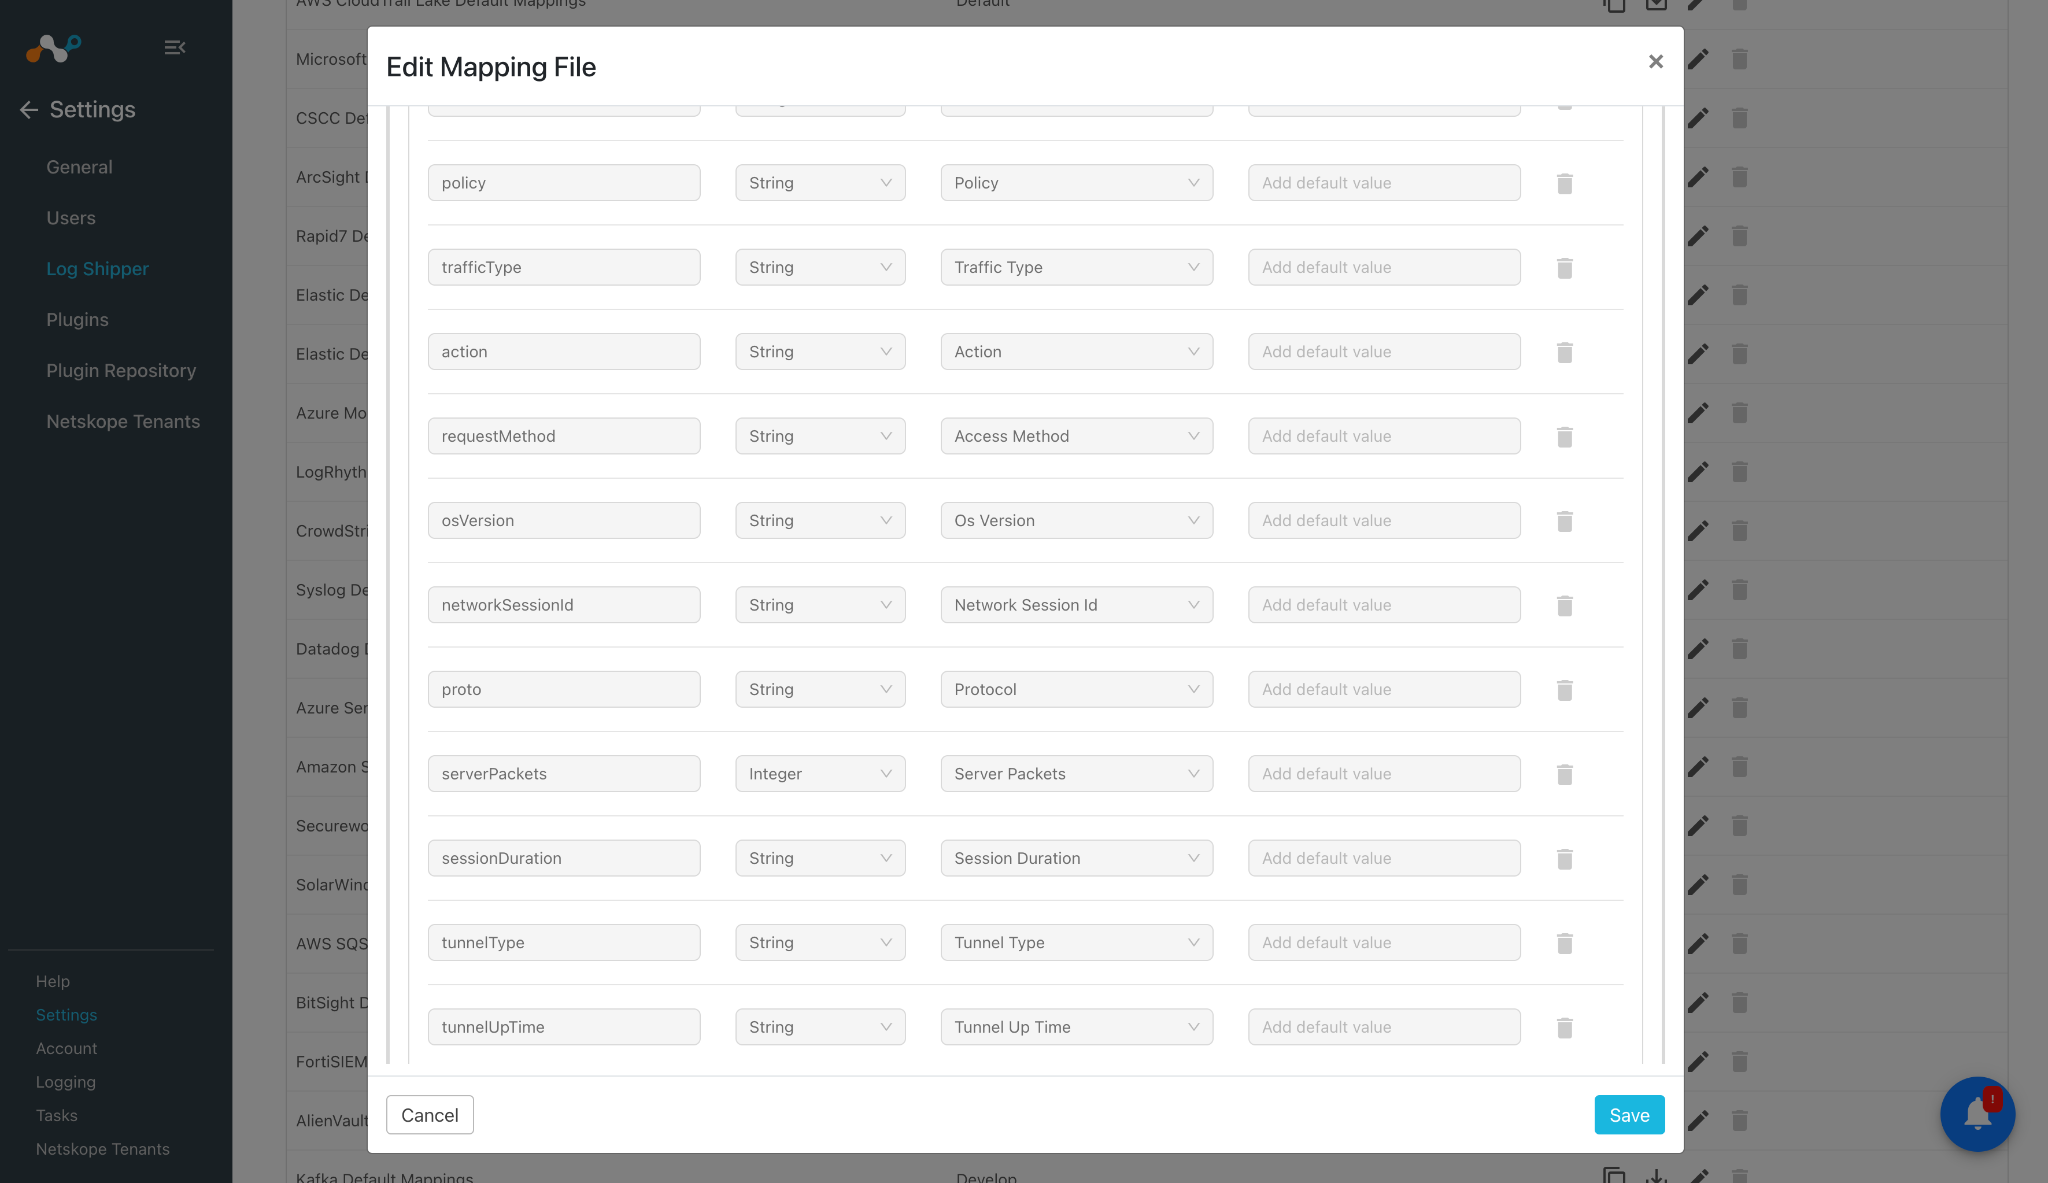
If you are not able to get value for the Network session ID field, then it could be due to using an old syslog plugin where the network session ID field is of number type.
What to do:
- Update to latest syslog plugin or update network session id field to string type to handle non-numeric data.
- To update mapping, go to Settings > Log Shipper and clone the Syslog Default Mappings. Add a name for the cloned mapping.
- Click Events > Network > Extension > networkSessionId > Select Type “String”, and then click Save.
- Use the updated mapping file in plugin configuration.
Known Behavior
- You may encounter escape characters in the ingested data due to several factors, such as accented characters (in English), characters of languages other than English, non-breaking spaces, newline characters, and other special formatting symbols.
Here, there are Japanese characters that were ingested, which looked like\\u4ed5\\u4e8bin the below log.
Example:<14>Apr 07 09:32:56 alltypes CEF:0|Netskope|Mock Netskope Tenant|NULL|application|NULL|Unknown|act=Download appcategory=Cloud Storage applicationType=nspolicy browser=unknown \\u4ed5\\u4e8b cci=89 ccl=high device=Other dst=ef82::1a12:1234:1b12 os=unknown requestClientApplication=Box sourceServiceName=Box src=ef82::1a12:1234:1b12 suser=support@netskope.com timestamp=1743736484
- Ingested content may have missing fields/data if you set the Pull DLP Incident Forensics field as
Yes, or the content of any of the fields is very large.
We have observed that some of the fields are very large and they have length beyond the maximum length supported by the Netskope Cloud Exchange. Due to this, you may encounter the below warning and you may observe that the ingested event is incomplete as rest of the values will be skipped.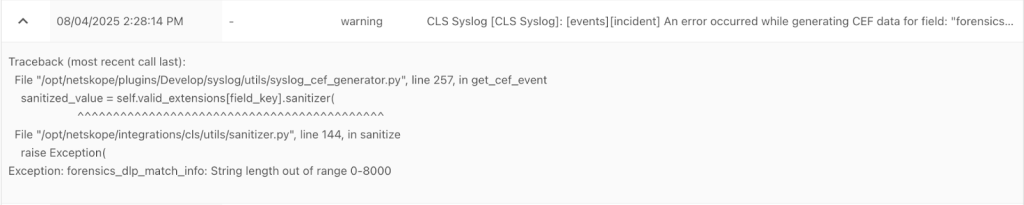
- We tested the plugin using a Splunk instance for data ingestion and observed the following behavior:
When the Exclude timestamp field is set to Yes, the data is ingested using the current local timestamp.
When the Exclude timestamp field is set to No, the data is ingested using the current UTC timestamp.