

Netskope Data Loss Prevention (DLP) protects sensitive data in the cloud with accuracy and precision by inspecting all sanctioned and unsanctioned cloud services. When users violate a DLP policy, Netskope logs the incident. If you have Endpoint DLP, users that violate your Content Control policies also trigger a DLP incident.
Note
Incidents are generated for each file/sub-file that matches DLP Profile(s) and the corresponding DLP Rules, Fingerprint Rules, ML-based Classifiers or File Profiles. A sub-file is any file within a container file (e.g. file within a zip/tar or an image in a pptx document or a spreadsheet in a docx file). One incident will be generated for each container file and one each for any sub-files that match DLP Profiles.
If a PowerPoint document matches a DLP Rule used in a DLP Profile, one incident will be created for that file. If an embedded image of a Credit Card in the same PowerPoint document matches an ML-based Classifier for Credit Cards, another incident will be created for that image.
For example, if a .zip file has 300 files, DLP service will generate at most 50 incidents.
All matched embedded files generate an incident in case of introspection and CASB.
For inline (nsProxy) requests, DLP generates events/incidents only for the profile associated with the highest priority policy. The incident limit combined with generating events/incidents only for the highest policy/profile matched may result in alerts generated that don’t have a corresponding incident. For example, if the first 50 embedded files match a lower priority policy/profile and subsequent embedded files match a higher priority policy/profile, then the incidents for the higher priority profile are not recorded as the limit has been reached.
Viewing DLP Incidents
Incident grouping depends on whether the Object ID or hash changes; incidents are grouped if the Object ID remains the same, and a change in hash triggers a new incident, with filename changes not necessarily causing new incidents if content remains unchanged.
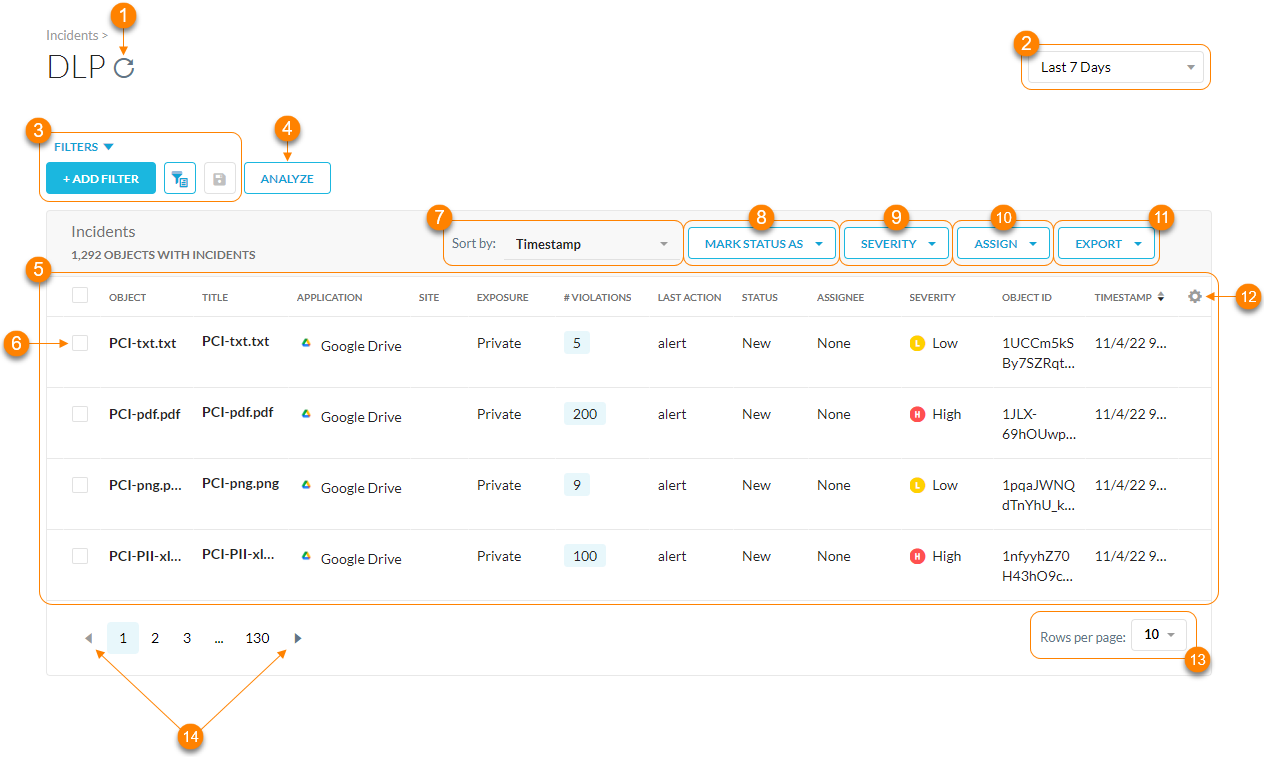
To view DLP incidents in your organization, go to Incidents > DLP.
- Refresh the DLP incident results.
- Filter DLP incidents by a specific time frame. You can use a predefined time frame or choose Date Range to use the calendar and time menus to customize your own.
- Search and filter the DLP incidents by a query. Click + Add Filter to add other filters to narrow your search results. For example, you can choose Block for the Last Action and select an application to only view DLP incidents that match this criteria. You can also click
 to switch to the advanced query search mode. Click
  to save the filter combination for future searches.
Note
If you have Endpoint DLP, you can filter incidents by Endpoint Content Control Policy.
- View the top 5 applications, exposures, and top 5 policies with violations.
- View a list of DLP incidents. For each incident, you can see the following default information:
- Object: The file or object name that triggered the violation. Click to open a page with more details where you can change status, assign incidents, change severity, and take actions.Application: The application that triggered the violation.Site: The website that triggered the violation.Exposure: The exposure level of the file.# Violations: The total number of violations with file. The count refers to the aggregated number of records detected across all the policies in the incident.Last Action: The action that was taken, such as allow, block, alert, etc.Status: Shows the state of the event. There are three states:
- Public – IndexedPublic – UnlistedPublicPrivateExternally SharedInternally SharedEnterprise SharedCross-Geo
Assignee: The person assigned to monitor the incident.Severity: The severity level of the object or file. There are four levels:- NewIn ProgressResolved
- LowMediumHighCritical
In addition, if you selected Count only unique record under Severity Threshold for a DLP rule, then the severity displays the count as Count: <Number of Violations> unique. If you deselect Count only unique record, the severity count is displayed as Count: <Number of Violations>.
Object ID: The ID of the object or file.Timestamp: The date and time that the violation occurred.Instance: The application instance that triggered the violation.Instance Id: The ID of the application instance.Last Modified By: The user that made the latest changes to the file when Netskope processed it.Object Owner: The original owner of the object or file.File Path: The full file path on the device.DLP Policy: The DLP policy that triggered the violation.DLP Profile: The DLP profile associated with the DLP policy and violation.DLP Rule: The DLP rules associated with the DLP policy and violation.Note
In API Data Protection for ServiceNow, for certain types of activities, the Last Modified By user can be the ServiceNow system administrator user instead of the actual user. This is because for certain activities like a file upload, ServiceNow performs some checks and scans. Due to this the Last Modified By user can be “system” or “admin”.
- Object: The file or object name that triggered the violation. Click to open a page with more details where you can change status, assign incidents, change severity, and take actions.Application: The application that triggered the violation.Site: The website that triggered the violation.Exposure: The exposure level of the file.
- Select one or more objects to update the Mark Status As and Severity as well as Assign someone to monitor the incident.
- Sort the table by the following:
- Object
- Application
- Site
- Exposure
- Status
- Assignee
- Severity
- Instance
- Last Modified By
- Object Owner
- Timestamp
- Select one or more objects to update the status. You also can:
- Create Custom Status: Create a name for a custom status.
- Manage Custom Statuses: View, edit, or delete any custom states.
- Select one or more objects to edit the severity level.
- Select one or more objects to choose an email address of an admin to monitor the incident.
- Export all DLP incidents (up to 500,000 rows) to a CSV file as a summary or including all details.
- Click
 to customize table columns or restore the default ones.
 - View up to 100 DLP incidents per page.
- View multiple pages of the table.
Viewing Object Details
On the DLP page, you can click the Object to see more comprehensive details.

At the top of the Object Details page, you can edit the:
- Status: Choose a status for the object. Click
 to:
to:- Create Custom Status: Create a name for a custom status.
- Manage Custom Statuses: View, edit, or delete any custom states.
- Assigned to: Choose an email address of an admin to monitor the object.
- Severity: Choose a severity level for the object.
- Actions: Perform any of the following actions.
- Encrypt: Encrypt the object.
- Restore: Restore the object.
- Block: Block the object.
Note
The Netskope tenant UI has disabled the encrypt, restore, block actions for files with ‘require check out’ option enabled in Microsoft Office 365 SharePoint Sites. In cases when ‘require check out’ is enabled, a copy of the file will be placed in quarantine, however, the original file will not be deleted.

- Delete: Delete the object.
- Release Email: Release the quarantined email to the recipient (SMTP Proxy incidents only).
- Change File Permissions: Change the object permissions by restricting access to certain admins, users, file owners, etc.
- Contact Users: Contact the users involved with the object.
- Check Object History: View the history around the object, including all incidents that occurred with the object, logs of remediation or actions taken on the object, and other activity and version information related to the object from API Data Protection.
- Download Object: Download the incident object to the folder defined in your Forensic Profile. To learn more: Downloading DLP Incident Files.
- View More: View current summary details on the object, including basic info, shared links, collaborators, and version history.
When a tombstone fails, Netskope displays an error message:


Viewing the Incident Detail
Under Incident Detail on the Object Details page, you can see comprehensive object details:
- Timestamp: The date and time that the violation occurred.
- Type: The type of incident.
- Entity Created: Shows the timestamp of when the entity was created on the SaaS app. This applies to Next Generation API Data Protection only.
- Last Modified: Displays the timestamp of when the entity was last updated or modified. This applies to Next Generation API Data Protection only.
- Last Modified By: The user that made the latest changes to the file when Netskope processed it.
Note
In API Data Protection for ServiceNow, for certain types of activities, the Last Modified By user can be the ServiceNow system administrator user instead of the actual user. This is because for certain activities like a file upload, ServiceNow performs some checks and scans. Due to this the Last Modified By user can be “system” or “admin”.
- Activity: The activity associated with the incident.
- Action Taken: The action taken on the incident based on your policies.
- Violations: The total number of violations with file. The count refers to the aggregated number of records detected across all the policies in the incident. Click
 to go to the Skope IT Alerts.
 - Application: The cloud application (e.g., Dropbox) that triggered the violation.
- Site: The site that triggered the violation. If the Traffic Type is Cloud App, the site displays the cloud app name. If the Traffic Type is Web, the site displays the second level domain name and top-level domain name. For example, for “www.cnn.com”, it’s “cnn.com”.
- Instance: The application instance that triggered the violation.
- URL: The URL of the file or application that triggered the violation.
- Object Name: The file or object name that triggered the violation. Click to go to File Details in API-enabled Protection.
- Object Type: The type of the object that is being acted on. It might be a file, folder, report, document, message, etc.
- File Path: The full file path on the user’s device.
- File Type: The type of file.
- File Size: The file size in bytes.
- File Owner: The creator of the file in the application.
Note
In Google Drive, when you change ownership of a folder, it changes the ownership of the selected folder only and does not include the files inside. For example, if you change the ownership of a folder from user A to user B:
- the ownership of the folder changes to user B.
- the ownership of the contents of the folder i.e., files and folders does not change to user B. It remains with user A.
- File Language: The written language of the file.
- True File Type: The type of true file.
- True File Category: The category of the true file.
- From User: The email address used to login to the SaaS app.
- Channel: The channel of the user for Slack and Slack Enterprise apps.
- Data Classification: The data classification details.
- Incident ID: The incident ID associated with the subfile. If the incident is triggered for the main file, the incident ID will be the same as the parent incident ID.
- Parent Incident ID: The incident ID associated with the main container (or non-container) file that was scanned.
- Object ID: The ID of the object or file.
- MD5: The MD5 hash of the file. You can use this hash value to filter Skope IT events and view other activity associated with the file.
- Connection ID: The ID for the connection incident. Each connection has a unique ID.
- App Session ID: The unique app/site session ID when the Traffic Type is Cloud App or Web. An app session starts when users start using a cloud app/site and end after they’ve been inactive for a certain period of time (e.g., 15 mins). You can use this ID to check all the user activities in a single app session. The app session ID is unique for a user, device, browser, and domain.
- Referer: The referrer URL of the application (with HTTP) that the user visited.
- Source: The user’s city as determined by the Maxmind or IP2Location Geodatabase.
- Destination: The application’s city as determined by the Maxmind or IP2Location Geodatabase.

Viewing Violations
Under Violations on the Object Details page, you can see a list of all the DLP violations for the object:
- Click
 to view a preview of the data identifier matches. You can hover over the highlighted matches to see the DLP profile triggered, data identifier, DLP rule triggered, and severity level. Not all matches are highlighted due to storage limit.
 - Under Overview, see the following:
- Policy: The triggered DLP policy. Click Edit Policy to go to the Real-time Protection page and edit the DLP policy.
- Violations: The total number of violations for the DLP policy.
- Rule Hit: A list of triggered DLP rules.
- Policies: A list of DLP policies associated with the triggered DLP rule.
- Severity: The severity level and hit count for each DLP rule. If you selected Count only unique record under Severity Threshold for a DLP rule, then the severity displays the count as Count: <Number of Violations> unique. If you deselect Count only unique record, the severity count is displayed as Count: <Number of Violations>.
- Under DLP Rule Violations, see the following:
- #: The violation number.
- Preview: A list of the data identifier matches. Hover over to see the triggered data identifier.
- Rule: Click to view details on the associated DLP rule. Click View Rule to go to the DLP Rule page.
- DLP Profile: Click to view details on the associated DLP profile. Click View Profile to go to the DLP Profile page.
- DLP Policy: Click to view details on why the violation triggered the DLP policy. Click Edit Policy to go to the Real-time Protection page and edit the DLP policy.

Workflow Settings
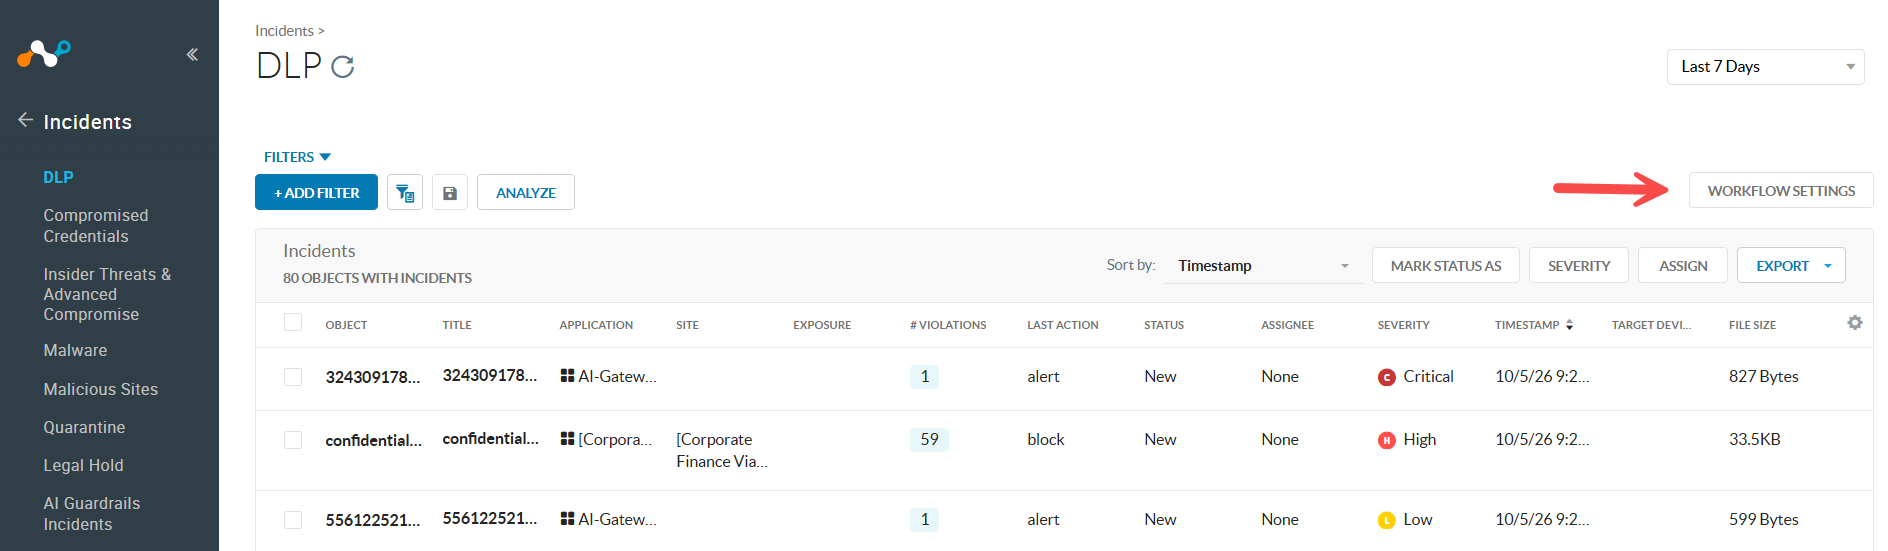
Incidents can be escalated to the manager of the user that triggered the incident. This allows the manager of the acting user to give their verdict, whether the triggering action is required for business purposes or if it violates the company policy. Based on this feedback, the analyst can decide how to proceed with the incident resolution.
The manager must click on the appropriate verdict to complete the workflow. Once a verdict is provided, the verdict cannot be modified and clicking the other verdict will have no effect.
Reminder emails will be sent to the manager 20 days after triggering the workflow.
Workflows expire after 30 days of triggering and will transition to a No Response state, at which point the analyst can re-trigger the workflow.
Prerequisites
Before configuring remediation workflows, ensure the following requirements are met:
- Custom SCIM Attributes are enabled in your organization to retrieve manager email addresses.
- The acting user is imported into the Netskope tenant and has a valid manager email configured in their SCIM profile.
- Your Real-Time Protection policy includes the Add SMTP Header action to quarantine flagged messages. To learn more: Real-Time Protection Policies.
Authorizing Microsoft Exchange Integration
For email quarantine remediation workflows in Microsoft Exchange, complete the following authorization steps:
Step 1: Grant Unified Auth in Netskope
- From the Netskope admin console, go to Incidents > DLP.
- On the right-hand side, click Workflow Settings.
- In the Workflow Settings pane, select the Integrations tab.
- Click Microsoft Exchange, sign in with your Microsoft 365 administrator account, and accept the consent prompt.
- When consent succeeds, Microsoft adds the
Netskope for SMTP Workflowenterprise application to your Microsoft Entra tenant.
- When consent succeeds, Microsoft adds the
Step 2: Assign the Security Administrator Role in Azure Portal
- Sign in to the Azure portal with the same Microsoft tenant.
- In the top search bar, enter
Microsoft Entra roles and administratorsand select Microsoft Entra roles and administrators under Services. - In the All roles page, search for and select Security Administrator.
- Click Add assignments.
- Search for
Netskope for SMTP Workflow, select it, and click Add.
Configuring Approver Mapping
The approver mapping configuration is global for your tenant. To map the custom attribute for manager escalations and email release requests:
-
From the Netskope admin console, go to Incidents > DLP.
-
On the right-hand side, click Workflow Settings.
-
In the Workflow Settings pane, select the Approver Mapping tab.
-
Under Custom Attribute for Manager Email, click the Manager Email – Custom Attribute drop-down list.

-
Select the custom attribute that stores the manager email address for your users.
-
Click Save.
After configuring the workflow, refresh the page to enable the workflow options in the incident details view.
Initiating Workflows
You can initiate remediation workflows directly from the DLP incident details page:
-
From the admin console, go to Incidents > DLP.
-
Click the incident that you want to remediate.
-
Choose the appropriate remediation action:
Escalating Incidents to Managers
-
On the right-hand side, click Initiate Workflow > Escalate to Manager.
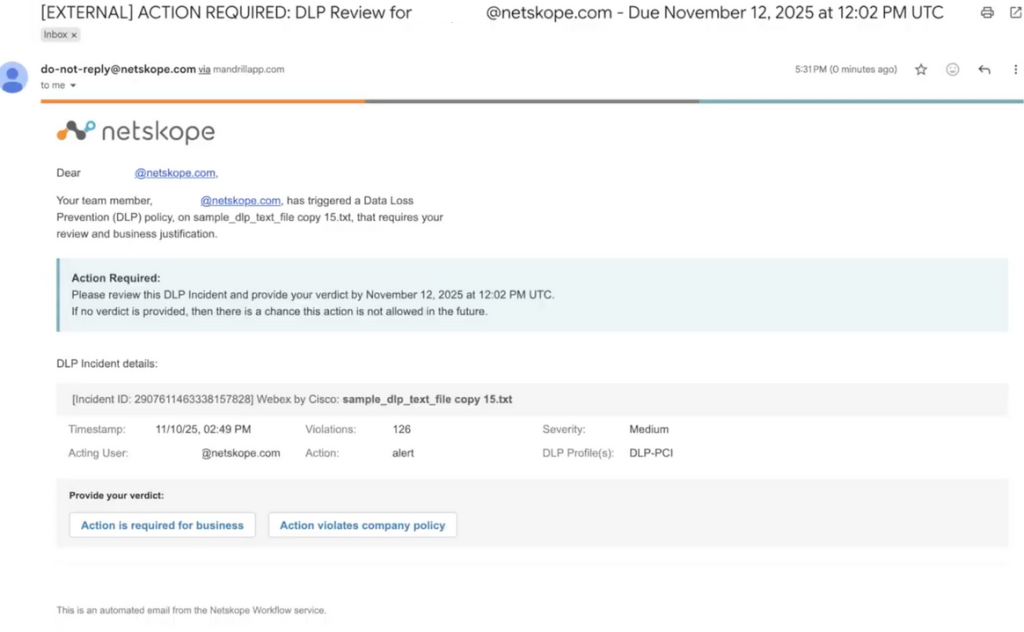
This sends an email notification to the user’s manager asking for their verdict whether the Action is required for business or the Action violates company policy.
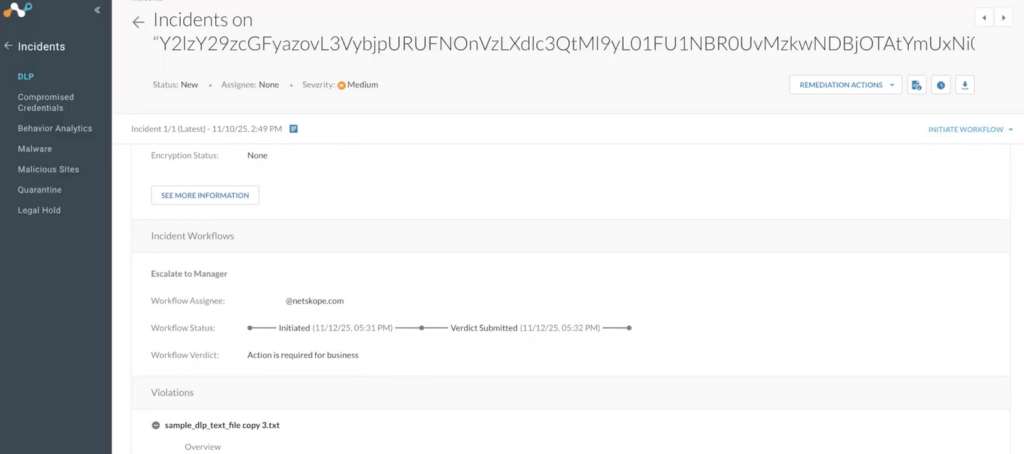
Releasing Quarantined Emails (Microsoft Exchange)
For Email DLP incidents where an email was quarantined in Microsoft Exchange:
-
Direct Release: Click RELEASE EMAIL in the top action bar to immediately release the quarantined email to the recipients without requesting manager approval.
-
Request Manager Approval: Click INITIATE WORKFLOW > Request Approval to Release Email. The workflow initiates immediately and sends an email notification to the sender’s manager.
When you trigger the workflow:
- The sender receives a notification email confirming that the approval workflow was triggered.
- An email notification is sent to the sender’s manager with incident details, including the sender, recipients, subject, timestamp, attachment names, and the specific DLP rules and severity levels violated. The manager can click Release or Reject directly from the email notification.
- Both the sender and the analyst receive email notifications regarding the manager’s approval or rejection verdict.
-


Workflow Statuses and Tooltips
The following table describes the interface states and tooltips displayed for remediation workflows:
| Workflow State | Description | Tooltip Text |
|---|---|---|
| Missing Attribute Mapping | The custom attribute mapping has not been configured in Workflow Configuration. | Specify the custom attribute mapping in the Workflow Configuration page in order to enable and utilize this workflow. |
| Workflow In Progress | An approval workflow has already been initiated for this incident. | Request Approval to Release Email workflow has already been initiated. You can re-initiate this workflow after 30 days from the initial trigger date if the manager does not provide a verdict by then. |
| Missing Acting User Email | The acting user email is missing or cannot be resolved. | No valid acting user email to use when referencing the manager to contact when attempting to release the quarantined email. |
| Email Released | The email was already released from quarantine (including duplicate incidents for the same email). | The RELEASE EMAIL button and Request Approval to Release Email menu option are disabled, and a notification indicates that the email was already released. |
| Not a Quarantined Email | The incident is not a quarantined email incident. | Email Quarantine Release Workflow is only available for quarantined email incidents |
| Not an SMTP Proxy Incident | The incident was not detected by the SMTP Proxy. | Email Quarantine Release Workflow is only available for incidents detected by the SMTP Proxy |
| Not Microsoft Exchange | The email incident did not originate from Microsoft Exchange. | Email Quarantine Release Workflow is only available for Microsoft Exchange email incidents |
| Missing Exchange Grant | No Microsoft Exchange instance access has been granted. | Grant access to a Microsoft Exchange instance in Workflow Configuration Integrations page in order to enable this workflow |
| Quarantine Expired | The 30-day quarantine retention window has passed. | Email can no longer be released from quarantine, as a quarantined email is only retained for 30 days from the incident date |
All workflow actions, manager responses, and release operations are recorded in the incident details under Incident Workflow Details and Object History.
Adding Notes to DLP Incidents

Notes can now be added to DLP incidents. Notes have 512 character limit and up to 25 notes can be added.
Note privileges can be found in Settings > Administration > Roles > (Role) > Privileges > Incidents > DLP. You will be able to set roles to view-only (View) or adding-allowed (Manage).

To add a note:
-
Go to Incidents > DLP.
-
Click on any Incident.
-
Click the Incident Notes button highlighted above. This will open the Incident Notes window.

-
Enter your text and press Add Note. Added notes will be associated with the user who logged in while adding them. Users (with at least write permission) can be tagged with @. These notes will notify the person assigned to the incidents including those tagged on the specific note.


In the event that there are multiple Incidents in one Incident Event, each Incident will maintain its own note thread.
Viewing DLP Incidents Related to Deleted Files
To see if a file was deleted:
- Go to Incidents > DLP.
- Click the Object. The Object Details page appears.
- Under Actions, Netskope displays an attention message:
