

Review these sections for troubleshooting information.
Architecture, Installation, and Hosting
The Cloud Exchange UI is not accessible
Here’s how to troubleshoot the issue:
If the issue is not resolved, please contact Netskope Support.
You need to check the status of the cloud exchange container. Check the status using these commands:
For Ubuntu/CentOS: sudo Docker ps
For RHEL: sudo podman-compose ps
If the containers are not running, use this command to start the containers: ./start
If you are using RHEL, make sure SELinux is disabled, because Cloud Exchange is not officially tested on SELinux. We recommend that you disable the SELinux.
Also check the status of ipv4 forwarder status using this command:systemctl net.ipv4.ip_forward
If the value of this command is 1, that means it is enabled. But if the value is 0, then you need to enable this by executing this command:systemctl net.ipv4.ip_forward=1
In order to check the container status, you need to go to the folder ta_cloud_exhange.
If your containers are running, then you need to check your network connectivity of the host machine. You can use these commands to check the connectivity:curl -v <IP of Local Host>:443 [i.e curl -v 127.0.0.1:443]curl -v www.github.com:443
If the connectivity is working, then you check by restarting CE. Use these command to restart CE:./stop ./start
Also, there is a possibility that your SSL certificate has expired. If you are using any corporate SSL certificates, then validate the certificate. If you are using the default Cloud Exchange SSL certificate, then the certificate is valid for one year. Check that also.
If the certificate has expired, then follow the instructions in this document.
Now try rebooting the VM.
An error occurred while importing the netskope plugin.
Scenario: In older versions of CE user might start seeing errors related to the importing of plugins continuously.

Impact: CE is functioning correctly but import errors are continuously getting logged in CE Audit logs.
Resolution: There is no functional impact of this error, so you can safely ignore this error.
No AWS Credentials were found in the environment.
Issue Description
When attempting to save the plugin, you encounter the following error:
Error: Value error, Validation error occurred. No AWS Credentials were found in the environment. Deploy the
plugin into AWS environment or use AWS IAM Roles Anywhere authentication method.
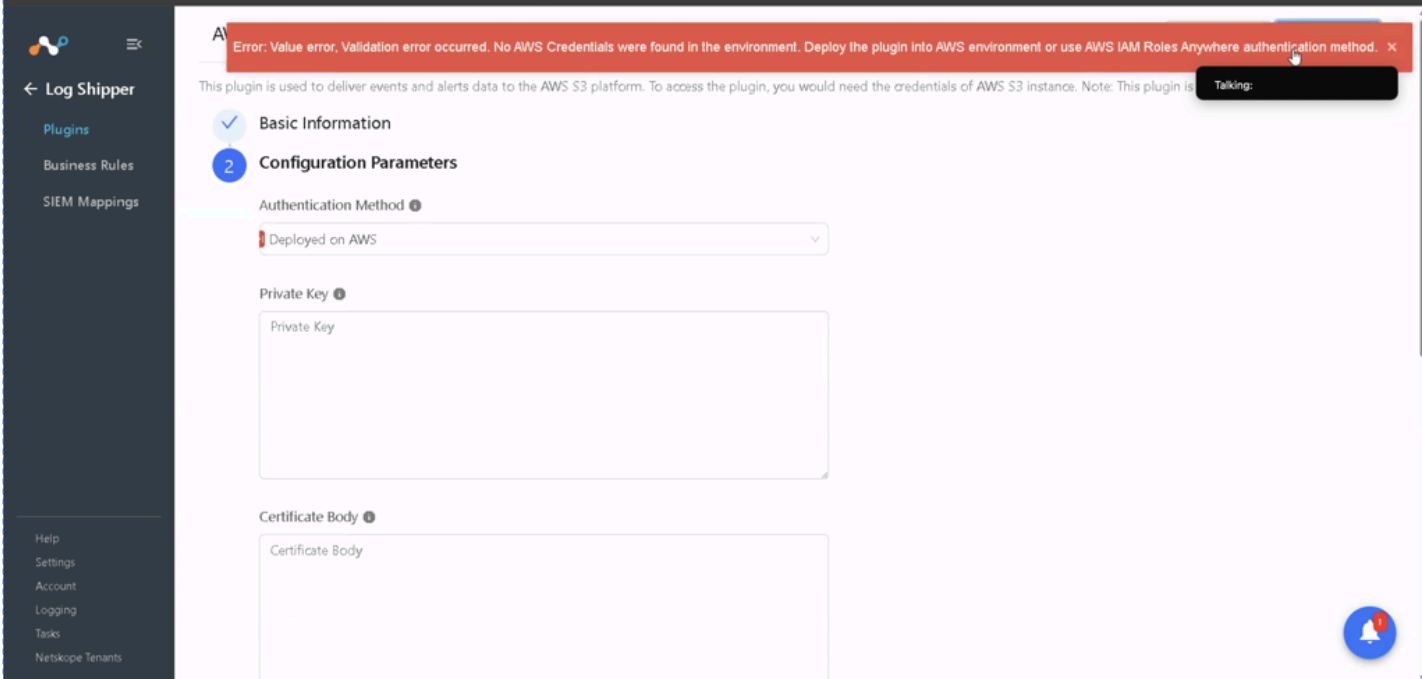
When you face this error the primary reason is likely related to the “HTTP PUT response hope limit” configured at your AWS EC2 instance metadata. It determines how far HTTP requests to the Instance Metadata Service can travel in the network before being discarded.
What to Do
To resolve this issue, youʼll need to increase the “HTTP PUT response hop limit” on your EC2 instance. Based on your preference, proceed with one of the options below to update this setting.
Option 1 : Update Metadata Settings via AWS Console
1. Navigate to EC2 instance in the AWS Console < Select the EC2 instance < Actions < Modify Instance Metadata Options.

2. Once you click on the “Modify Instance Metadata Options” you will see something like below.

3. You likely find the Default hop limit set to 1. This means the metadata response will only go to the originating instance, and not be routed beyond that. Update the “HTTP PUT response hope limit” value to 3 and save the configuration.
4. Once done Navigate to Cloud Exchange and try to save the plugin. It should result in successful plugin configuration.
Option 2 : Use AWS CloudShell (Command Line)
If you prefer using the CLI or donʼt see the option in the console:
1. Open AWS CloudShell.
2. Check the current hop limit (replace i-xxxxxxxxxxxxxxxxx with your EC2 instance ID):
aws ec2 describe-instances --instance-ids i-xxxxxxxxxxxxxxxxx --query
'Reservations[].Instances[].MetadataOptions'
3. Verify the current value of the http-put-response-hop-limit parameter.
4. Update the hop limit to 3 (replace i-xxxxxxxxxxxxxxxxx with your EC2 instance ID):
aws ec2 modify-instance-metadata-options \
2 --instance-id i-xxxxxxxxxxxxxxxxx \
3 --http-put-response-hop-limit 3
5. Confirm the change using below command.
aws ec2 describe-instances --instance-ids i-xxxxxxxxxxxxxxxxx --query
'Reservations[].Instances[].MetadataOptions'
6. When done, go to Cloud Exchange and try to save the plugin. It should result in successful plugin configuration.
RabbitMQ Container Status Down for some nodes in CE HA Deployment
RabbitMQ Container status is showing down. To troubleshoot: Open CE UI and check container status for RabbitMQ container in Each node and if RabbitMQ Container status is down in majority of nodes, perform these steps:

1. Open RabbitMQ Management UI this URL:
http://<CE_UI_IP>:15672/
Username: user Password: Maintenance password of CE  If you have observed these errors:Network partition Detected.mnesia reports that this RabbitMQ cluster has experienced a network partition. Steps to Resolve Network partition issue 1. Stop containers one by one using stop script:
$ sudo ./stop
2. Start CE nodes again one by one(Run Start script in primary node first):-
$ sudo ./start
3. Monitor CE Home dashboard and RabbitMQ Dashboard as well. Note: In queue ingestion/sharing tasks will be lost present in CE that are not yet performed by CE.
RabbitMQ error while Migration. “Node ‘rabbit@instance1’ thinks it’s clustered with node ‘rabbit@instance2’, but ‘rabbit@instance2’ disagrees”

Scenario: If you are modifying an existing cluster and experience clustering issues after halting with the stop script and then initiating with the start script, particularly during node addition/removal or migration, this problem may arise.
Resolution: If your message is as below that means there was some issues while removing instance2 from the cluster. “Node ‘rabbit@instance1’ thinks it’s clustered with node ‘rabbit@instance2’, but ‘rabbit@instance2’ disagrees”
- Execute the stop script in the instance2.
$ sudo ./stop - Go to the instance1 and execute below command. (make sure to replace the instance1 with the actual IP or hostname). If you are running docker, use this command:
$ docker-compose -f docker-compose-ha.yml exec -- rabbitmq-stats rabbitmqctl forget_cluster_node rabbit@instance2
In case of podman, use this command:
$ podman-compose -f podman-compose-ha.yml exec -- rabbitmq-stats rabbitmqctl forget_cluster_node rabbit@instance2 - Then execute start script in instance2.
$ sudo ./start
CE Sizing Profile Check: Failed for Large profile or CE Sizing Profile Check: Failed for Medium profile
Scenario: While executing the setup script, you might see the following error due to a system specification that is not compatible with CE: CE Sizing Profile Check: Failed for Large profile” or “CE Sizing Profile Check: Failed for Medium profile”.

Impact: You will not be able to configure the CE until the minimum system requirements are met.
Resolution:
- Make sure your machine has exactly 8 or 16 CPU count to determine the medium or large profile respectively.
Note that if the machine is deployed on an on-premises infrastructure, update the CPU count to match the profile as per your requirements. If the machine is deployed on a cloud infrastructure (like AWS, Azure), you will need to create a new instance. - For medium profile minimum RAM and Total disk space is 16GB and 80 GB, respectively.
- For large profile minimum RAM and Total disk space is 32GB and 120 GB, respectively.
- Minimum 20 GB free disk space is required for both profiles.
There’s a Cloud Exchange UI Accessibility Issue from the Browser. What can I do?
If you encounter freezing or inaccessibility of the Cloud Exchange UI from your browser, this may be related to a configuration requirement in Docker/Podman environments. Docker specifically requires the net.ipv4.ip_forward setting to be enabled for outbound connectivity (https://github.com/moby/moby/issues/490). It’s important to note that while Docker expects users to enable this setting manually, Podman handles this differently, see https://github.com/containers/podman/issues/399.
The installation failed/hit a strange error. How do I get help?
If you encounter any errors during the installation, migration, or upgrade of Cloud Exchange, we’re here to assist you. Please follow the steps below to get help:
- Open a Support Ticket: If you encounter any error during installation, migration, or upgrade of Cloud Exchange, please open a support ticket with Netskope support. Our team of engineers will promptly assist you in resolving the issue.
- Provide Relevant Details: When opening a support ticket, please ensure to include the following details:
- Platform logs: You can export platform logs by going to Cloud Exchange > Logging > Export Logs.
- Diagnostic logs: Refer to the documentation here to collect diagnostic logs.
Additional Resources:
For detailed documentation on various aspects of Cloud Exchange, please refer to the following links:
- For Installation: Installation Documentation
- For Upgrading and Migration: Upgrading to the Latest Version Documentation
- For High Availability Deployment: High Availability Deployment Documentation
We’re committed to ensuring a smooth experience with Cloud Exchange and are here to support you every step of the way.
There is an issue while starting the docker container. What should I do?
The error message is this:
Network netskope-cloud-threat-exchange-docker-compose_default Error 0.0s failed to create network netskope-cloud-threat-exchange-docker-compose_default: Error response from daemon: could not find an available, non-overlapping IPv4 address pool among the defaults to assign to the network.
The issue is specific to the network of the machine. The docker network conflicts with the host network and because of that the docker network is not created successfully. To change the network configuration of the docker you can refer to: https://docs.docker.com/compose/compose-file/06-networks/
Getting a Bad Gateway error in the UI
Possible Root Cause
- Core Container was restarting. Check the core container status using these commands:.
docker ps [Ubuntu]
podman-compose ps [RHEL]
Follow these steps for issues related to IoCs
- First review the dore container logs.
docker compose logs -f core [Ubuntu]
podman-compose logs -f core [RHEL]
If you observe the below error, it indicates that the Core container is not able to connect to the RabbitMQ container.
PLAIN login refused: user 'user'
First you can remove the RabbitMQ data using this command.
Go to Cloud Exchange folder.rm -rf data/rabbitmq/data/rabbit@rabbitmq-stats*
But this will result in data loss of current queues. Another step is to re-create the RabbitMQ user.Log in in to RabbitMQ container.
docker exec -ti <Container ID> sh
podman exec -ti <Container ID> sh
Create User in RabbitMQ
- List Users
rabbitmqctl list_users
Delete Existing User
rabbitmqctl delete_user user
This adds a new user and password.
rabbitmqctl add_user user <MAINTENENCE_PASSWORD>
This makes the user an administrator.
rabbitmqctl set_user_tags user administrator
This sets permissions for the user.
rabbitmqctl set_permissions -p / user "." "." ".
I got a Bad Gateway error. What could cause this?
There are 3 possible causes:
- Mongo data directory permission issue.
- The Core/Mongo-DB container is down.
- The CE maintenance password is incorrect.
1. For the Mongo data directory permissions issue
Verify
Execute ls -lRn . inside the directory with docker-compose.yml.
The mongo-data dir should be read/write accessible to the user with UID 1001.
./data/mongo-data:
total 0
drwxr-xr-x. 3 1001 0 16 Apr 14 18:16 data
Solution to mongo data directory permissions issue:
Execute the setup script again using ./setup to fix the file permissions.
Restart CE.
2. For the core/mongo-db container is down issue
Verify
Check the container status using sudo docker-compose ps, all the containers should be Up.
$ sudo docker-compose ps
Name Command
State Ports
----------------------------------------------------------------------------------------------------------------
ce_330_core_1 /bin/sh start.sh Up 80/tcp
ce_330_mongodb-primary_1 /opt/bitnami/scripts/mongo ... Up 0.0.0.0:27018->27017/tcp ce_330_rabbitmq-stats_1 /opt/bitnami/scripts/rabbi ... Up 15671/tcp, 0.0.0.0:15672->15672/tcp, 25672 /tcp, 4369/tcp, 5551/tcp, 5552/tcp, 5671/tcp, 0.0.0.0:5672->5672/tcp
ce_330_ui_1 /bin/sh start.sh Up 0.0.0.0:443->3000/tcp, 80/tcp ce_330_watchtower_1 /watchtower --http-api-update Up 0.0.0.0:8080->8080/tcp
Solution to core/mongo-db container is down:
If any containers are down follow the below steps:
sudo docker-compose down
sudo ./start
3. For the maintenance password is incorrect Issue
Verify
Check the core logs using `sudo docker-compose logs core` for any “authentication error”.
Check if the customer is using CE version 3.2.0 or below 3.2.0 with the same MongoDB.
Solution to the maintenance password is incorrect:
Perform these steps:
sudo docker-compose down
sudo rm -rf .env
sudo ./setup
Add maintenance password as "cteadmin"
sudo ./start
Cloud Exchange shows numerous errors after it was successfully set up (fetching error, internal server error, etc.)
A special character was potentially used for the maintenance password during setup, which RabbitMQ does not support and causes issues with other services attempting to schedule tasks as cross-container communication fails to engage RabbitMQ.
Run the following commands from the directory where docker-compose.yml resides to reconfigure the maintenance password:
sudo docker-compose down
sudo rm -rf .env
sudo ./setup
Add maintenance password.
sudo ./start
After rebooting, the server/VM containers are not starting.
This issue arises because Podman does not include the facility to automatically restart containers after a reboot. This behavior is particularly relevant for users of RHEL (Red Hat Enterprise Linux) servers where Podman is commonly used. Users will need to manually start the containers post-reboot. Here are the detailed steps to do so:
- Go to the Cloud Exchange Directory:
$ cd <ce_directory>
Note that for CE as a VM, the Cloud Exchange directory is:
/opt/cloudexchange/cloudexchange
- Check the Status of the Containers:
$ podman-compose ps
- Start Cloud Exchange:
$ ./start
For users operating with Docker on other VMs like Ubuntu or CentOS, there’s no need to take any manual action for container restarts. Docker includes an auto-restart feature that ensures containers automatically restart after a reboot. This automatic restart functionality provides a seamless experience without the need for manual intervention post-reboot.
Cloud Exchange Inaccessibility (Missing AVX Support)
Cloud Exchange (CE) may become inaccessible after a restart, migration, or infrastructure change. This can appear as the web UI not loading or core services failing to start.
A common reason is that the system does not have AVX (Advanced Vector Extensions) support, which is required by MongoDB 5.0+ (used in CE).
Typical Symptoms
- CE web interface shows errors (e.g., 400 Bad Request).
- mongodb-primary and core containers are in an exited state, while other containers (UI, RabbitMQ) are still running.
CE was working fine earlier but became inaccessible after a restart, migration or upgrade.
Root Cause
MongoDB 5.0+ requires CPUs with AVX instructions. If the host machine (physical or virtual) does not support AVX or if AVX is disabled MongoDB cannot start, which in turn stops core CE services.
Steps to Troubleshoot
- Check container status
podman ps -a
- Look at the state of mongodb-primary and core containers.
- Review MongoDB logs
From the CE directory, run:sudo docker-compose logs -f mongodb-primary | grep "AVX"
- If AVX support is missing, you will see warnings like:
MongoDB 5.0+ requires a CPU with AVX support, and your current system does not appear to have that!
- Check AVX availability
lscpu | grep -i avx
Resolution
- Ask your IT/VM team to confirm and enable AVX support on the host or VM.
- For virtual machines, ensure AVX is exposed to the guest system.
After enabling AVX, restart CE services:
- podman-compose down && podman-compose up -d
Confirm that MongoDB and core containers start successfully, and that the CE UI is accessible.
Next Step: If AVX is enabled but the issue continues, please share logs/screenshots with the support team so we can assist further.
Unable to resolve hostname: Temporary failure in name resolution
Issue Overview
Cloud Exchange UI inaccessible due to missing DNS resolution getting “Hostname does not resolve error when try to execute any command in Cloud Exchange Host Machine”
Typical Symptoms
- Cloud Exchange UI is not accessible.
- When you try to restart the Cloud Exchange, getting Hostname does not resolve error.
Root Cause
The file which contains all the DNS configuration got removed. Due to this, the machine is not able to resolve the hostname.
Steps to Troubleshoot
- Check the DNS resolution on the Cloud Exchange server by attempting to run basic Docker commands:
sudo docker ps
- If you receive Name does not resolve errors, proceed to next step.
- Verify the existence of the resolv.conf file:
cat /etc/resolv.conf
- If the resolv.conf file is missing, create it and add your DNS server details:
vi /etc/resolv.conf
- Add your DNS server entries in the following format:
nameserver [DNS_SERVER_IP_1]
nameserver [DNS_SERVER_IP_2] - Save this file.
- Press
Esc - Type
:wq! - Press Enter (key)
- Press
- Reboot the machine to apply the DNS configuration changes.
- Verify that all Docker containers are running properly:
sudo docker ps
- Ensure the following containers are up and running:
cloudexchange_ui_1

cloudexchange_core_1

cloudexchange_rabbitmq-stats_1

Cloudexchange_mongodb-primary_1 - If still facing the issue, please collect the diagnose logs and create a support case. For diagnostic log generation troubleshooting, refer to: Generate Diagnostic Logs.
Could not verify Podman/Podman-compose/Podman-plugins version of the machine while executing setup script for Cloud Exchange installation and even though you’ve verified that podman, podman-compose, and podman-plugins are installed on the server.
Issue Summary:
- While installing Cloud Exchange in your RHEL server, you are observing the following error: “Could not verify Podman/Podman-compose/Podman-plugins version of the machine” and you have confirmed that podman, podman-compose, and podman-plugins are already installed on the server as per the following guideline documentation here.
Common Symptoms:
Firstly, please check the python3 version on your server:
- Please confirm the python3 version in your machine using the command:
python3 --version
If you are using Python 3.6.8 or older version on your server, then this is the reason for your issue.
Root Cause:
- With python 3.6.8 and its associated pip3, the podman-compose is installed and causes conflicting issues.
Troubleshooting Steps/Resolution:
Please note that Cloud Exchange utilizes python 3.11 or above as we have highlighted in the following documentation as well: /en/cloud-exchange-system-requirements#system-specifications
Hence, we recommend you to please remove podman-compose and then install python3.11 and then reinstall podman-compose. Please follow below steps:
- Remove podman-compose using command:
sudo pip3 uninstall podman-compose - Install python3.11 and setting alternative:
yum install -y python311yum module enable python311alternatives --set python3 /usr/bin/python3.11python3 --version (should point to Python 3.11.x) - Podman-compose installation commands:
sudo pip3 install podman-composesudo ln -s /usr/local/bin/podman-compose /usr/bin/podman-compose(soft link for podman-compose)
Once these steps are completed, you can confirm the podman-compose version using the previously shared command and then you move forward with Cloud Exchange installation with setup script execution.
Reference:
- For your reference, you can review this guide wherein CE system specifications are highlighted: CE System Specifications
Setup script fails during fresh installation or upgrade/migration.
Issue Summary: Setup script fails during fresh installation or upgrade/migration with the following error message:
Incompatible versions found for pyyaml. Please make sure the dependencies (pyyaml>=6.0.0 | python-dotenv>=0.20.0,<=1.0.0 | pymongo>=4.6.3,<=4.7.3) are satisfied before running •/setup script.
Common Symptoms: Either the python dependencies are not present or the version is not compatible with the current CE version being installed.
Root Cause:
Potentially, due to CE upgrade from a lower to a higher version, the supported minimum versions were upgraded or during a fresh installation all the dependencies were not installed properly.
Troubleshooting Steps/Resolution:
First, navigate to the cloudexchange root directory where the environment is stored.
Cloud Exchange as a VM Deployment
cd /opt/cloudexchange/cloudexchange
If using Containerized Deployment
cd <ta_cloud_exchange_directory>
Recreate the Virtual Environment
python3 -m venv --clear .cevenv
Activate the Virtual Environment
source ./.cevenv/bin/activate
Install Required Packages
pip3 install "pyyaml>=6.0.0"

pip3 install "python-dotenv>=0.20.0,<=1.0.0"

pip3 install "pymongo>=4.6.3,<=4.7.3"
Deactivate the Environment
deactivate
Unable to setup HA cluster due to input/output error in expand log section while adding secondary nodes
Issue Summary: Setup script fails during HA setup due to input/output error .

Troubleshooting Steps/Resolution:
First, navigate to the cloudexchange root directory where the environment is stored for that particular node.
Cloud Exchange as a VM Deployment
cd /opt/cloudexchange/cloudexchange
If using Containerized Deployment
cd <ta_cloud_exchange_directory>
Run the this command (replica 1for first secondary node else replica 2 for second secondary node)
gluster volume remove-brick CloudExchange replica 1 <node_ip>:/opt/shared/gluster/bricks/1/brick force
Run this on primary node
gluster peer detach <replica node_ip>
umount /opt/shared/data
rm -rf /opt/shared/*
Cloud Exchange Setup Failure: Connection Timeout for hub.docker.com
Issue Description
During the execution of the setup script for containerized deployments of Cloud Exchange, users encounter a connection timeout error when attempting to connect to hub.docker.com. This occurs even when network settings appear to permit the connection.
Root Cause
The issue is linked to recent changes on Docker Hub (Docker’s side) and is not related to Cloud Exchange itself.
These changes are causing the Cloud Exchange setup pre-requisite check for Docker Hub to fail specifically for containerized deployments.
Users deploying Cloud Exchange as VM) are not affected by this issue.
Interim Workaround
While the product team is actively working on a permanent fix, you can use the following workaround:
1. Standalone Deployments
For standalone deployments only, you can bypass the failing prerequisite check by using the –ignore-failures flag with the setup script.
python3 ./setup --ignore-failures
2. High Availability (HA) Deployments
For High Availability (HA) deployments, reach out to the support team for assistance with the setup.
Resolution
The team is actively working on a fix for this issue. Please monitor release notes for updates that address this known limitation.
Secondary nodes are successfully added to the cluster, but their containers are not starting automatically
Issue Overview
When a secondary node is added to the Cloud Exchange HA cluster, sometimes because of the network throughput and latency the new docker image pull might take some elongated time. due to which the containers on the new node does not get started automatically.

Steps to start the services on new node
- Go to the CE installation directory on the newly added secondary node
- Execute the start script
sudo ./start - Verify the status of the services of newly added node after completion of start script.
Transport Endpoint Not Connected Error in Cloud Exchange with HA
Scenario
This guide walks you through completely removing GlusterFS and clearing all leftover FUSE state to permanently resolve the error:
Transport endpoint is not connected
The fix requires three things: uninstalling packages, cleaning all leftover FUSE and mount cache, and rebooting the server. Skipping any step may leave the system in a broken state.
Prerequisites
- Root or sudo access on the affected server
- GlusterFS service must be stopped before proceeding
- Schedule a maintenance window a reboot is required
Resolution
Step 1 — Stop GlusterFS Service:
- For RHEL Operation System
systemctl stop glusterd
systemctl disable glusterd
- For Ubuntu Operating System
sudo systemctl stop glusterd
sudo systemctl disable glusterd
Step 2 — Remove GlusterFS Packages
- For RHEL Operating System:
- Note: You have to use
dnfon latest OS (RHEL 8+)
- Note: You have to use
sudo dnf remove glusterfs glusterfs-fuse -y
- For Ubuntu Operating System:
- You have to use apt to remove GlusterFS and its associated FUSE client
sudo apt remove --purge glusterfs-server glusterfs-client glusterfs-common -y
sudo apt autoremove -y
⚠ Note: The –purge flag removes package configuration files in addition to the binaries. The autoremove step cleans up any unused dependency packages.
Step 3 — Clean Leftover FUSE & Mount Cache (Critical Step)
This is the step that actually fixes the “Transport endpoint not connected” error permanently. Stale FUSE session data and mount cache entries survive a normal uninstall and will cause the error to recur on the next mount attempt.
- For RHEL or Ubuntu Operating Systems, you can follow the below steps:
- Remove all GlusterFS state directories:
sudo rm -rf /var/lib/glusterd
sudo rm -rf /var/run/gluster
sudo rm -rf /var/log/glusterfs
sudo rm -rf /etc/glusterfs
- Now, please kill any lingering GlusterFS processes to clear stale FUSE sessions:
sudo pkill -9 glusterfs
sudo pkill -9 glusterfsd
- Now, specifically, for Ubuntu Operating System, please also unmount any stale FUSE mount points that may remain:
- List any still-mounted GlusterFS entries:
sudo mount | grep glusterfs
- Force-unmount each one (replace /mnt/gluster with your actual mount point):
sudo umount -f -l /mnt/gluster
⚠ Note: The -l flag performs a lazy unmount, which detaches the filesystem from the namespace immediately even if it is still busy. This is safe to use when removing a broken GlusterFS mount.
Step 4 — Reboot the Server
For RHEL or Ubuntu Operating System:
sudo reboot
The reboot clears kernel-level FUSE handles that survive the uninstall. Without a reboot, the kernel may still hold references to the old GlusterFS FUSE module, causing mount failures even after the packages have been removed.
Post-Reboot Verification
After the server comes back up, please confirm that GlusterFS is fully gone:
For RHEL Operating System, please follow below steps to valid steps:
- Confirm no GlusterFS packages remain:
rpm -qa | grep gluster
- Confirm no GlusterFS mounts are active:
mount | grep gluster
- Confirm no GlusterFS processes are running:
ps aux | grep gluster
For Ubuntu Operating System, please follow below steps to valid steps:
- Confirm no GlusterFS packages remain
dpkg -l | grep gluster
- Confirm no GlusterFS mounts are active
mount | grep gluster
- Confirm no GlusterFS processes are running
ps aux | grep gluster
All three commands should return empty output. If any packages or mounts are still listed, repeat the relevant steps above.
Install Python 3.11 on RHEL 9.5 or above without changing the default Python settings
Give sudo its own private PATH (secure_path)
Use a python3 that points to 3.11, while leaving the system-wide /usr/bin/python3 untouched.
# 1. install python3.11
sudo dnf install -y python3.11

# 2. sudo-only bin dir with a python3 -> 3.11 symlink
sudo mkdir -p /usr/local/sudo-bin
sudo ln -sf /usr/bin/python3.11 /usr/local/sudo-bin/python3

# 3. Write the sudoers override LOCALLY first, then copy in
cat > /tmp/python311_secure_path << 'EOF'
Defaults secure_path="/usr/local/sudo-bin:/usr/local/sbin:/usr/local/bin:/usr/sbin:/usr/bin:/sbin:/bin"
EOF

# 4. Validate BEFORE installing into /etc/sudoers.d
sudo visudo -cf /tmp/python311_secure_path

# 5. Install (only if step 4 said "parsed OK")
sudo install -m 0440 -o root -g root /tmp/python311_secure_path /etc/sudoers.d/python311_secure_path
rm -f /tmp/python311_secure_path

# 6. Re-validate the whole sudoers config
sudo visudo -cf /etc/sudoers
Add an alias Python3 -> 3.11 for Interactive Shells (normal user + root)
# normal user (~/.bashrc)
echo "alias python3=/usr/bin/python3.11" >> ~/.bashrc

# root (/root/.bashrc) — needed separately, root has its own rc file
sudo bash -c 'echo "alias python3=/usr/bin/python3.11" >> /root/.bashrc'

# apply to current shells
source ~/.bashrc
sudo -i bash -c 'source /root/.bashrc'
Configure a Systemd Drop-In Override
# add a drop-in override (survives ./setup regenerating the base unit file)
sudo mkdir -p /etc/systemd/system/cloud-exchange.service.d
sudo tee /etc/systemd/system/cloud-exchange.service.d/override.conf << 'EOF'
[Service]
Environment="PATH=/usr/local/sudo-bin:/usr/local/sbin:/usr/local/bin:/usr/sbin:/usr/bin:/sbin:/bin"
EOF

#If the Management Server is running, perform a restart.
sudo systemctl daemon-reload
sudo systemctl restart cloud-exchange
Validate Changes
sudo python3 --version   # -> Python 3.11.x   (via /usr/local/sudo-bin/python3)
python3 --version        # -> python3.11.x       (system default)
HA Nodes Go Down and Cluster Status Differs Between Primary and Secondary Nodes
Issue summary
In Cloud Exchange HA deployments running on Ubuntu 24, HA nodes may appear to go down automatically. The cluster status can also differ between the primary and secondary nodes even though the containers are running when checked from the CLI.
Affected deployments:
- Containerized Cloud Exchange HA deployments running v6.0.0, v6.0.1 or v6.1.0 on Ubuntu 24
- Cloud Exchange VM HA deployments running v7.0.0-beta with built-in Ubuntu 24
Symptoms
After the HA setup runs continuously for 1–2 days, the UI may show inconsistent container status across nodes and in some cases, the working of CE is also affected:
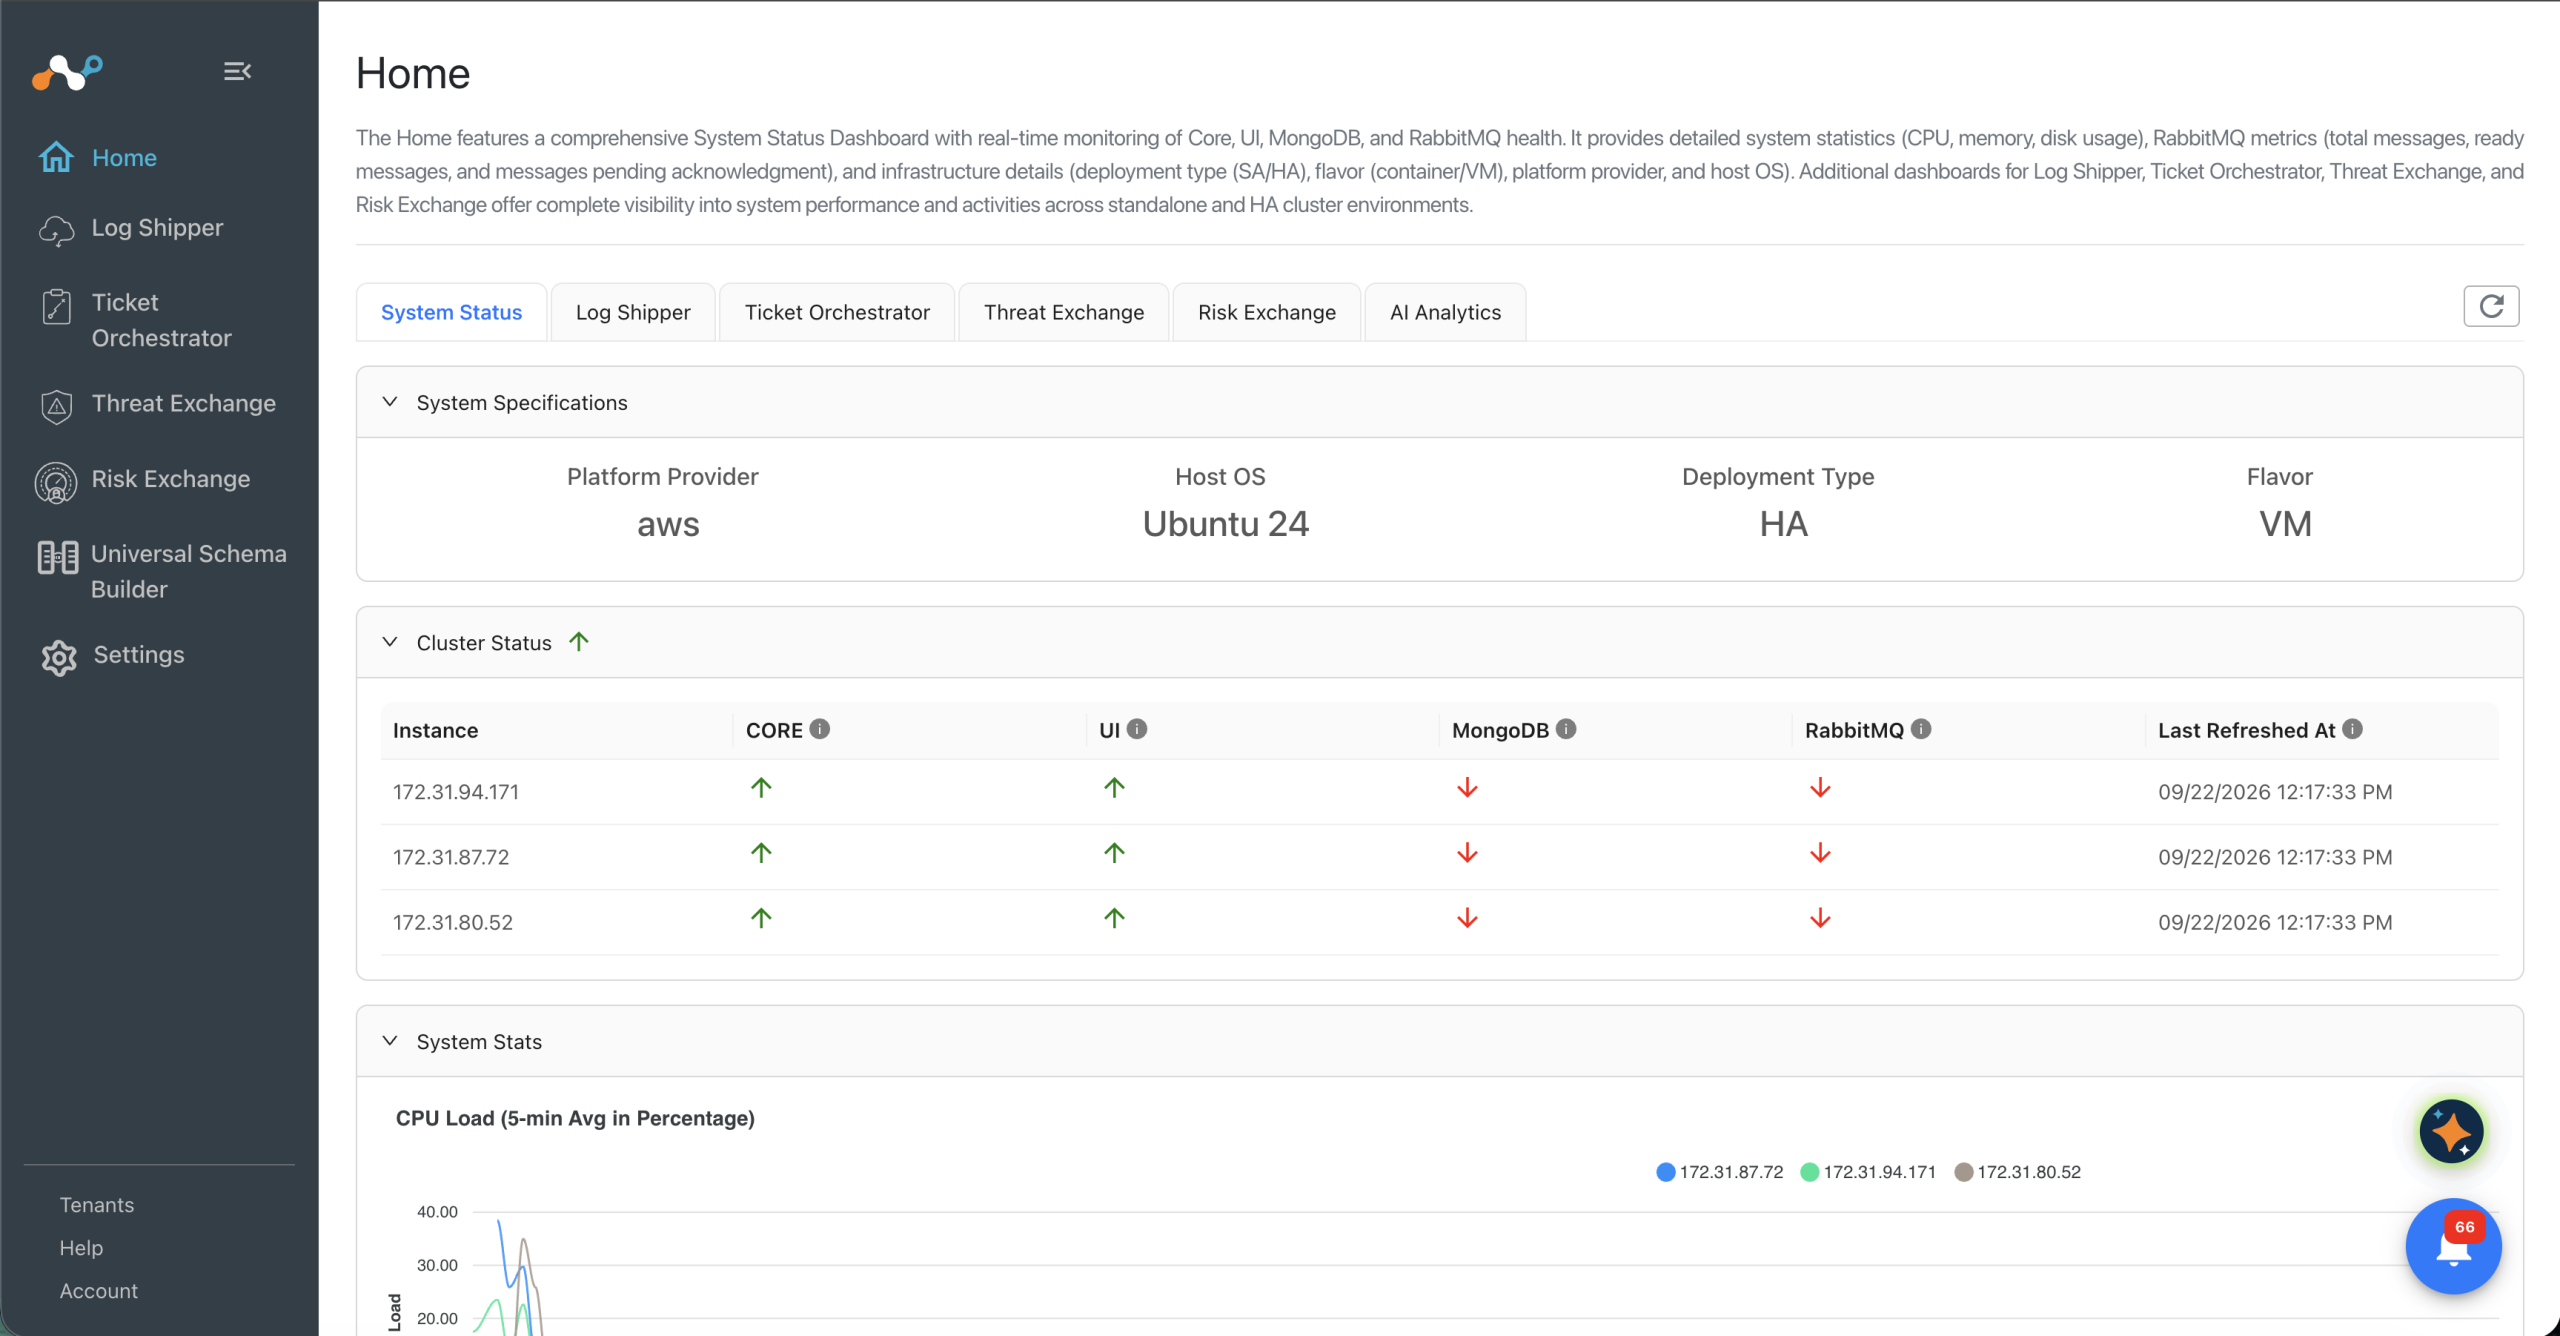
- On the primary node, the Core and UI containers for all nodes are shown as UP, while the MongoDB and RabbitMQ containers for all nodes are shown as DOWN.
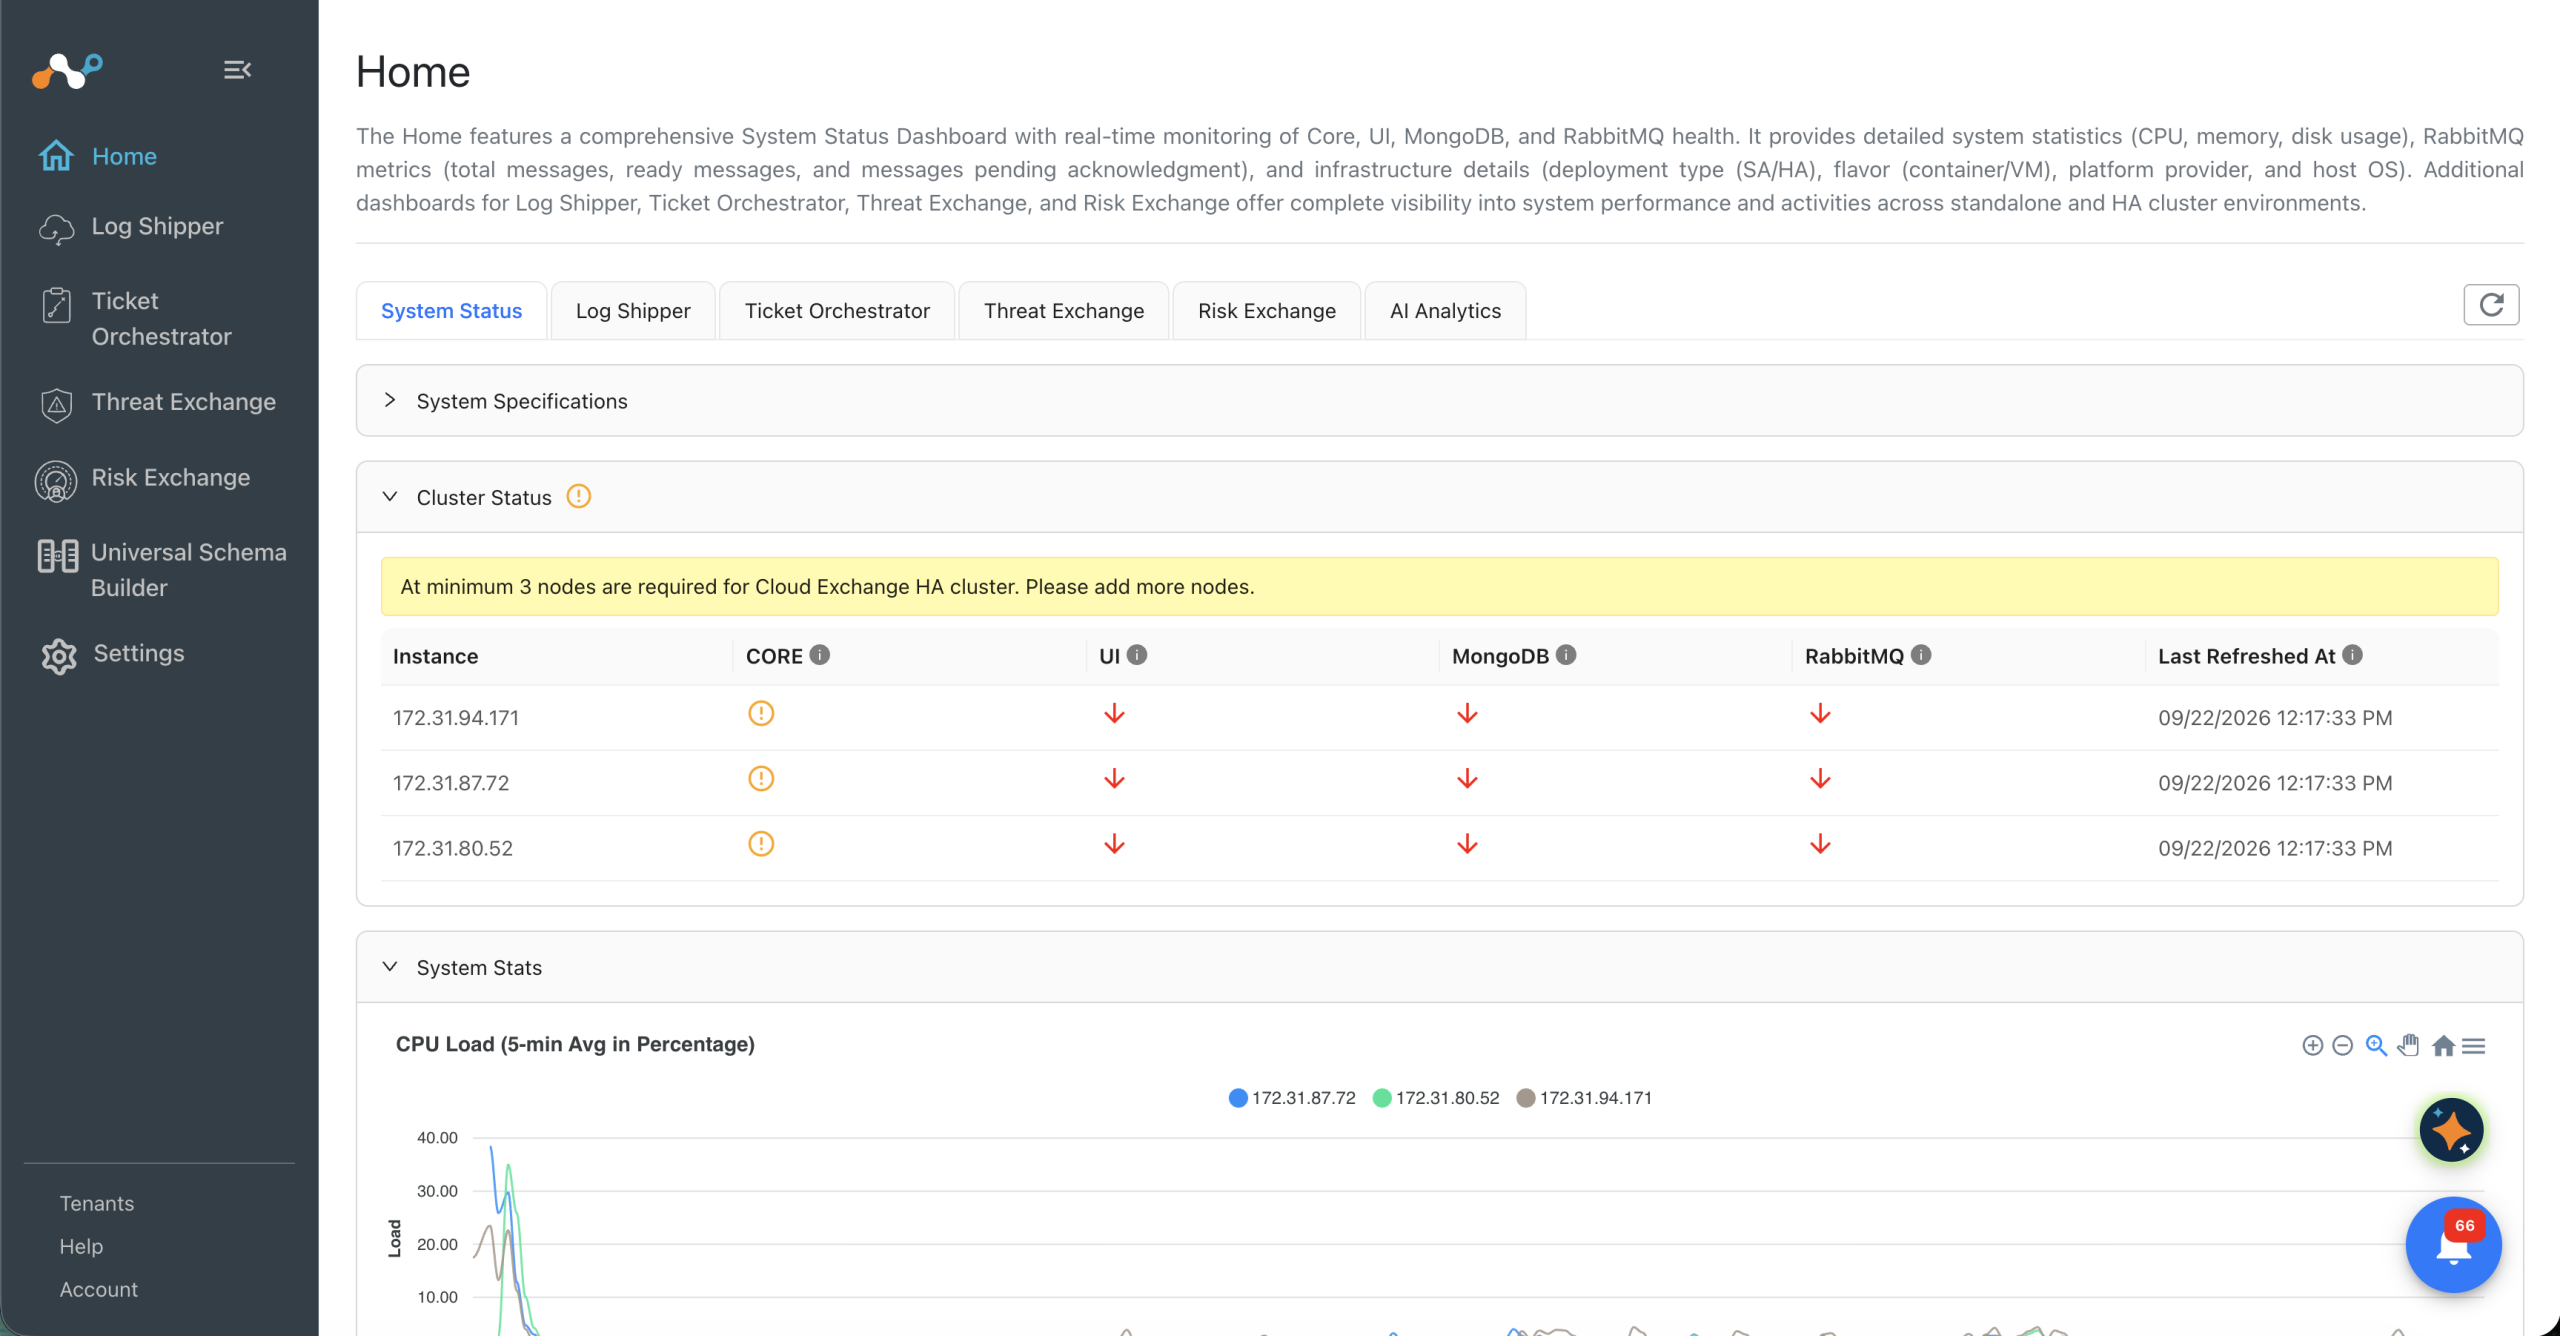
- On the secondary nodes, the Core container status for all nodes is shown as Unknown, while the UI, MongoDB, and RabbitMQ containers are shown as DOWN.
- When checked through the CLI, all containers on all nodes are actually UP and running.
Cluster status on the primary node:
Cluster status on the secondary node:
Root cause
Ubuntu 24 changes the behavior of needrestart. In earlier Ubuntu versions, unattended upgrades marked affected services as requiring a restart but deferred the actual restart to the user. In Ubuntu 24, needrestart applies the same restart behavior for unattended and attended package upgrades and can automatically restart affected services.
In Cloud Exchange HA deployments, automatic restarts of cloud-exchange.service or glusterd.service can disrupt HA service visibility and cause the UI to report inconsistent cluster status.
Reference: needrestart changes in Ubuntu 24.04: service restarts
Workaround
For CE v6.0.0, v6.0.1, v6.1.0, and v7.0.0-beta HA deployments, exclude glusterd and cloud-exchange services from the automatic restart list on all participating HA cluster nodes.
Note: These steps can be performed before or after configuring HA.
- Open the following configuration file:
vi /etc/needrestart/conf.d/99-cloudexchange.conf - Add the following content to the file and save it:
# Managed by Cloud Exchange setup. needrestart lists these services as
# needing a restart but does not restart them; restart them manually,
# one HA node at a time.
$nrconf{override_rc}{qr(^cloud\-exchange\.service$)} = 0;
$nrconf{override_rc}{qr(^glusterd\.service$)} = 0;
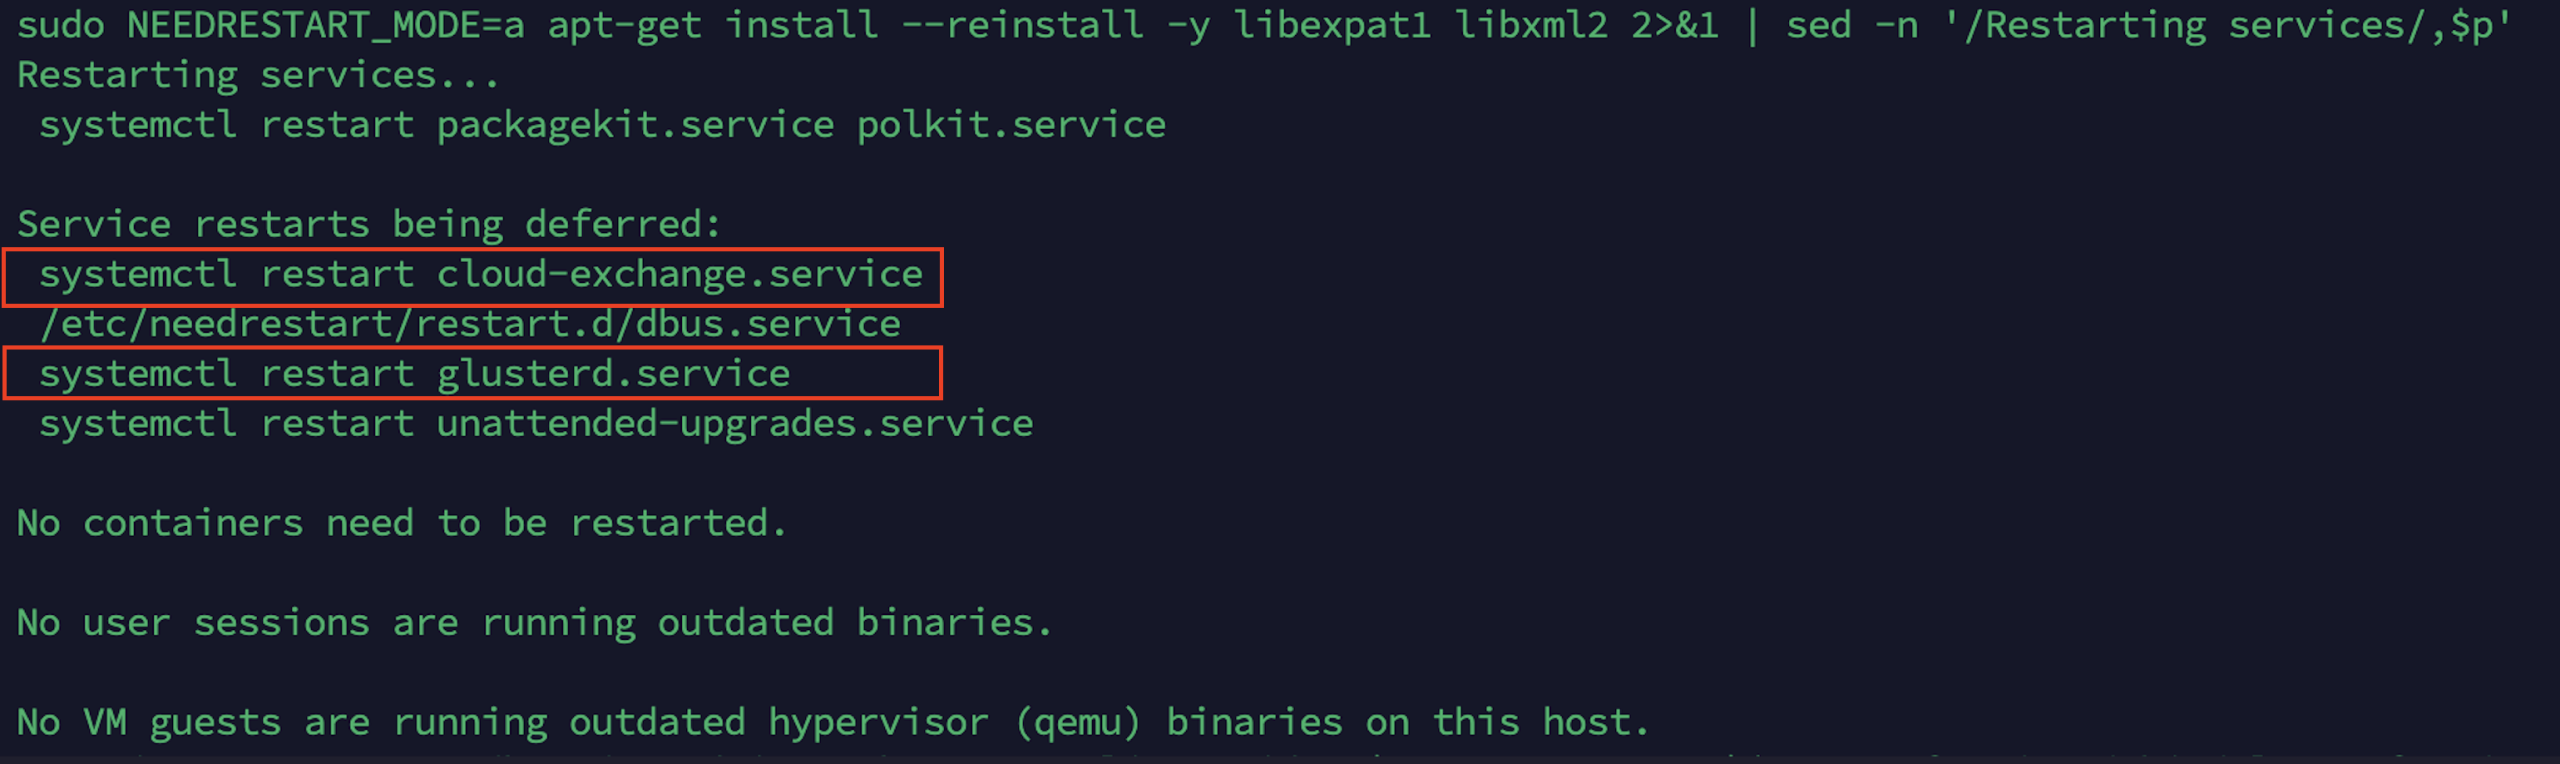
3. Verify that the excluded services are not restarted automatically:sudo NEEDRESTART_MODE=a apt-get install --reinstall -y libexpat1 libxml2 2>&1 | sed -n '/Restarting services/,$p'
The cloud-exchange.service and glusterd.service entries should appear in the deferred restart list, as shown in the following image:
Fix status
Cloud Exchange v7.0.0 GA is planned to address this issue. The release is currently planned for late October or early November.
Upgrades, Migrations, and Lifecycles
Core container keeps restarting after migrating to 5.1.0.
Scenario: After migrating to 5.1.0, the CE core container is getting restarted and following errors are observed in the core container logs.

Impact: CE is not accessible.
Resolution: Reach out to Netskope Support team with the diagnostic logs.
Get errors like InvalidReplicaSetConfig while running ./start script while deploying Cloud Exchange with High Availability
During the initialization of a MongoDB replica set, an error message may surface, indicating: “No host described in new configuration with {version: 1, term: 0} for replica set mongo_replic_set maps to this node.” This issue commonly arises when the MongoDB container encounters difficulty connecting via the specified IP address or hostname in the setup script. To effectively resolve this issue, it is crucial to ensure that the necessary ports are allowed through the firewall. Facilitating seamless MongoDB initialization hinges on granting access to these essential ports, thereby enabling smooth communication and operation within the replica set. These are the ports to allow.
- 4369 (A peer discovery service used by RabbitMQ nodes and CLI tools)
- 5672 (Used by AMQP 0-9-1 and AMQP 1.0 clients without and with TLS)
- 15672 (HTTP API clients, management UI and rabbitmqadmin, without and with TLS)
- 25672 (Used for inter-node and CLI tools communication)
- 35672 (Used for CLI tools communication)
- 27017 (The default port for mongod and mongos instances.)
- Selected UI port (Default 443 for HTTPS and 80 for HTTP) (To access the UI and internode healthcheck)
Use these steps to allow port numbers:
- Check the Status of Ports:
For Ubuntu:
$ sudo ufw status PORT_NUMBER
For Redhat:
$ sudo firewall-cmd --list-ports=PORT_NUMBER/tcp
- If the port is not allowed then perform the following:
For Ubuntu:
$ sudo ufw allow PORT_NUMBER
For Redhat:
$ sudo firewall-cmd --zone=public --add-port=PORT_NUMBER/tcp --permanent
- Reload the firewall:
For Ubuntu:
$ sudo ufw reload
For Redhat:
$ sudo firewall-cmd --reload

MongoDB migration failed during upgrade
This error occurs during upgrading Cloud Exchange from 3.x/4.x to the latest version:
ta_cloud_exchange_mongodb-primary_1 |

{"t":{"$date":"2025-01-15T10:17:50.744+00:00"},"s":"F", "c":"CONTROL",

"id":20573, "ctx":"initandlisten","msg":"Wrong mongod version","attr":{"error":"UPGRADE PROBLEM: Found an invalid featureCompatibilityVersion document (ERROR: Location4926900: Invalid featureCompatibilityVersion document in admin.system.version: { _id:

"featureCompatibilityVersion", version: "4.4" }.
Primary Observed Issue: Migration/Upgrade failed.
Follow these steps to analyze the issue you are facing
- First you to check the docker and docker compose version. Use below commands to check the version
- docker version
- docker compose version/docker-compose version.
- If the docker version is lower than 25, you need to upgrade the version.
- Follow the instructions in this document. https://docs.docker.com/engine/install/ubuntu/.
- For docker-compose, use this document. https://docs.docker.com/compose/install/standalone/.
Steps to Troubleshoot a Failed Setup Script Due to MongoDB Compatibility Migration
The maintenance password entered is not correct
The user encounters the error message mentioned below while executing the setup script during the migration or upgrade process. Error occurred while executing this command. Error: Command ‘docker exec mongo-migration mongo -u root –password <pass> admin –eval ‘db.adminCommand({setFeatureCompatibilityVersion: “5.0”})” returned non-zero exit status 1. To verify the error resulting from an incorrect maintenance password, the user must run the specified command using either podman or docker:
$ sudo docker ps
$ sudo podman ps
If you can observe a running container named “mongo-migration,” it indicates that an incorrect maintenance password was added during the migration process.

If this is the situation, you should execute the setup script again based on the deployment type. Additionally, you need to enter the same maintenance password that was used during the old setup of Cloud Exchange. For Containerized CE or CE as HA, the command to rerun the setup script is:
$ sudo python3 ./setup
For CE as VM Instance, the command to rerun the setup script is:
$ sudo ./setup.
If the user is unable to locate the running container, they may need to refer to the troubleshooting steps provided below.
Incompatible Mongo Feature Compatibility Version
You encounter the error message mentioned below while executing the setup script during the migration or upgrade process. Error response from daemon: Container <Container_ID> is not runningError occurred while executing command. Error: Command ‘docker/podman exec mongo-migration mongo -u root –password <pass> admin –eval ‘db.adminCommand({setFeatureCompatibilityVersion: “5.0”})” returned non-zero exit status 1. To prevent this error from occurring, please follow the instructions below.
For those who are utilizing a Containerized CE, follow these steps:
1. Run this command:
$ echo MONGO_COMPATIBILITY=True >> .env
2. To verify the changes, use this command for Containerized CE instance:
$ cat .env
3. Run the setup script again. If you are using the below command:
$ sudo ./setup
If you are using CE as HA (Containerized) based instance, follow these steps:
1. Run this command:
$ echo MONGO_COMPATIBILITY=True >> <shared_drive>/config/.env
2. To verify the changes, use the following command for CE as an HA-based instance:
$ sudo cat <shared_drive>/config/.env
3. Run the setup script again on the current node. This time, the error should not appear.
$ sudo ./setup
If you are using CE as OVA instance, follow these steps:
1. Run this command:
$ sudo vi /opt/cloudexchange/cloudexchange/.env
If you have opted HA in CE as VM-based instances, proceed by executing this command:
$ sudo vi <shared_drive>/config/.env
2. Insert the following line into the .env file and remember to save the changes.
MONGO_COMPATIBILITY=True
3. Re-run the setup script by using the command below:
$ sudo ./setup
Error while migrating to CE v5.1.1 HA from CE v5.x.x HA in execution of ./restore_ha_backup script. Why?

Scenario: When a customer attempts to migrate to v5.1.1 HA from an older HA version, they must run the restore_ha_backup script. However, in certain shell versions, particularly on Ubuntu 22.04/ CE as a VM Images, this script encounters an error while exporting environment variables.
Resolution: To prevent this error from occurring, please follow the instructions below instead of running ./restore_ha_backup script.
- Execute the following command to export necessary environment variables:
$ export MONGO_INITDB_ROOT_PASSWORD=<Enter_maintenance_password>
$ export HA_PRIMARY_NODE_IP=<Enter_current_node_ip> - Use the following command to start MongoDB Container:
- Run below command for docker based system like Ubuntu:
$ sudo docker compose -f docker-compose-ha.yml up mongodb-primary -d - Run below command for podman based system like RHEL:
$ sudo podman-compose -f podman-compose-ha.yml up mongodb-primary -d
- Run below command for docker based system like Ubuntu:
- Run this command to assign new primary IP to the cluster after migration using the below command:
- Run below command for docker based system like Ubuntu:
$ sudo docker compose -f docker-compose-ha.yml exec mongodb-primary bash -c "mongosh -u root -p $MONGO_INITDB_ROOT_PASSWORD --eval 'cfg = rs.conf();cfg.members[0].host = "$HA_PRIMARY_NODE_IP:27017";rs.reconfig(cfg, { force: true })'" - Run below command for podman based system like RHEL:
$ sudo podman-compose -f podman-compose-ha.yml exec mongodb-primary bash -c "mongosh -u root -p $MONGO_INITDB_ROOT_PASSWORD --eval 'cfg = rs.conf();cfg.members[0].host = "$HA_PRIMARY_NODE_IP:27017";rs.reconfig(cfg, { force: true })'"
- Run below command for docker based system like Ubuntu:
- Run the below command to stop MongoDB container:
- Run below command for docker based system like Ubuntu:
$ sudo docker compose -f docker-compose-ha.yml down -v - Run below command for podman based system like RHEL:
$ sudo podman-compose -f podman-compose-ha.yml down -v
- Run below command for docker based system like Ubuntu:


Issue in starting Cloud Exchange after OS upgrade in machines/servers from RHEL 8 to RHEL 9
Issue Summary: Cloud Exchange is not getting started after the RHEL OS upgrade on your server.
Common Symptoms: you might be receiving error in relation to podman or podman-compose being not present in your system while you are trying to execute the start script to initiate the Cloud Exchange containers
Root Cause:
Potentially, it seems that due to OS upgrade in the server, these files and packages were removed from your machines. Hence, we would recommend you to please check with your IT or VM team for the exact cause.
Troubleshooting Steps/Resolution:
Podman, Podman-compose, and Podman-plugins are prerequisites for Cloud Exchange and hence, you would have to install them back again in your machine.
So, please follow the below steps:
- Podman installation command:
sudo yum install podman - Podman-compose installation commands:
sudo pip3 install podman-compose - Creating soft link for podman-compose:
sudo ln -s /usr/local/bin/podman-compose /usr/bin/podman-compose - Podman-plugins Installation command:
sudo yum install podman-plugins
Once these dependencies are installed, please execute the following command to recreate podman system details: sudo podman system reset
After these steps are followed, please restart the Cloud Exchange using the following commands:
sudo ./stopsudo ./start
Now, you should be able to start your Cloud Exchange in your machine without losing any previous configurations.
Cloud Exchange Platform Administration and API Workflow
Validation error occurred, Received exit code 403, Forbidden, Verify the V1, V2 API Token provided in the configuration parameters.
When configuring the Netskope Log Shipper plugin in Cloud Exchange, users may encounter a validation error:TENANT Netskope Tenant (Required) []: Validation error occurred, Received exit code 403, Forbidden, Verify the V1, V2 API Token provided in the configuration parameters.

Typical Symptoms
- Issue occurs even when permissions appear correct.
- Error banner while saving plugin configuration.
- Message references invalid/insufficient V1 or V2 API token.
Root Cause
- From Cloud Exchange v5.1.1 with CLS Plugin v2.2.0+, a new Client Status event type was introduced.
- This event type uses the endpoint:
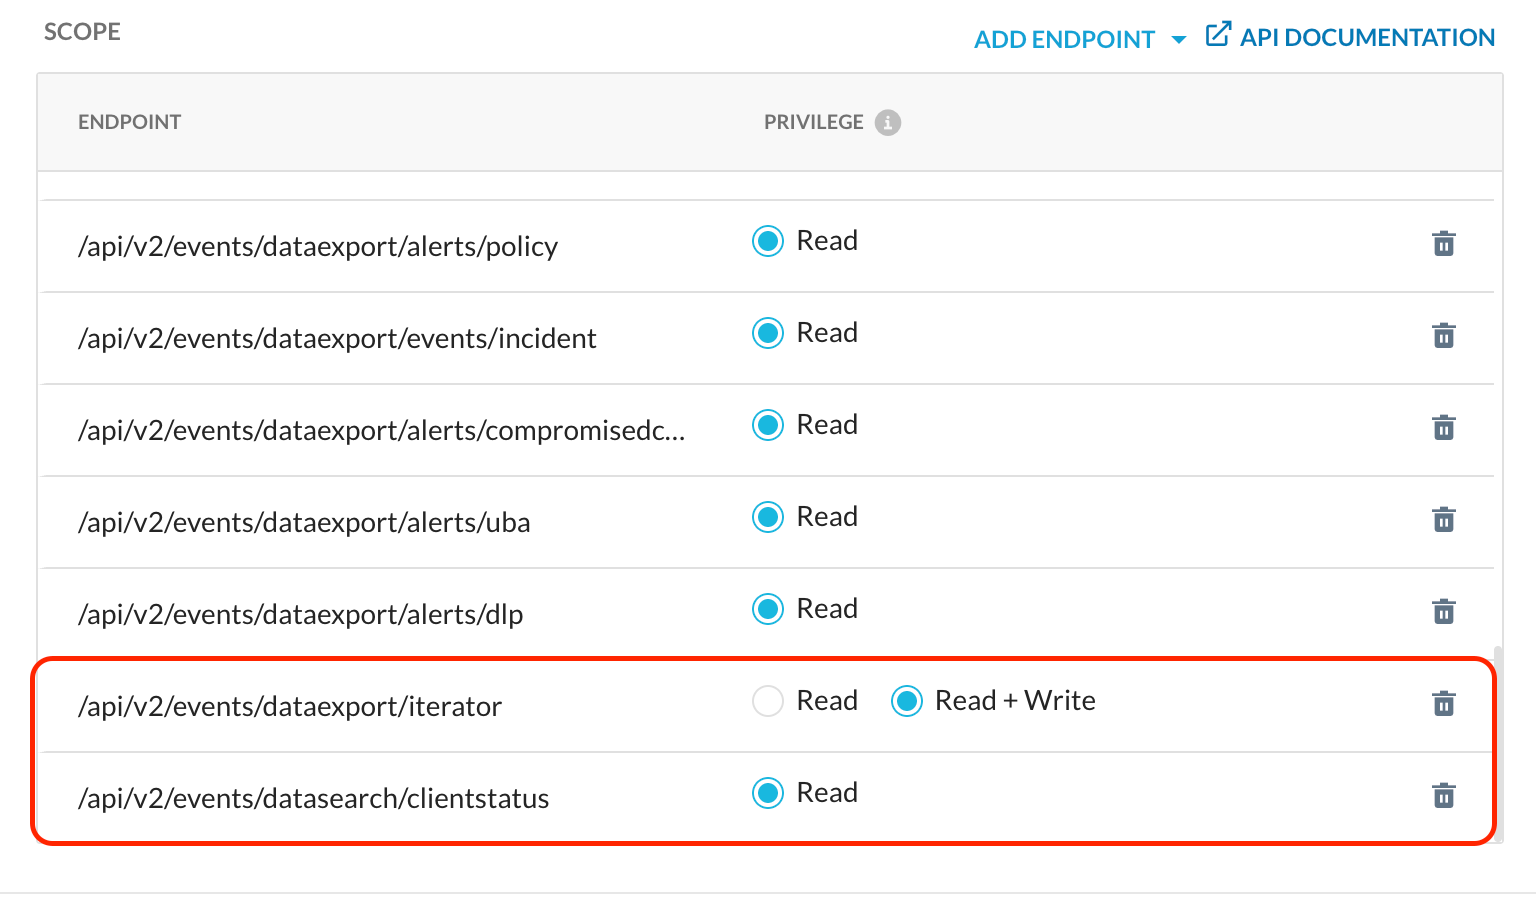
/api/v2/events/dataexport/iterator
/api/v2/events/datasearch/clientstatus - This V2 API Token must have READ + WRITE permissions for this endpoint.
Steps to Troubleshoot
- Check plugin version; it must be CLS v2.2.0 or above.
- Verify token permissions:
- Ensure all
/api/v2/events/dataexport/* as well as/api/v2/events/datasearch/clientstatusendpoints are included. - Confirm /api/v2/events/dataexport/iterator has READ + WRITE.
- Ensure all
- Update or recreate the V2 API token with correct permissions.
Save updated token in CLS plugin configuration.
Resolution
- Add required dataexport permissions (READ + WRITE for iterator).
- Retry saving the CLS configuration.
- If Client Status is not needed, temporarily deselect this event type to bypass until the token is updated.
An error occurred while configuring the tenant in Cloud Exchange
You see this error:
- Error: Value error, please check the Tenant Name field has no special characters, ensure V1 and V2 tokens are valid.
Troubleshooting Steps
- First, make sure that REST API Status is enabled for REST API v2 in the Netskope tenant.

- Confirm that you have created the REST API v2 Token with the necessary Netskope Endpoint Permissions/Scopes as documented here.
- Check your existing REST API v2 Token, and if required, modify the Netskope Endpoint Permissions/Scopes as per the above documentation. Try again to save the Netskope Tenant in the Cloud Exchange UI.
- If the issue continue to persists, execute the following curl request in the host machine wherein Cloud Exchange is deployed:
Note
Before executing the above command, make sure to replace the <tenant-name> with Netskope Tenant Name and <V2 token> with the existing REST API v2 token.
curl --location https://<tenant-name>.goskope.com/api/v2/events/dataexport/events/page?index=tenant --header 'Netskope-Api-Token: <V2 token>'
Command Output
If you observed the output of the command as Unauthorized for the IP address x.x.x.x, then add the highlighted IP address in the Custom IP Addresses section (enable it, if disabled) under IP Allowlist in your Netskope tenant.
Path for IP Allowlist
Log in to the Netskope tenant and go to Settings > Administration > IP Allowlist > Custom IP Addresses.
REST API V2 token expired
If you observed this banner in Cloud Exchange UI, this indicates that REST API V2 token is expired.

Follow these steps to resolve this error
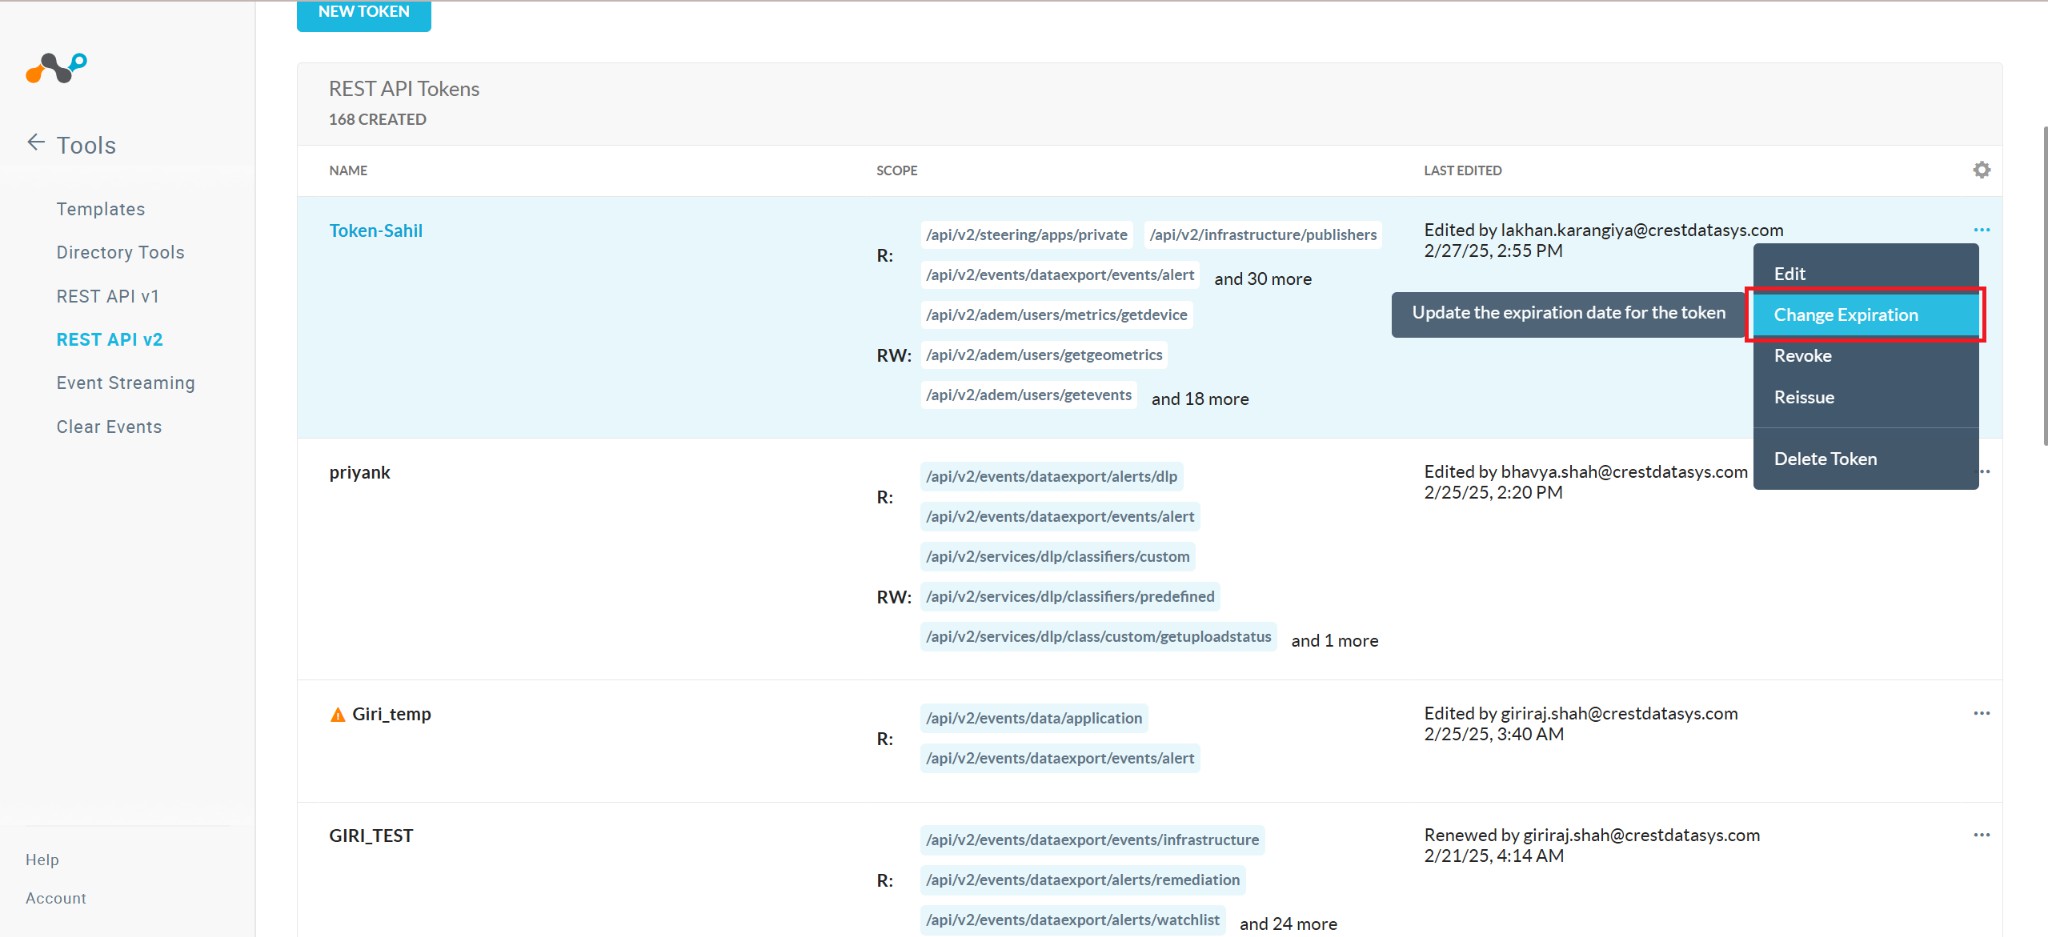
- In your Netskope tenant, go to Settings > Tools > REST API V2 and select an API Token. Click on the three dots dropdown and select Change Expiration Date.
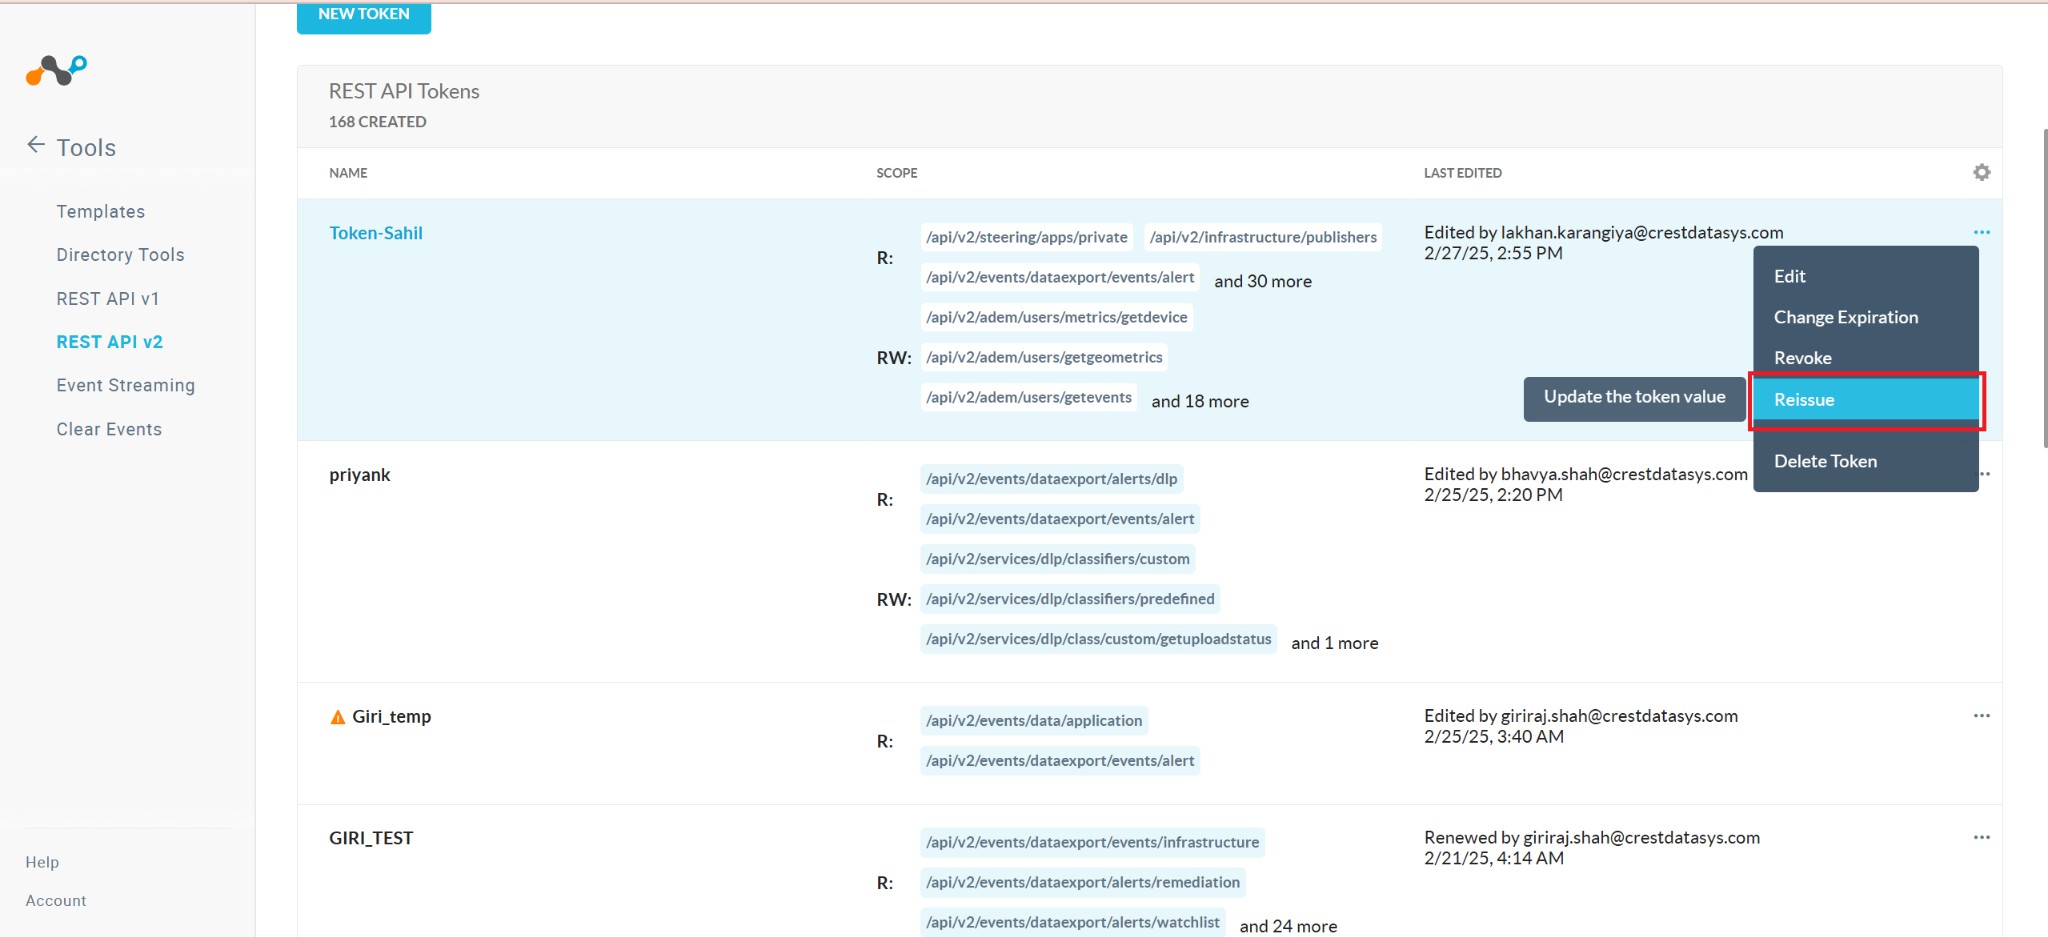
- Now you need to re-issue the token. For your API Token, click on the three dots dropdown and select Reissue.
- Copy the new token and use that in your Cloud Exchange Netskope Tenant configuration.
Receiving an error during SSO setup when entering hostname (without a Top Level Domain). Why?
SSO requires a top level domain (TLD). Not adding a TLD in the hostname while mapping the URL and upon enabling SSO in CE, a customer will receive the error “Invalid Hostname, Top Level Domain required”. This is resolved by adding proper TLD (like netskope.com).
Unsupported TLS Protocol Version Error” appears. Why?
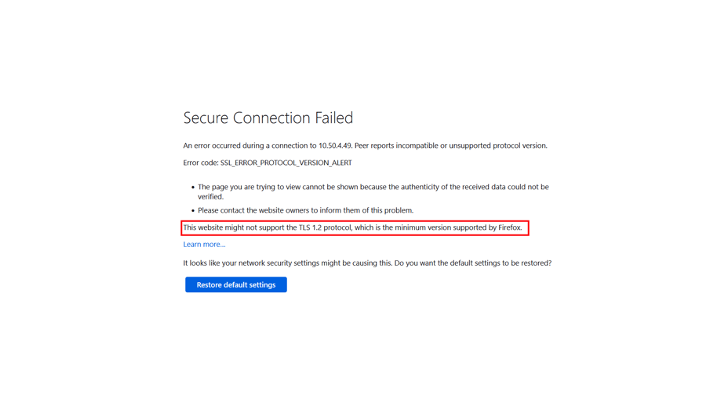
If you receive this kind of error then it’s because Netskope CE by default supports TLSv1.3 only. To resolve this error, you should allow Netskope CE to run on TLSv1.2 along with TLSv1.3 and for that you have to change the TLS version from the setup script. Re-run the setup script again and enter ‘Yes’ to the following question.
Do you want to enable TLSv1.2 along with TLSv1.3 for CE UI.
Then execute the start script.
Cloud Exchange certificates are expired. How do I fix this?
If your certificates are expired then follow below steps to regenerate the certificates.
- Down all the containers.
- Remove the certificate files (cte_cert.crt, cte_cert_key.key) from data/ssl_certs folder.
- Re-run the setup script to regenerate the certs. Enter “https” to the below question:
Do you want to access CE over HTTP, or HTTPS (HTTPS is recommended)? https
- Execute the start script.
How do I reset the user password if the current password is forgotten?
To reset the administrator password, refer to Reset Password in the Account Settings section. Make sure to change the password from Account Settings after the CE administrator has reset the password.
To reset any other user’s password, the Super Admin can update a user password from Settings > Users, and then click the Edit icon on the right.
I changed or migrated the Cloud Exchange IP address or domain, and the CE SSO configuration is not showing this modification. What should I do?
To change the SSO configuration, you need to disable SSO using the toggle on the SSO Configuration tab in the CE UI. To do so, follow the following steps:
- First, save your details related to SSO configuration from Okta in a file (Identity Provider Issuer URL, Identity Provider SSO URL, Identity Provider SLO URL, and Public x509 Certificate).
- Next disable the SSO using the toggle which can be seen on the SSO Configuration page in the CE UI.
- After disabling SSO, the change in the domain should be reflected in the Service Provider Entity ID, Service Provider ACS URL, and Service Provider SLS URL as per your modified domain.
- When you see this in the CE UI, re-enable SSO using the toggle.
- Re-enter the details saved in the first step from the file.
Note that you would also have to update your IdP (like) Okta details pertaining to the Service Provider Entity ID, Service Provider ACS URL, and Service Provider SLS URL so that it also reflects the change with respect to your modified domain.
Renewal of Self-Signed Certificates in Cloud Exchange
Issue Overview
SSL certificate expiration banner has been visible on Cloud Exchange Web UI after completing an upgrade.

Steps to Troubleshoot
- Go to the CLI of the Cloud Exchange host machine.
- Go to the Cloud Exchange directory.
- Stop the Cloud Exchange services:
sudo ./stop
- Now remove the existing SSL certificate:
rm -rf data/ssl_certs/cte_cert.crt
rm -rf data/ssl_certs/cte_cert_key.key
- After finishing this, re-run the setup script:
sudo python3 ./setup
- Note, if you have deployed Cloud Exchange as a VM, run:
sudo ./setup
- Now run the start script:
sudo ./start
These steps will have generated the latest SSL certificate.
Regenerate and apply new JWT Token
Issue Overview
During HA configuration, all nodes must use the same JWT secret as the primary node. If the JWT secret generated or configured during the primary node setup is not available, generate a new JWT secret and configure it on all nodes in the cluster.
Steps to Regenerate JWT TOKEN
- Navigate to the CE installation directory (primary node). Follow the appropriate steps based on your deployment type:
- Containerized CE deployment
cd <ta_cloud_exchange_directory_path> - CE deployed as a VM
cd /opt/cloudexchange/cloudexchange
- Containerized CE deployment
- Stop the containers.
sudo ./stop - To set a specific JWT secret, modify the cloudexchange.config file and provide the value for JWT_SECRET.
sudo cp cloudexchange.config.example cloudexchange.configsudo vi cloudexchange.config
Record and securely store the JWT SECRET, as it will be required for the Cloud Exchange HA configuration.
- Run the setup script.
sudo ./setup - Restart the containers.
sudo ./start
Plugin Management and Module Configuration
A Business Rule, SIEM Mapping, or Queue configuration displays a red alert icon (as shown below) for the Log Shipper or Ticket Orchestrator module, and errors appear in the logging tab during transformation, filtering, business rule synchronization, or ticket creation, what could be the cause?
Scenario: CE automatically detects the data type (string, number, or boolean) of incoming fields and adjusts operators based on new data type across all CE filter views accordingly upon data retrieval. If a field’s data type changes, any configured business, mute, or dedup rules using that field will show a red error icon. You need to reconfigure these rules through the edit option.
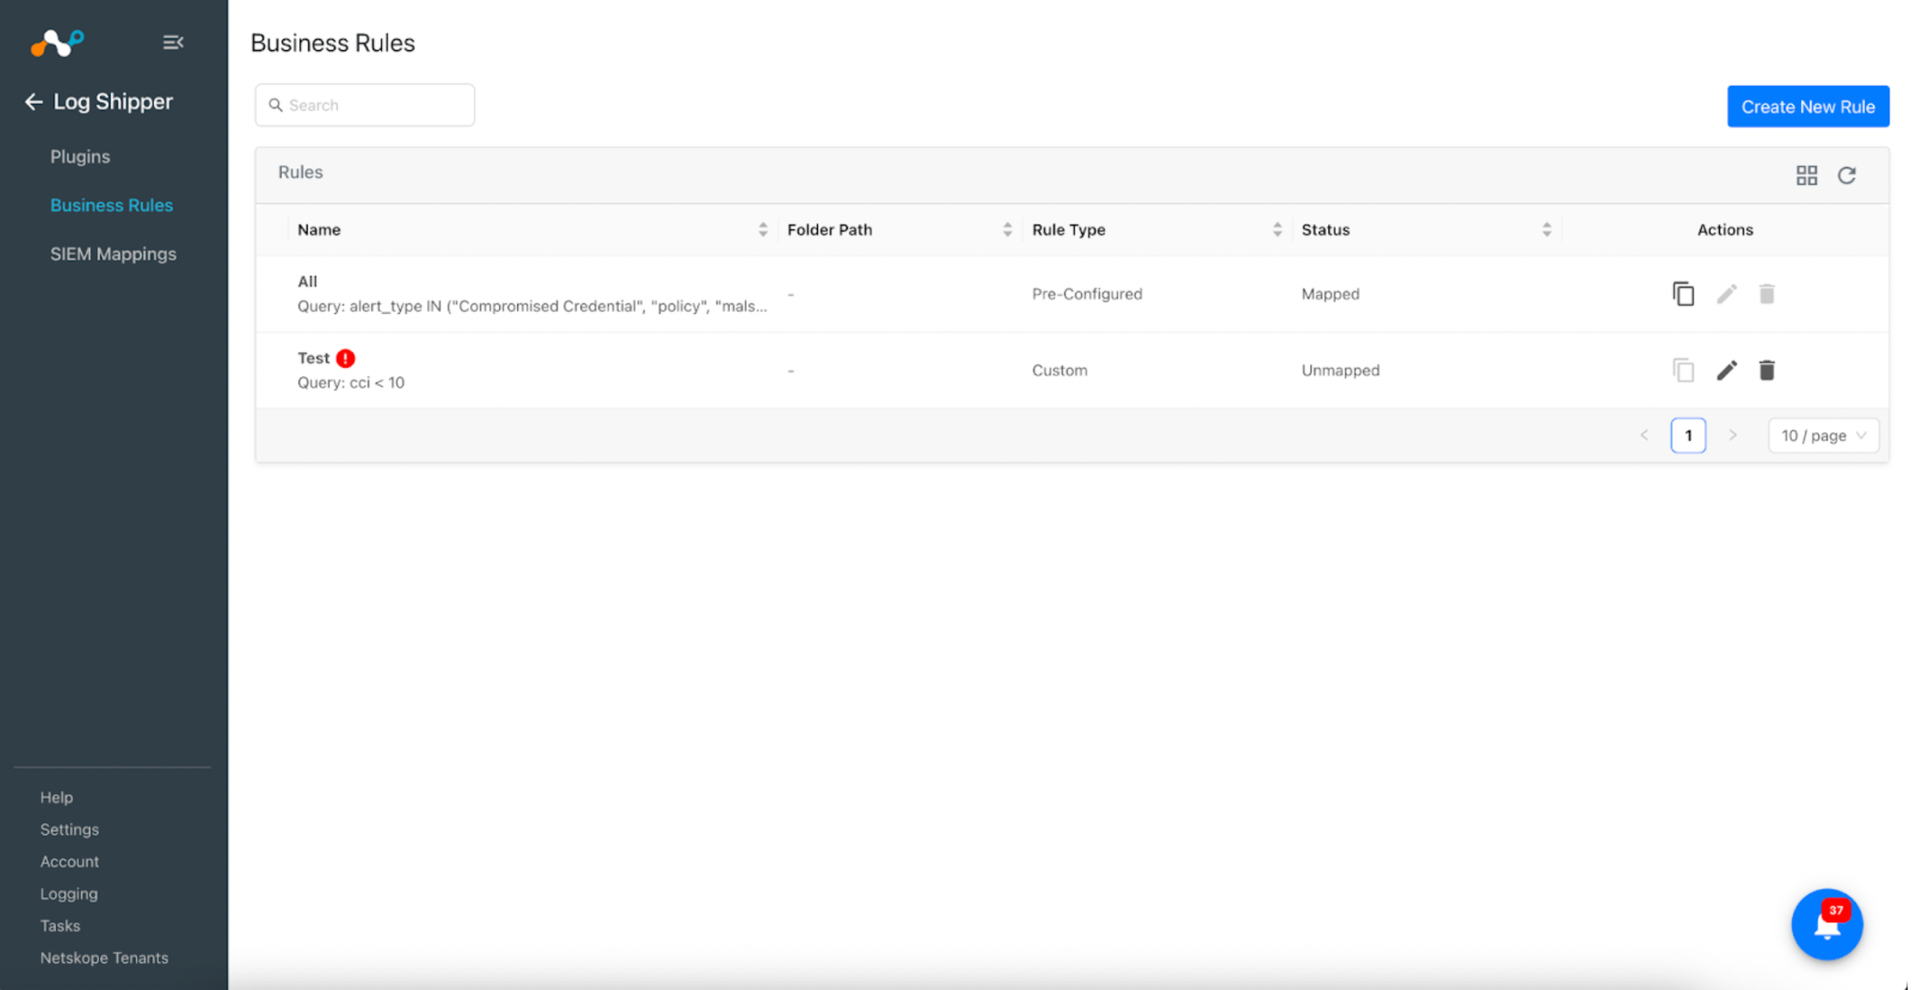
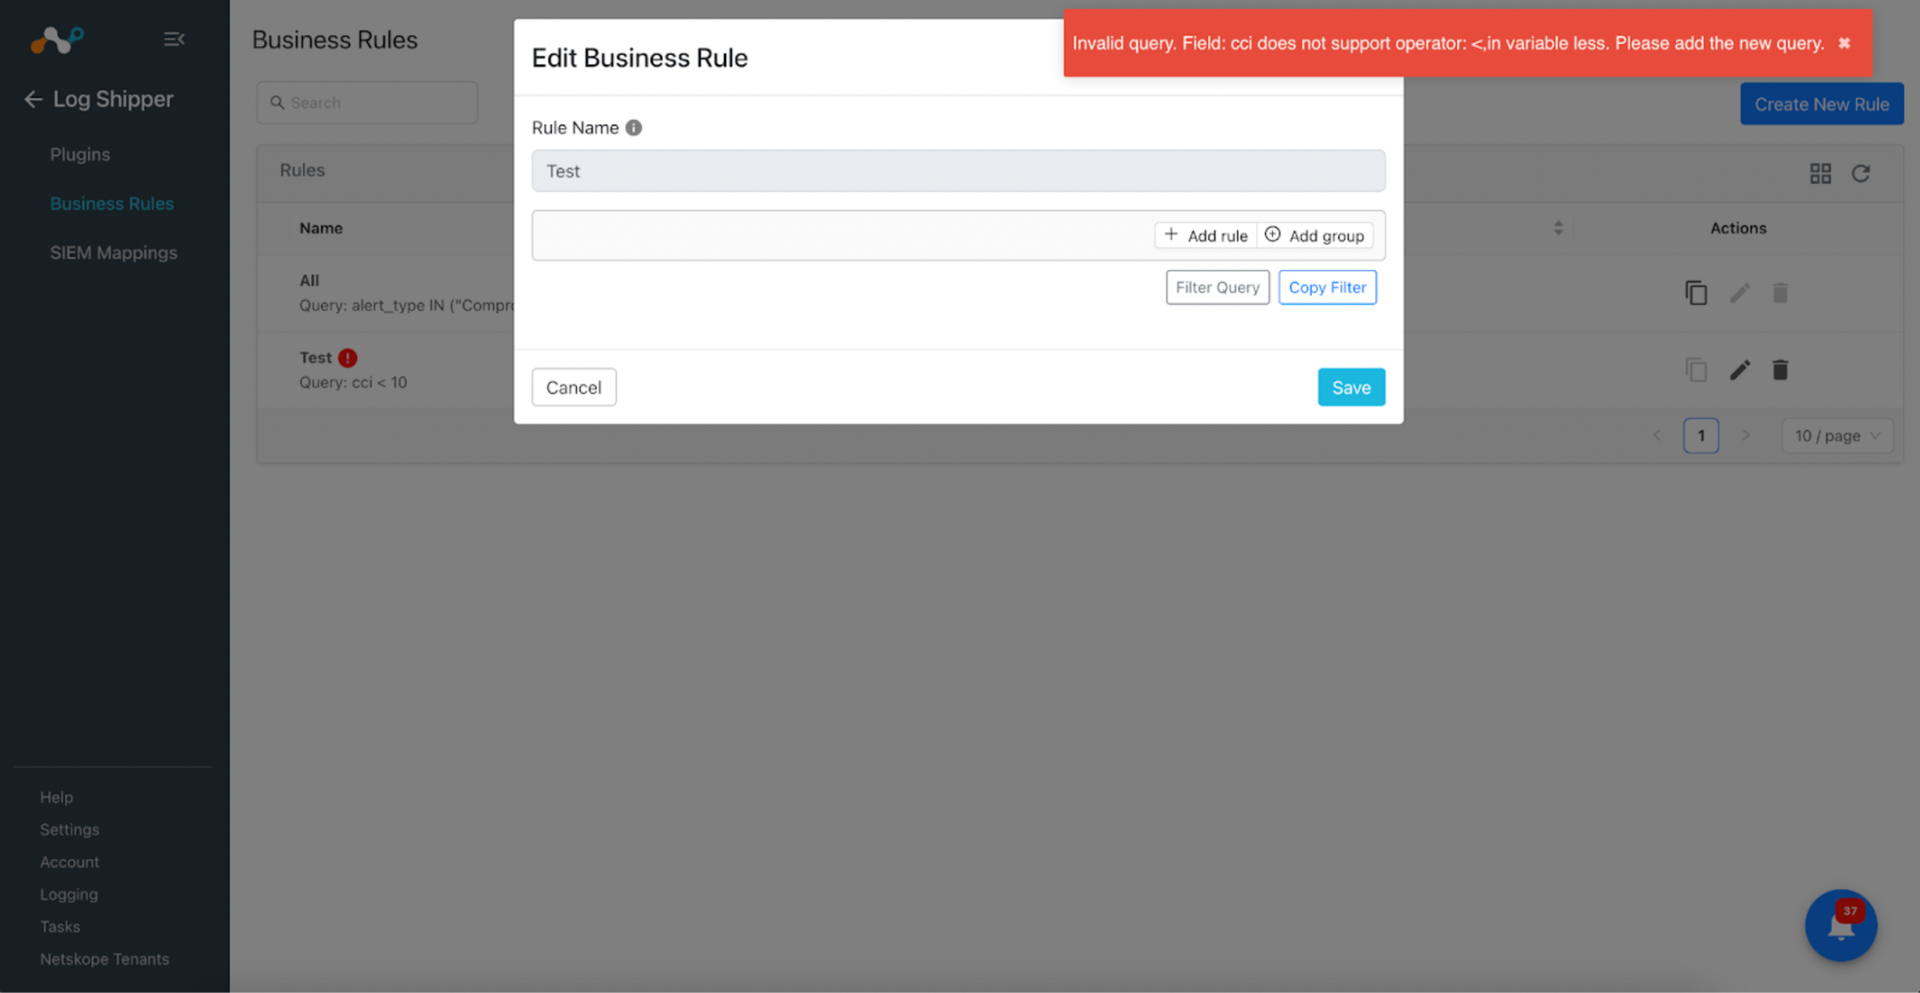
Impact: Module specific lifecycle tasks, like filtering, transformation, ticket creation, dedup, and mute rules evaluation will be stopped for incoming alerts/events/logs, and incoming data processes to third-party will be skipped. Invalid rules will prevent CE from processing incoming alert or event batches and will trigger an error message in the Logging tab.
Resolution: You need to reconfigure these rules through the edit option.
- Go to the respective Business Rule page.
- Click Edit.
- Modify the filter as needed to address the issue.
- Click Save to apply the changes.
Duplicate Historical tasks on SIEM deletion and re-configuration resulting in 409 Errors
Scenario: If you configure SIEM and delete that particular SIEM, and on reconfiguring it back while historical pulling is in progress for initial range mentioned in plugin configuration, CE is creating multiple tasks (One is on the creation of SIEM mapping time, and another one is on reconfiguration of SIEM Mapping).

To resolve this, restart CE using the stop and start scripts and perform a manual sync in Log shipper > SIEM Mappings manual sync with historical range.
CTE Netskope Threat Exchange ** : Exception occurred while pushing data to Netskope
Scenario: While sharing the Threat IoCs to Netskope, you might see this error.

Impact: IoCs will be shared to Netskope but the functionality of tagging the indicators will be affected. This might also impact the IoC retraction functionality.
Resolution:
- Go to Settings > Repository and click Check for Updates to fetch the updates for the Default repository.
- Click Update Plugins, select the Netskope Threat Exchange plugin, and click then Save and follow the prompts.
- Wait for the next execution for sharing, and then check if the error is no longer visible in the audit logs.
Repository updates: Error occurred while fetching updates for Default plugin repository
Scenario: While fetching the updates from Default plugin Repository after migration from the old CE, this error occurs.


Impact: Not will be able to fetch plugin updates from Github for Default repository.
Resolution:
- SSH into CE instance and go to the Cloud Exchange installation package directory.
- Remove all untracked files using this command: (Use podman-compose instead of docker-compose in RHEL-based OS).
$ docker-compose exec -w /opt/netskope/repos/Default core git clean -df
Note that if you receive any error while running above commands, try this command to remove untracked files.
$ cd data/repos/Default (cd <shared_drive>/repos/Default for HA deployment)
$ sudo rm -rf crowdstrike_identity_protect_ztre/ crowdstrike_ztre/ microsoft_entra_id_ztre/ mimecast_ztre/ netskope_ztre/ okta_ztre/
Although sharing is configured, the IoCs reported are not being shared with the threat source.
To address this issue, it is crucial to verify that the Business Rule and SIEM mapping used are correct. Additionally, ensure that all parameters are accurately filled out during the plugin configuration process. It is also important to review the sharing configuration to confirm it matches the IoCs you expect to share. If the sharing filter is incorrect, adjust the sharing criteria accordingly.
To retrieve any historical data that might have been missed due to a misconfiguration, consider removing and then re-adding the sharing configuration. By taking these steps, you can ensure that the IoCs are properly shared with the intended threat source.
Netskope is rejecting some of the URLs Threat Exchange is pushing to it. Why?
Netskope only accepts URLs with wildcard characters that are in front of the domain, others will be rejected when Threat Exchange tries to send it. So *.google.com will be accepted by the Netskope tenant,but google.com/* will not. If your Threat Exchange database contains wildcards, you will need to manually tag to share.
Where are all the uploaded plugins stored?
By default, all your uploaded plugins are stored inside the ./data/custom_plugins directory. However, this can be changed from the docker-compose by mounting a different directory or the Admin can add an additional repository to download custom plugins from. This is configured within the Settings menu. This is the best method of adding additional plugins to your CE instance, and the only method for adding additional CTO, CLS, and CRE plugins.
Invalid query. Field alertType does not support operator: Is equal in variable equal
Scenario: After migrating to 5.1.0 User might see the below error while updating the existing Business Rule for CTO module.

Impact: You will not be able to update the existing rule until the you redefine the rule.
Resolution: Redefine the business rule from the UI and update it.
The IoCs search performance is slow. It takes more than 5 seconds to load results.
The platform by default searches for the last 7 days of IoCs. If there are too many IoCs (more than 1 million) and no filter selected, the search performance will be slow.
Proposed solution: Consider applying the filters and narrowing the search criteria. Performance is best when the data set is ~100K records or less.
While configuring a new plugin, even after providing accurate credentials, the configuration is not saved and an error message is displayed.
Verify if the outgoing API calls require a proxy. If your network deployment expects a proxy for HTTP API calls and a proxy is configured, the plugin operations would be impacted.
Proposed Solution:
- Go to Settings > General > Proxy.
- Edit the existing configuration and enable Use System Proxy.

Although the Poll interval for a plugin is configured to poll every 5 minutes, the Last Run shows an interval which is more than 5 minutes ago.
CE relies on an internal scheduling mechanism for the plugin’s task. There are workers which execute the plugin tasks, by picking up a task from the queue one by one. The number of workers available in your system depends on the number of cores. If the available workers are busy serving plugin task, the already queued up task has to wait till the existing worker is available. This situation may usually occur during initial data ingestion, where there’s more data to be processed.
Proposed Solution: Consider increasing the cores of the system if you have a large number of configured plugins, and the configured plugins are consistently lagging behind. For initial ingestion, the system should pick up the backlog post initial ingestion and behave normally if the incremental data is not large.
A plugin configuration shows a red alert icon as shown below. What happened?

If there is a red alert icon on one of the configurations, it indicates that there was one or more problems while polling the plugged-in system for data per that configuration. This could be related to API, proxy, or SSL settings.
Proposed Solution:
- Make sure the Plugin Configuration has correct parameters for API, Secret key, URL, etc.
- Make sure Enable Proxy is selected and your proxy is configured if outbound network calls require a proxy connection.
- Check logs for errors occurring around the last run time displayed on the configuration from the Audit section.
Mac OS users cannot select tar.gz while uploading a custom Threat Exchange plugin via the Add Plugin widget.

When a user tries to upload a plugin with a tar.gz package using the browse button, tar.gz files are not selectable by default.
Proposed Solution: Drag and drop plugin packages to the drop area of the UI.

How do I update the last run time of a plugin configuration? This is to replay the indicators in case they were missed.
Open the plugin configuration and set the Last Run value to an older date-time and save the configuration. Make sure that the configuration is currently not running when you update the Last Run value.
If Netskope CE has stopped sending logs to SIEM or sharing indicators, and a WorkerLost error appears in the core container logs in an extra small stack, you need to restart Cloud Exchange.
- For a Docker-based deployment:
- Retrieve the core container logs using this command:
$ docker-compose logs core | grep WorkerLost
If the logs containingWorkerLostappear around 5-6 times, this indicates there’s an issue. Restart the containers using these commands:$ ./stop$ ./start
- Retrieve the core container logs using this command:
- For a Podman-based deployment:
- To access the core container logs, use this command:
$ podman-compose logs core | grep WorkerLost. If the logs containingWorkerLostappear around 5-6 times, this indicates there’s an issue. Restart the containers using these commands:$ ./stop$ /start
- To access the core container logs, use this command:
Process ‘ForkPoolWorker-**’ pid:552 exited with ‘signal 9 (SIGKILL)’
Scenario: In core logs, you might observe “Process ‘ForkPoolWorker-**’ pid:552 exited with ‘signal 9 (SIGKILL)’”

Impact: Often the core container might get restarted and you may experience delay in tasks performed by CE (like logs ingestion getting delayed).
Resolution:
- Make sure the CE is hosted on a machine having at least 2.2 GHz CPU frequency.
- If you’re not meeting the CPU frequency criteria please migrate to the machine which meets the criteria.
- If you’re already meeting the CPU frequency criteria, reach out to the support team.
Warning messages for networksessionID field while sending logs from the CLS Syslog/Qradar plugin
Cloud Exchange (CE) populates warning log messages for the “networksessionID” field in the Logging section while sending Network Events logs from the CLS Syslog/Qradar plugin.
Example Warning Log Message in Cloud Exchange UI (under Logging Section):
CLS QRadar [QRadar]([events][network]): An error occurred while generating CEF data for field: “networkSessionId”. Error: networkSessionId: Error occurred while converting to integer. Field will be ignored

Root Cause
In Network events, Cloud Exchange is expecting networkSessionId field to be one of the following:
- Not present
- Present with a valid number enclosed in double quotes (i.e. a JSON string)
- Present with a valid number (i.e. a JSON number)
This warning message indicates that the field “networkSessionId” is not available/present in unexpected manner in raw logs from your Netskope Tenant and because this field is added in the default mapping file of the respective plugin due to this, Cloud Exchange skips this field from ingestion with the above-mentioned warning.
Troubleshooting Steps/Resolution
In such a case, you can create a custom mapping and remove this field from the Mapping file to suppress this warning. This will not cause any impact on Cloud Exchange workflow.
This field is available under Network Events in the Default Mapping file. Hence, you can follow below steps to create a custom mapping to remove “networkSessionId” field and utilize it in the respective plugin:
- Log into Cloud Exchange UI. Select Settings.
- Select Log Shipper on the side-panel and move to Mappings.
- Look for the respective plugin’s Default Mapping file (for example: Qradar Default Mapping).
- Click on the Clone action to make a copy of the Default Mapping file.
- Provide Some Name to this Custom Mapping file.
- Now, go to the Events tab and expand the Extensions part in the Network Events section.
- Search for the “networkSessionId” field and remove it from the mapping.
- Save the mapping file.
- Now, using the back-arrow key, go back and into the Log Shipper Module.
- Select Plugins and edit the respective plugin (Syslog/Qradar).
- Change the selected mapping from the dropdown list and select the recently created Custom Mapping.
- Now, click Save for the plugin.
After some time, you should be able to see in the Logging Section that the “networkSessionId” field related warning messages are no longer getting populated
For your reference, you can follow this document for creating a mapping: Create a Mapping File in Log Shipper
Unable to configure a provider plugin with iterator already exists error
Issue Overview :
Users configuring a Netskope provider plugin within Cloud Exchange may encounter an error related to the Client Status iterator. This occurs when the tenant already has a Client Status iterator created by another module (e.g., Netskope CLS or Netskope CRE) via different user or another CE instance.
Error:
TENANT Netskope Tenant (Required) [Support Tenant]: Error while creating iterator with name netskope_ce_cs_iterator. Cannot create Client Status Iterator. One iterator already exists for the Client Status event for your tenant. Delete the existing iterator to continue.

Root Cause
- Each Netskope tenant supports only one Client Status iterator.
- When a plugin (Netskope CLS or Netskope CRE) is configured, Cloud Exchange checks for an existing iterator:
- If missing → creates a new iterator.
- If already present → validation fails if it is triggered via a different user or another CE instance, returning the error.
This behavior is by design: multiple modules must share the same iterator, and a second cannot be created.
Steps to Troubleshoot
1. Confirm existing iterator
- The error indicates one is already present on the tenant.
- This usually happens if CLS (with Client Status enabled) or other integration has been configured previously.
Confirm the name of the existing Iterator via CE error logged upon trying to add the Plugin.
API response: {"message":"Only one iterator is allowed per event type. Please use the existing iterator, netskope_ce_cs_iterator_70332c65-aad4xxxxxxxxxxxxxxxxxx, or delete the existing iterator."}

2. Delete the existing iterator
- Use the below script to delete the existing iterator
curl –location –request DELETE ‘<Tenant_url>/api/v2/events/dataexport/iterator/<iterator_name>’ –header ‘Authorization: Bearer <token>’
- Replace the following:
○ <Tenant_url>
○ <iterator_name>: Copy the highlighted iterator name from the error log in logging section
○ <token>
3. Reconfigure plugins in Cloud Exchange
- Configure the Provider plugin first.
- Then add CLS, CRE, and other modules.
- All modules created by the same Provider plugin in the same CE instance will share the same iterator.
Resolution
Deleting and reconfiguring the iterator allows the same user to configure all plugins successfully in a single CE instance.
Diagnostic Stalls in the Running State
Issue Overview
When Diagnosis is triggered from the Cloud Exchange > Settings > General Tab, the status of the job stays in the “Running” state. Since Diagnosis collects exhaustive details about the Cloud exchange deployment it will take few minutes to execute, however if it stays in the “Running” state even after considerable about of time then follow below steps to stop existing diagnose job.
Steps to stop the existing diagnose job
- Navigate to the CE installation directory (In case of HA, use the node from where diagnose is triggered)
- Verify already running diagnose jobs
sudo ps -A | grep diagnose - Run command to kill existing diagnose jobs
sudo pkill diagnose - Remove stale diagnose metadata files.
- For HA Deployments
sudo cd {HA_NFS_DATA_DIRECTORY}sudo rm -f ./diagnose_output/.diagnose_job_*
- For Standalone Deployments
sudo cd {CE installation directory}sudo rm -f ./data/diagnose_output/.diagnose_job_*
- For HA Deployments
- Re-trigger the Diagnose job execution
Unable to Fetch All Target Fields from a ServiceNow Instance
While configuring a Queue Configuration in the Ticket Orchestrator module for the ServiceNow plugin, you may notice that not all expected target fields are available under the Map Fields section.
Cause
The target fields displayed in the Map Fields section are dynamically retrieved from the configured Destination Table in the ServiceNow plugin using the /api/now/table/sys_dictionary endpoint.
During this process:
- Only fields returned by the sys_dictionary API are available for mapping.
- System-defined fields (fields whose names begin with sys_) are intentionally excluded because ServiceNow does not allow these fields to be modified through the API.
As a result, if a field is not returned by the sys_dictionary endpoint, it will not be available for mapping within the Queue Configuration.
Resolution
To verify which fields are available for mapping, run the following cURL command against your ServiceNow instance.
Before running the command:
- Replace <Instance URL> with your ServiceNow instance URL.
- Replace <Username> with your ServiceNow username.
- You will be prompted to enter your ServiceNow password.
cURL Command:
curl --location '<Instance URL>/api/now/table/sys_dictionary?sysparm_query=name%3Dincident%5EORname%3Dtask%5Einternal_type!%3Dcollection&sysparm_fields=column_label%2Celement%2Cinternal_type&sysparm_offset=0&sysparm_limit=1000' -u '<Username>' -H 'Accept: application/json'
Expected Output
The command returns a JSON response containing the fields available for the selected destination table.
Each entry includes information such as:
- column_label: Display name of the field.
- element: Internal field name.
- internal_type: ServiceNow field type.
Review the returned fields to determine which fields are available for mapping within the Queue Configuration.
Validation
- If the expected field is present in the API response, it should also be available for selection in the Map Fields section of the Queue Configuration.
- If the expected field is not present in the API response, the field is not available for mapping because it is not being returned by the ServiceNow sys_dictionary API for the configured destination table.
- Fields prefixed with sys_ are expected to be absent, as they are excluded by design.
Cloud Exchange Platform Error Codes and Diagnostics
These sections provide descriptions for the Cloud Exchange Platform and the Log Shipper, Ticket Orchestrator, Threat Exchange, and Risk Exchange module errors.
Cloud Exchange Error Codes
| Error Code | Error message |
|---|---|
| CE_1000 | Invalid request query parameter is provided: The query parameter needs to be only from “sso”, “slo”, “sls”, and “acs”. Any other request query parameter provided will throw this error. |
| CE_1001 | Error occurred while processing the query: Any kind of error that has not been handled will be handled here. An example might be the Overflow Error when the integer value is too long. |
| CE_1002 | Could not load the uploaded plugin: Will handle all HTTP Exceptions only. |
| CE_1003 | Error occurred while checking for updates: Occurs when the docker credentials are wrong. Can also occur when there are Docker errors. |
| CE_1004 | Error occurred while connecting to mongodb: Occurs during either 1) MongoDB container is down or 2) The MongoDB credentials are wrong. |
| CE_1005 | Error occurred while checking for system updates: Occurs when there is an issue with credentials or there is a Docker error like DockerException(“”Error while fetching server API version: (‘Connection aborted.’, PermissionError(13, ‘Permission denied’))””)”. |
| CE_1006 | Error occurred while checking for plugin updates: Occurs if there is a connection error to the repository or if there are not enough permissions. |
| CE_1007 | Error occurred while cleaning up system logs: Occurs if Mongodb container might be down or if there is a connection error. |
| CE_1008 | Error occurred while cleaning up tasks: Occurs if Mongodb container might be down or if there is a connection error. |
| CE_1009 | Tenant with name <tenant_name> no longer exists: Occurs when the tenant has been deleted. |
| CE_1010 | Error occurred while pulling alerts: Exceptions related to V2 API of Netskope like Max Retry Error or Connection, Proxy Error. |
| CE_1011 | Error occurred while pulling events: Exceptions related to V2 API of Netskope like Max Retry Error or Connection, Proxy Error. |
| CE_1012 | Error while loading plugin. Could not parse manifest: Occurs when the manifest.json provided is invalid. |
| CE_1013 | Error occurred while importing plugin: Occurs when there are import, syntax, and library errors. |
| CE_1014 | Error occurred while cloning plugin repo: Occurs when CE is not able to clone git repo due to connectivity or wrong credentials or incorrect repo. |
| CE_1015 | Error occurred while importing mapping file: Occurs if there is a wrong key provided in mapping file or there is an invalid JSON file. |
| CE_1016 | Error occurred while fetching updates for plugin repo: Occurs when CE is not able to connect to the remote repo because of reasons such as expired credentials or exceptions in the command git fetch. |
| CE_1017 | Error occurred while parsing manifest.json for <package>: Occurs if and only if there is a JSON decode error during the parsing of manifest.json file. |
| CE_1018 | Error occurred while updating origin for repo: Occurs if wrong repository credentials are provided or there are expired repo credentials or there is a connection error. |
| CE_1019 | Could not find container with keywords <containers>: Occurs if CE is not able to find containers from client’s container list. |
| CE_1020 | Error occurred while checking for updates for container <containers>: Occurs when CE is not able to pull the changes from the docker hub for the given image tag. |
| CE_1021 | Error occurred while updating the containers: Occurs when watchtower container might be down or there is an invalid token due to which watchtower cannot be connected. |
| CE_1022 | Error occurred while connecting to rabbitmq server: Occurs if CE cannot connect to the rabbitmq API. |
| CE_1023 | Error occurred while sharing usage analytics with Netskope: Occurs due to mongodb error, key error or connection error. |
| CE_1024 | Error occurred while validating v2 token : Exceptions related to V2 API of Netskope like Max Retry Error or Connection, Proxy Error. |
| CE_1025 | Error occurred while validating v1 token: Exceptions related to V1 API of Netskope like Max Retry Error or Connection, Proxy Error. |
| CE_1026 | Exception occurred while checking disk free alarm: Any exception that occurs while connecting to Rabbitmq API. There might be a connection error or sometimes even rabbitmq might be down. |
| CE_1027 | Could not load the uploaded plugin: Will handle all exceptions and then proceeds to throw a 500 internal server error along with information about the exception caught. |
| CE_1028 | Error occurred while checking for updates: Occurs during actually updating. This happens when the docker credentials are wrong. Can also occur when there are Docker errors |
| CE_1029 | Tenant with name <tenant_name> no longer exists: Occurs if a tenant is not found and CE is trying to pull alerts. Can happen if the tenant is deleted. |
| CE_1030 | Tenant with name <tenant_name> no longer exists: Occurs if a tenant is not found and CE is trying to pull events. Can happen if the tenant is deleted. |
| CE_1031 | Error occurred while pulling alerts: Occurs when the status code is not valid (not 200 or 201) for V2 API. There are no exceptions, only the response status code is invalid. |
| CE_1032 | Error occurred while pulling alerts: Any other exception for V2 API not handled before will be handled here. |
| CE_1033 | Error occurred while pulling alerts: Exceptions related to V1 API of Netskope like Max Retry Error or Connection, Proxy Error. |
| CE_1034 | Error occurred while pulling alerts: Occurs when the status code is not valid (not 200 or 201) for V1 API. There are no exceptions, only the response status code is invalid. |
| CE_1035 | Error occurred while pulling alerts: Any other exception for V1 API not handled before will be handled here. |
| CE_1036 | Error occurred while pulling events: Occurs when the status code is not valid (not 200 or 201) for V2 API of events. There are no exceptions, only the response status code is invalid |
| CE_1037 | Error occurred while pulling events: Any other exception for V2 API not handled before will be handled here. |
| CE_1038 | Error occurred while pulling events: Exceptions related to V1 API of Netskope like Max Retry Error or Connection, Proxy Error. |
| CE_1039 | Error occurred while pulling events Occurs when the status code is not valid (not 200 or 201) for V1 API of events. There are no exceptions, only the response status code is invalid. |
| CE_1040 | Error occurred while pulling events: Any other exception for V1 API not handled before will be handled here. |
| CE_1042 | Error occurred while connecting to rabbitmq server: Any other exceptions not handled before will be handled here for rabbitmq API. |
| CE_1043 | Error occurred while sharing usage analytics with Netskope: Occurs when the status code is not a success one for analytics. |
| CE_1044 | Error occurred while validating v2 token: For V2 token, this error occurs when the response code is 403 which means the tenant name or the API token is incorrect. |
| CE_1045 | Error occurred while validating v1 token: For V1 token, this occurs when the response code is 403 which means the tenant name or the API token is incorrect. |
| CE_1046 | Exception occurred while checking disk free alarm: This error occurs when the status code is not a success one for the rabbitmq API. |
| CE_1047 | Error occurred while processing the query: Any kind of error that has not been handled will be handled here. An example might be the OverflowError when the integer value is too long. |
| CE_1048 | Error occurred while checking for updates: Occur when the entered credentials are wrong. |
| CE_1049 | The system’s compute is insufficient to manage the configured workload …: Happens when the CPU configured workload isn’t enough to run the plugins/tenants configured. Thus, need to reduce the CE plugin/tenant usage or increase the workload. |
| CE_1050 | You’re running out of disk space…: This happens when the disk space is critically low. Thus, user will have to free up the disk space or provide additional disk space. |
| CE_1051 | Error occurred while checking resources or physical disk space: Occurs when CE not able to fetch details regarding physical disk space or CPU cores. |
| CE_1052 | Error occurred while pulling events: Any exception not handled before will be handled here for events. |
| CE_1053 | Error occurred while pulling events: Any exception for historical events will be handled here. |
| CE_1054 | Error occurred while pulling events: Exceptions related to Historical iterator API like Max Retry Error or Connection, Proxy Error. |
| CE_1055 | Error occurred while pulling events: Exceptions related to Historical iterator API like Max Retry Error or Connection, Proxy Error. |
| CE_1056 | Error occurred while pulling events: Any exception for historical events will be handled here. |
| CE_1057 | Error occurred while pulling events: Exceptions related to iterator API like Max Retry Error or Connection, Proxy Error. |
| CE_1058 | Error occurred while pulling events: Exceptions related to iterator API like Max Retry Error or Connection, Proxy Error. |
| CE_1059 | Error occurred while pulling events: Exceptions related to Iterator API like Max Retry Error or Connection, Proxy Error. |
| CE_1060 | Error occurred while pulling events: Occurs when the status code is not valid (not 200 or 201) for Iterator API of events. There are no exceptions, only the response status code is invalid. |
| CE_1061 | Error occurred while pulling events: Occurs when the status code is not valid (not 200 or 201) for historical iterator API of events. There are no exceptions, only the response status code is invalid. |
| CE_1062 | Error occurred while pulling events: Occurs when the status code is not valid (not 200 or 201) for historical iterator API of events. There are no exceptions, only the response status code is invalid. |
| CE_1063 | Error occurred while pulling events: Occurs when the status code is not valid (not 200 or 201) for Iterator API of events. There are no exceptions, only the response status code is invalid. |
| CE_1064 | Error occurred while pulling alerts: Exceptions related to iterator API like Max Retry Error or Connection, Proxy Error. |
| CE_1065 | Error occurred while pulling alerts: Occurs when the status code is not valid (not 200 or 201) for iterator API of alerts. There are no exceptions, only the response status code is invalid. |
| CE_1066 | Error occurred while pulling alerts: Exceptions related to historical iterator API like Max Retry Error or Connection, Proxy Error. |
| CE_1067 | Error occurred while pulling alerts: Occurs when the status code is not valid (not 200 or 201) for historical iterator API of alerts. There are no exceptions, only the response status code is invalid. |
| CE_1068 | Error occurred while pulling alerts: Any exception for historical events will be handled here. |
| CE_1069 | Error occurred while pulling alerts: Exceptions related to historical iterator API like Max Retry Error or Connection, Proxy Error. |
| CE_1070 | Error occurred while pulling alerts: Occurs when the status code is not valid (not 200 or 201) for historical iterator API of alerts. There are no exceptions, only the response status code is invalid. |
| CE_1071 | Error occurred while pulling alerts: Any exception for historical alerts will be handled here. |
| CE_1072 | Error occurred while pulling alerts: Exceptions related to iterator API like Max Retry Error or Connection, Proxy Error. |
| CE_1073 | Error occurred while pulling alerts: Occurs when the status code is not valid (not 200 or 201) for iterator API of alerts. There are no exceptions, only the response status code is invalid. |
| CE_1074 | Error occurred while pulling alerts: Any exception for alerts will be handled here. |
| CE_1075 | Error occurred while getting the running processes: Occurs if there is a problem while fetching the running processes. |
| CE_1076 | Workers not deleted for tenant. |
| CE_1077 | Workers not deleted for tenant. |
| CE_1078 | Error occurred while checking worker for tenant: Any exception during subprocess handling will be caught here. |
| CE_1079 | Error occurred while creating workers for tenant: Any exception during subprocess handling will be caught here. |
| CE_1080 | Error occurred while pulling alerts: Any exception for alerts will be handled here. |
| CE_1126 | Error occurred while connecting to MongoDB. |
| CE_1127 | Error occurred while processing the response from RabbitMQ. |
| CE_1128 | Error occurred while checking the CORE status for ‘{ip}’ node. |
| CE_1129 | Error occurred while checking the UI status for ‘{ip}’ node. |
Log Shipper Error Codes
| Error Code | Error message |
|---|---|
| CLS_1000 | Could not found attribute mapping with name {mapping_file}: Occurs if mapping file is not found from database. |
| CLS_1001 | Error occurred while validating configuration: Occurs if there is a validation error occured from plugin configuration parameters. |
| CLS_1002 | Business rule {rule.name} cannot be deleted: The default business rule can’t be deleted. |
| CLS_1003 | Error occurred while creating a new configuration (toast). Exception is logged as it is => General Exception: Occurs if pymongo or scheduler error occurs while creating a new configuration. |
| CLS_1004 | CLS business rule {rule} may have been deleted: Occurs if someone deleted business rule, while parsing webtx. |
| CLS_1005 | Error occurred while ingesting [{data_type}][{sub_type}] data for configuration {configuration.name}. {retries_remaining} retries remaining. {repr(ex)}: Occurs while ingesting data in cls plugin. |
| CLS_1006 | Could not find the plugin with id='{destination.plugin}’: Occurs if plugin does not exist in container. |
| CLS_1007 | Could not find the mapping file {destination.attributeMapping} required for {destination.name} : Occurs if mapping file does not exist during the transforming and ingest task. |
| CLS_1008 | Plugin {destination.plugin} has not implemented transform method: Occurs if transform method is not implemented by a plugin. |
| CLS_1009 | Transformation of {len(data)} [{data_type}][{data_subtype}] for {destination.name} has failed with an exception: {repr(ex)}: Occurs if transformation of a field is failed by plugin and so the plugin will raise respective error and it will be caught here. |
| CLS_1010 | Business rule {rule} no longer exists: Occurs if someone deletes the SEIM while fetching historical data. |
| CLS_1011 | CLS configuration {source} no longer exists: While fetching historical data if source configuration is deleted by user, then this error occurs. |
| CLS_1012 | CLS configuration {destination} no longer exists: While fetching historical data if destination configuration is deleted by user, then this error occurs. |
| CLS_1013 | Historical alert pulling failed for the window {event_helper.start_time} UTC to {event_helper.end_time} UTC for {source.name} to {destination}, rule {rule.name}. Error: {err}”: Occurs if manual sync is true and the historical alert task failed, while pulling historical alerts. |
| CLS_1014 | Historical alert pulling failed for {source.name} to {destination}, rule {rule.name}. Error: {err}: Occurs if manual sync is false and the historical alert task failed,while pulling historical alerts. |
| CLS_1015 | Netskope CLS Plugin: Validation error occurred. Error: Invalid alert_type found in the configuration parameters: Occurs if the alert type is invalid. |
| CLS_1016 | Netskope CLS Plugin: Validation error occurred. Error: Invalid event_type found in the configuration parameters: Occurs if the event type is invalid. |
| CLS_1017 | Netskope CLS Plugin: Validation error occurred. Error: Alert type, and Event type both can not be empty: Occurs if the alert type and event type are both empty. |
| CLS_1018 | Netskope CLS Plugin: Validation error occurred Error: Invalid hours provided: Occurs if the hours provided are invalid like negative hours or empty hours provided. |
Ticket Orchestrator Error Codes
| Error Code | Error message |
|---|---|
| CTO_1000 | Error occurred while processing the query. (Toast). Exception is logged as it is => Query error: Occurs if the user tries to filter alerts with invalid type/ invalid attribute. |
| CTO_1001 | Could not find a configuration with name {name}: Occurs if configured plugin does not exist in database. |
| CTO_1002 | Plugin {configuration.plugin} does not implement the get_queues method: Occurs if plugin does not have get_queue() method. |
| CTO_1003 | Error occurred while fetching queues for configuration {configuration.name}. Exception is logged as it is. Error occured. Check logs: If the get_queue() method return unexpected result like not able to fetch queue from plugin, or api error, or max retry error. |
| CTO_1004 | Error occurred while getting available fields. Exception is logged as it is: Occurs if the plugin API’s return status code is not 200. |
| CTO_1005 | Error occurred while getting default mapping. Exception is logged as it is: Occurs if plugin returns an invalid default mapping. |
| CTO_1006 | Exception occurred while executing validate for step {step}. Exception is logged as it is: Occurs when there is an error like authentication or params error. |
| CTO_1007 | Error occurred while getting fields. Check logs: While fetching fields from plugin apis, if an API related error occurred then it will be caught here. |
| CTO_1008 | Exception is logged as it is. Error occurred while processing the query: Occurs when a user tries to filter tasks with invalid type/invalid attribute. |
| CTO_1009 | Error occurred while cleaning up alerts/tasks/notifications. Exception is logged as it is: Occurs when a celery task is not able to delete task/alerts/ notification, which can be due to MongoError or Rabbitmq error. |
| CTO_1010 | Ticket Orchestrator configuration {name} no longer exists: Occurs when a celery task is triggered but somehow configuration is deleted while pulling alerts in CTO. |
| CTO_1011 | Could not create/update task for alert with ID {alert.id} for configuration {configuration.name}. Exception is printed as it is: Occurs when a plugin is not able to generate/update tickets/incidents/ notification because of api related error. For example: Could not create tasks attribute error or Could not create tasks connection error/proxyerror/general error. |
| CTO_1012 | Could not create tasks for the given alerts with configuration {configuration.name}. Plugin does not implement create_task method: Occurs if the plugin does not have create_task() method. |
| CTO_1013 | Error occurred while creating tasks with configuration {configuration.name}. Exception is logged as it is: Any mongo error or plugin error will be caught here. |
| CTO_1014 | Business rule {rule} no longer exists: Occurs if a business rule is deleted from UI, while syncing state of tasks status. |
| CTO_1015 | Could not pull alerts. Plugin with ID {configuration.plugin} does not exist: Occurs if someone deletes plugin from core container, while pulling alerts from plugin. |
| CTO_1016 | Could not pull alerts. Plugin does not implement pull_alerts method: Occurs if someone tries to pull alerts from plugin but plugin does not have pull alerts method implemented. |
| CTO_1017 | Could not pull alerts. An exception occurred. Exception is logged as it is: General errors will be handled here. |
| CTO_1018 | Could not sync states. Plugin with ID {configuration.plugin} does not exist: Occurs if configuration does not exist and sync_state method is triggered. |
| CTO_1019 | Could not sync states. Plugin does not implement sync_states method: Occurs when the sync_states method is not implemented. |
| CTO_1020 | Could not sync states. An exception occurred. Exception is logged as it is: All the general errors coming from the plugin will be caught here. |
| CTO_1021 | Error occurred while getting fields from alert with id=<id>: Occurs when there is an exception caught during getting fields from alert. |
| CTO_1022 | Exception occurred while executing validate for step {step}. Exception is logged as it is: Occurs when there is an authentication/params errors. |
| CTO_1024 | Error occurred while retrying ticket creation. Ticket Orchestrator business rule {rule} no longer exists. |
| CTO_1025 | Error occurred while retrying ticket creation. Queue for Ticket Orchestrator business rule {rule} no longer exists. |
| CTO_1026 | Error occurred while retrying ticket creation. Ticket Orchestrator configuration {configuration} no longer exists. |
Threat Exchange Error Codes
| Error Code | Error message |
|---|---|
| CTE_1000 | Could not store the indicator with value='{indicator.value}’: Occurswhile updating indicators if there is an error occured in mongo update query. |
| CTE_1001 | Could not find the plugin with id='{configuration.plugin}’: Occurs if the plugin cannot be found by CE |
| CTE_1002 | Pull method returned data with invalid datatype for plugin with id='{configuration_db.plugin}’: If returned indicators from plugin is not a valid list, None, or not an instance of Indicator Model, then this error can occur. |
| CTE_1003 | Pull method not implemented by plugin for configuration ‘{configuration_name}’: Occurs if the pull method is not implemeted by plugin while executing the plugin life cycle. |
| CTE_1004 | Error occurred while connecting to the database: In a mongo operation, there can be AuthenticationError, ConnectionError, etc. |
| CTE_1005 | Error occurred while executing the plugin lifecycle for configuration: While pulling iocs from plugins, if any exception occures, it will be caught here. |
| CTE_1006 | Could not share indicators with configuration ‘{shared_with}’. Invalid return type: Can occur while pushing iocs and if the plugin returns an invalid model. |
| CTE_1007 | Could not share indicators with configuration ‘{shared_with}’. {push_result.message}: If pushResult is false, this error will occur. |
| CTE_1008 | Could not share indicators with configuration ‘{config}’; it does not exist.: Occurs if target plugin does not exist. |
| CTE_1009 | Could not share indicators with configuration ‘{config}’; plugin with id='{configuration.plugin}’ does not exist: Occurs if we cannot find plugin with the help of plugin id |
| CTE_1010 | Could not share indicators with configuration ‘{configuration.name}’. Push method not implemented: Occurs when the push method is not implemeted by target plugin. |
| CTE_1011 | Error occurred while sharing indicators with configuration ‘{configuration.name}’: If any exception occur while pushing indicator from plugin it will be caught here. |
| CTE_1012 | Error occurred while creating a new configuration: Occurs if a user tries to change the configuration model. |
| CTE_1013 | Error occurred while scheduling the configuration: Occurs if there is an exception caught during scheduling perodic tasks. An example would be a PyMongo Error. |
| CTE_1014 | Error occurred while getting list of actions: Occurs when the plugin does not return action list in expected format. Thus we get action method return errors. |
| CTE_1015 | Error occurred while processing the query: While reading indicators, if there is any exception, it will be handled here. |
| CTE_1016 | Error occurred while checking urllist. |
| CTE_1017 | Error occurred while creating urllist. |
| CTE_1018 | Error occurred while appending URL list to Netskope. |
| CTE_1019 | Error while deploying changes. |
| CTE_1020 | Error occurred while pushing URL list to Netskope. |
| CTE_1021 | Plugin: Netskope – {tenant_name}, Exception occurred while pushing data to Netskope: Any exception not caught before will be handled here. |
| CTE_1023 | Plugin: Netskope Invalid value for ‘Type of Threat data to pull’ provided. Allowed values are Both, Malware, or URL: If the value of threat data to pull is not malware, url or both, then this error occurs. So it may occur when the user selects nothing. |
| CTE_1024 | Plugin: Netskope – {tenant_name}, Exception occurred while validating action parameters: Occurs when validation of action parameters is unsuccessful. |
| CTE_1025 | Error occurred while getting list of actions. Exception is logged as it is => General Exception. Could not get action list. Check logs: Occurs when there is an exception while getting list of actions. Happens when the plugin does not return action list in expected format. CE returns action method return errors. |
| CTE_1026 | Error occurred while checking urllist : Occurs when the status code is not valid. |
| CTE_1027 | Error occurred while creating urllist : If any exception occurs, it will be handled here. |
| CTE_1028 | Error occurred while creating urllist: Occurs when the status code is not valid. |
| CTE_1029 | Error occurred while appending URL list to Netskope: If any exception occurs, it will be handled here. |
| CTE_1030 | Error occurred while appending URL list to Netskope: Occurs when the status code is not valid. |
| CTE_1031 | Error occurred while appending URL list to Netskope: If any exception occurs, it will be handled here. |
| CTE_1032 | Error occurred while appending URL list to Netskope: Occurs when the status code is not valid. |
| CTE_1033 | Error while deploying changes: Occurs when the status code is not valid. |
| CTE_1034 | Error occurred while pushing URL list to Netskope: Occurs when the status code is not valid. |
| CTE_1035 | Error while pushing file hash list to Netskope: Occurs when the status code is not valid. |
| CTE_1036 | Error while pushing file hash list to Netskope: Occurs when the status code is not valid. |
Risk Exchange Error Codes
| Error Code | Error message |
|---|---|
| CRE_1000 | Error occurred while validating configuration: Occurs while validating plugin configuration parameters if validation is unsuccessful. For example – Base URL is empty. |
| CRE_1001 | Error occurred while processing the query. Exception is logged as it is => Query error: While fetching action logs from database if its filter with invalid attribute. |
| CRE_1002 | Could not get action list. Check logs. Exception is logged as it is. Error occurred while getting list of actions: Occurs while fetching action list from CRE plugin. |
| CRE_1003 | Error occurred while processing the query. Exception is logged as it is => Query error: Occurs while filtering CRE logs. |
| CRE_1004 | Error occurred while processing the query. Exception is logged as it is => Query error: While fetching users from database or filtering users if any wrong attribute isprovided, then this error occurs. |
| CRE_1005 | Error occurred while calculating aggregate normalized score. Exception is logged as it is: Occurs while calculating normalized score for plugins if any error occurs related to pymongo. |
| CRE_1006 | Error occurred while cleaning up logs. Exception is logged as it is: Occurs while deleting cre logs if any error ocurred related to pymongo. |
| CRE_1007 | Execute action operation not implemented for configuration {configuration.name}: Occurs if destination plugin does not have execute_action() method while performing action on a CRE user. |
| CRE_1008 | Error occurred while executing action for configuration {configuration.name}. Exception is logged as it is: Occurs if a destination plugin encounter any error while executing execute_action() method, while performing action on CRE user. |
| CRE_1009 | Could not fetch scores from configuration {configuration.name}. Method not implemented: Occurs when Fetch_score() method is not implemented. |
| CRE_1010 | Error occcurred while fetching scores from configuration {configuration.name}. Exception is logged as it is: Occurs if the API gives an unexpected error, while fetching scores of user in plugin method. |
| CRE_1011 | Could not fetch records from configuration {configuration.name}. Method not implemented: Occurs if api gives unexpected error, while fetching scores of user in plugin method.ccurs if fetch_user() method is not implemented in plugin. |
| CRE_1012 | Error occcurred while fetching records from configuration {configuration.name}. Exception is logged as it is: Occurs if fetch_user() method returns unexpected result such as API gives internal server error. |
| CRE_1013 | Invalid value returned by plugin while fetching records from {configuration.name}: Occurs if returned records from plugin does not have datatype list. |
| CRE_1014 | Error occurred while fetching score for user: {record.uid}: Any exception caught during fetching scores will be handled here. |
| CRE_1015 | Error occurred while fetching groups: Any exception caught during fetching groups will be handled here. |
| CRE_1016 | Error occurred while fetching users: Any exception caught during fetching users will be handled here. |
| CRE_1017 | Error occurred while removing user from group: Any exception caught during removing user from group will be handled here. |
| CRE_1018 | Error occurred while adding user to group: Any exception caught during adding user to group will be handled here. |
| CRE_1019 | Error occurred while creating group: Any exception caught during creating a group will be handled here. |
| CRE_1020 | Error occurred while validating SCIM details: Any exception caught during validation of SCIM details will be handled here. |
| CRE_1021 | Error occurred while validating V2 API Token: Any exception caught during validating V2 API Token will be handled here. |
| CRE_1022 | Invalid SCIM Key provided: The SCIM Key provided is wrong as the status code is 401. |
| CRE_1023 | Invalid V2 API Token: The V2 API Token is wrong as the status code is 401. |
| CRE_1024 | Error in credentials(Forbidden user): The user is forbidden as credentials are wrong. |
| CRE_1025 | Netskope CRE: Could not validate SCIM details/V2 API Token. Status code: {groups.status_code}, Response: {groups.text}, Status code: {response.status_code}, Response: {response.text}: The SCIM details or V2 API Token is wrong. |
| CRE_1026 | Could not get action list. Check logs. Exception is logged as it is. Error occurred while getting list of actions. |
| CRE_1027 | Error occurred while fetching score for user: {record.uid}: Occurs while fetching scores, if the status code is not a success code. |
| CRE_1028 | Error occurred while fetching groups: While fetching groups, if the status code is not a success code, then this error will occur. |
| CRE_1029 | Error occurred while fetching users: While fetching users, if the status code is not a success code, then this error will occur. |
| CRE_1030 | Error occurred while removing user from group: While removing user from group, if the status code is not a success code, then this error will occur. |
| CRE_1031 | Error occurred while removing user from group: While removing user from group, if the status code is not a success code, then this error will occur. |
| CRE_1032 | Error occurred while creating group: While creating group, if the status code is not a success code, then this error will occur. |
| CRE_1033 | Error occurred while validating SCIM details: While validating SCIM details, if the status code is not a success code, then this error will occur. |
| CRE_1034 | Error occurred while validating V2 API Token: While validating V2 API Token, if the status code is not a success code, then this error will occur. |
Diagnostic Logs
is section provides information about how to extract various logs required by the Support team before engaging in a troubleshooting call with them. Follow these steps to generate the Diagnostic logs.
- Go to your existing Cloud Exchange directory.
$ cd <ce_directory>
Refer: FAQ | How to find out the Cloud Exchange installation directory?
- Run the Diagnostic utility to generate a Diagnostic log zip file.
$ sudo ./diagnose

- All the required logs will be gathered and added to a ZIP file named based on the current date and time (like Thu_Dec_15_12:06:45_IST_2022). Please attach this zip file to the Support ticket.
Cloud Exchange v6.1.0 and Later
In Cloud Exchange v6.1.0, diagnostic logs can be generated and downloaded directly from the Cloud Exchange UI.
Steps
- Go to Settings > General.
- Locate the Other Settings section.
- Click Run Diagnosis to generate the diagnostic logs.
- After the process completes, download the generated diagnostic logs directly from the UI.
If the Run Diagnosis process remains stuck or does not complete, you need to run command in CLI.
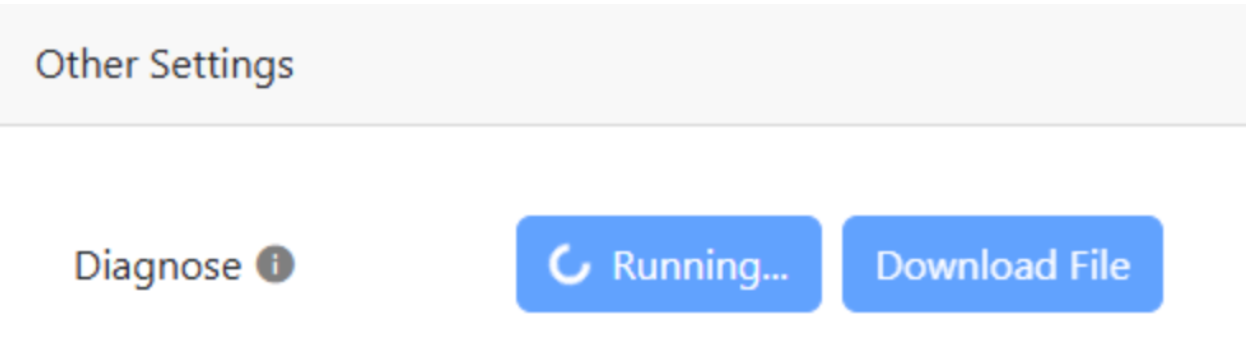
Cloud Exchange Versions Prior to v6.1.0
For Cloud Exchange versions prior to v6.1.0, there is no option to download diagnostic logs directly from the UI. The diagnostic logs must be generated from the Cloud Exchange CLI.
Steps
- Log in to the Cloud Exchange server using the CLI.
- Navigate to the directory where Cloud Exchange is installed.
- Run the following command:
./diagnose
If the command returns “Script is already running” there is an error.
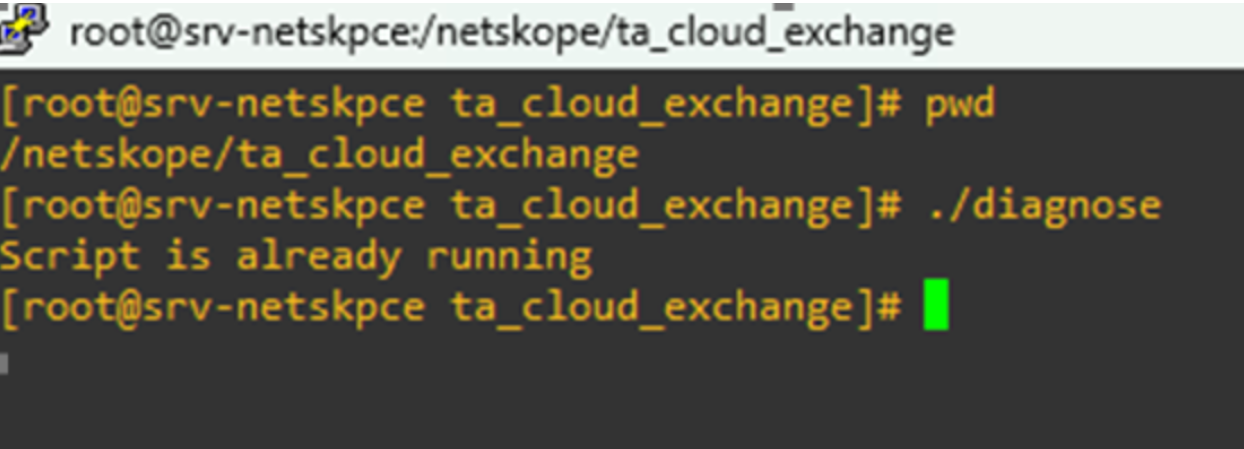
Error Reason: In this situation, run this command in CLI to clear the pending diagnostic task and remove the associated .lock file.rm -rf /tmp/some-unique-id.lock