

Remote Log Collection lets you trigger on-demand diagnostic data collection from a Publisher directly from the Netskope tenant UI — without needing SSH or console access to the Publisher host. The Publisher runs the requested diagnostics, bundles the results, and securely uploads them to Netskope-managed storage. You are notified by email when the bundle is ready, and you can download it from the Publisher detail page.
This capability closes a common troubleshooting gap: instead of asking an administrator to log in to the Publisher and manually gather logs, support and engineering can request the exact diagnostics they need on demand. Publishers keep their existing outbound-only security model — the Management Plane queues the request and the Publisher initiates the upload.
What Gets Collected
Every collection always includes a log bundle of predefined, critical Publisher logs. Operating-system–level logs (for example, /var/log/syslog) are not included.
In addition, you can optionally run one or more network diagnostics as part of the same collection:
| Diagnostic | Purpose | Required inputs | Optional inputs |
|---|---|---|---|
| Ping | Tests network reachability and latency to a target. | — | Target IP / Host Name |
| DNS Lookup | Queries DNS records for a hostname against the Publisher’s configured resolvers. | Host Name | Record Type |
| Traceroute | Traces the network path to a destination. | — | Target IP / Host Name |
| Port Scan | Checks whether a specific TCP/UDP port is open on a target. | Target IP / Host Name, Port | — |
Before You Begin
- Permissions: You need Read + Write or Read + Write + Admin access to Publishers to start a collection. This inherits from your existing Publisher permissions; no separate permission object is required. Read access to Publishers is sufficient to download a log collection.
- Publisher status: The Publisher should be in the Connected state so it can receive the request and upload results.
- Availability: Remote Log Collection is enabled per tenant. If you do not see the Collect Logs action, contact your Netskope account team to have the feature enabled.
- Supported platforms: Remote Log Collection requires Publisher version R140 or higher. It is supported on Publishers only — Local Brokers are not supported.
Field Reference and Validation
All input is validated in the UI before the request is submitted.
| Field | Applies to | Rule |
|---|---|---|
| Target IP / Host Name | Ping, Traceroute | Optional. If provided, must be a valid IPv4 address or hostname. |
| Host Name | DNS Lookup | Required. Must be a valid hostname / FQDN. |
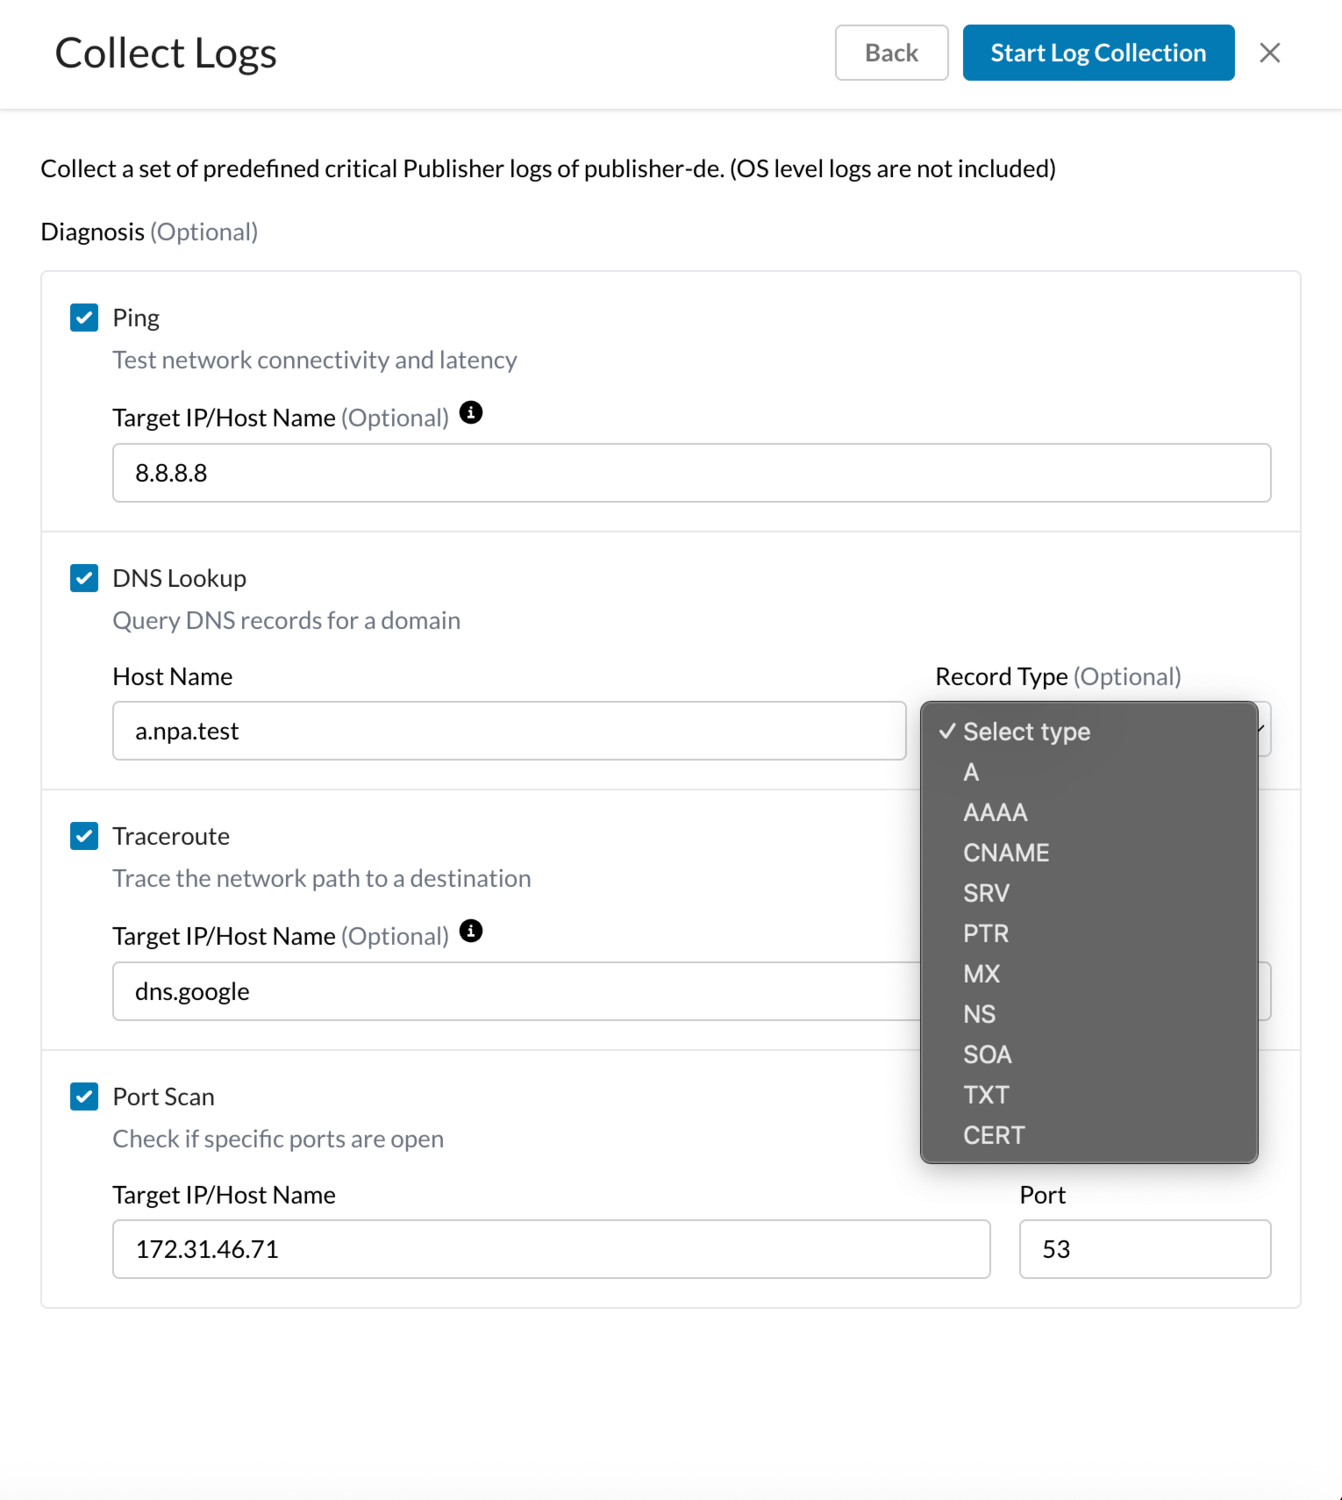
| Record Type | DNS Lookup | Dropdown: A, AAAA, CNAME, SRV, PTR, MX, NS, SOA, TXT, CERT. See the known issue below. |
| Target IP / Host Name | Port Scan | Required. Must be a valid IPv4 address or hostname. |
| Port | Port Scan | Required. Integer between 1 and 65535. |
Workaround: Always choose a specific record type (for example, A) from the Record Type dropdown before starting the collection.
Workaround: Attempt the log collection at a later time since the error is intermittent
Start a Log Collection
1. Open the Publishers page. In the Netskope tenant, go to Security Cloud Platform > Traffic Steering > Publishers.
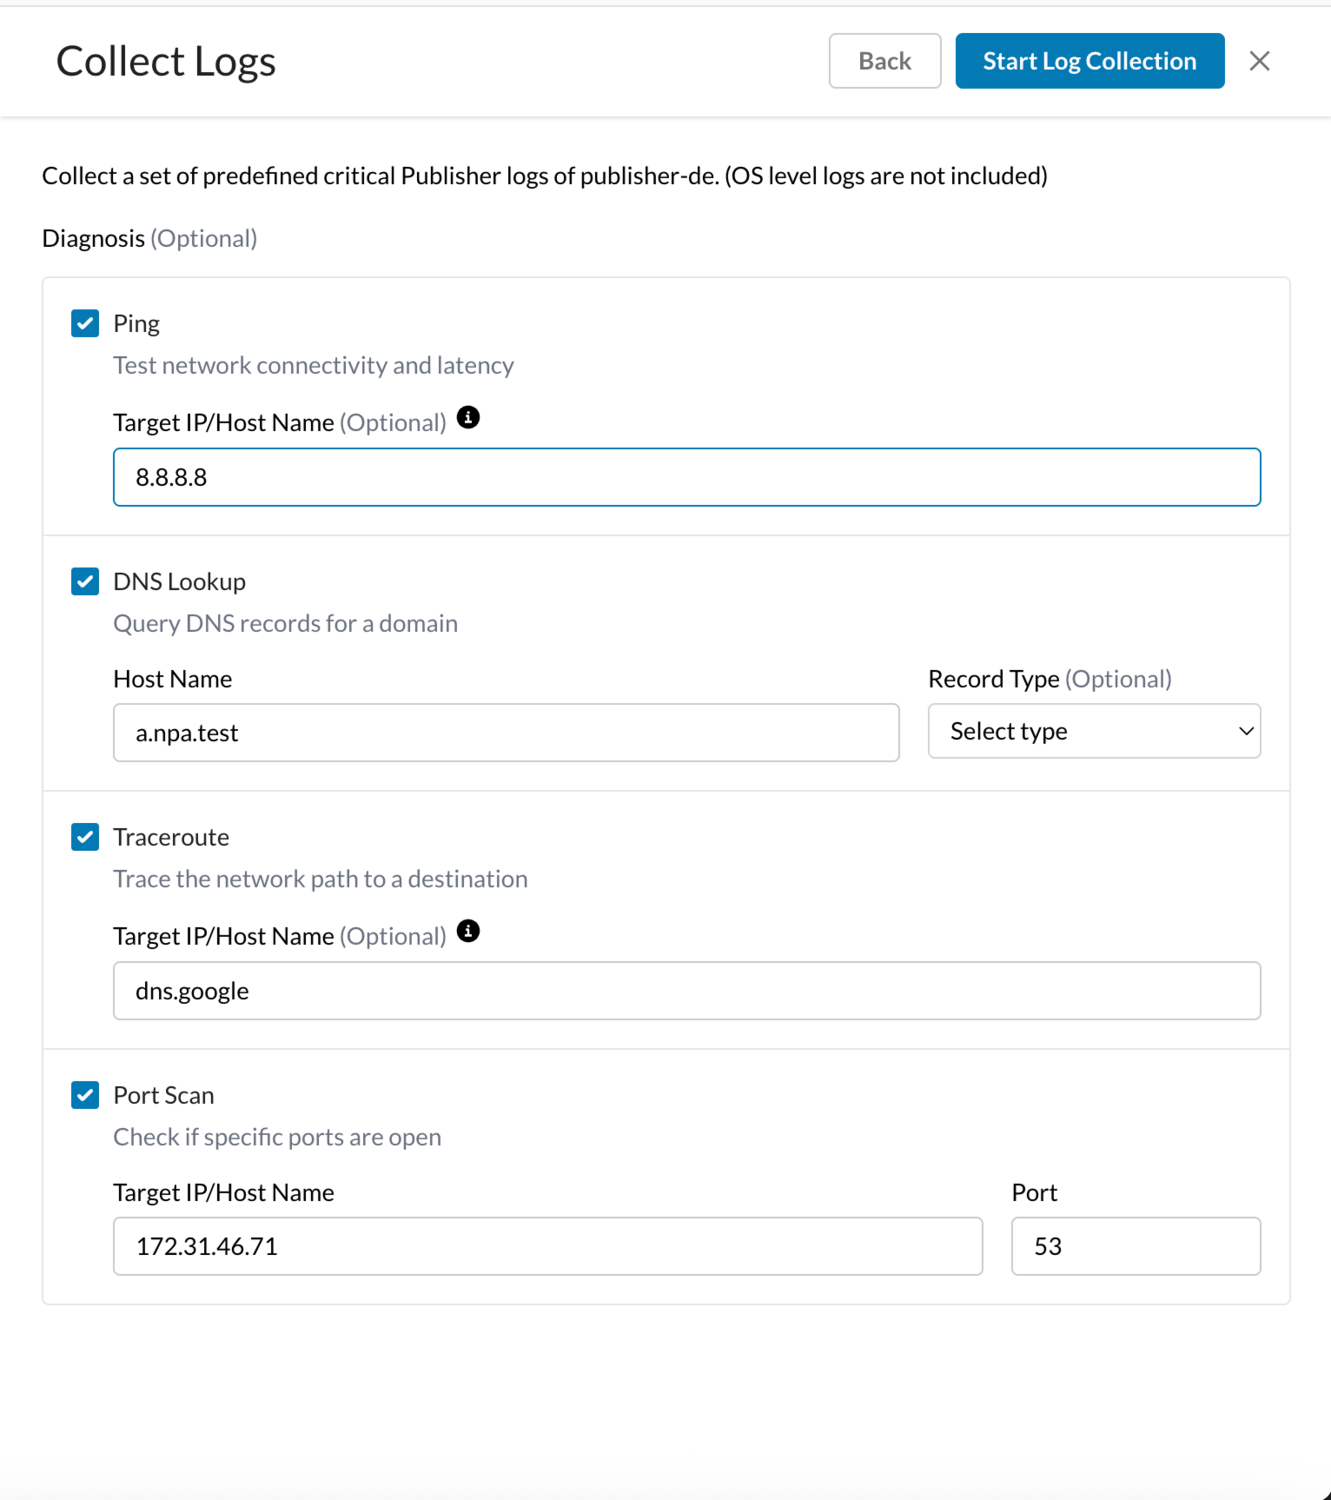
2. Open the Publisher. Click the Publisher name to open its detail view. Review the status and metadata, then click Collect Logs.
You can also start a collection from the Publishers table: open the three-dot row action menu for a Publisher and select Collect Log.
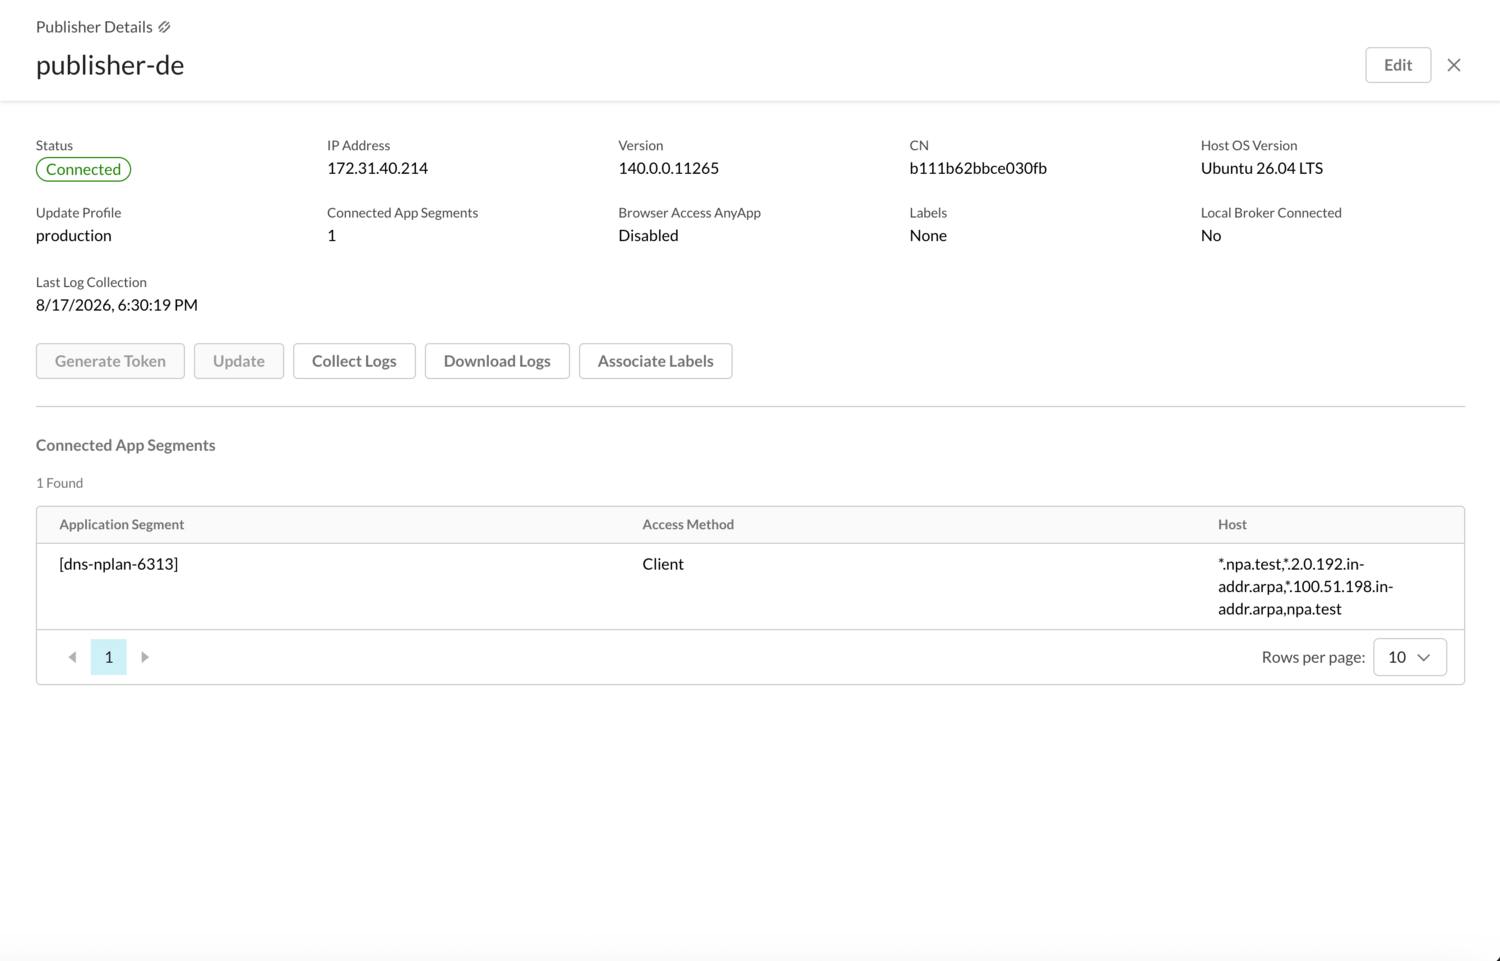
3. Choose diagnostics. In the Collect Logs panel, the log bundle is always collected. Under Diagnosis (Optional), select any additional diagnostics you want and fill in their fields. Selecting a checkbox reveals its input fields.
4. Set the DNS record type. If you selected DNS Lookup, choose a Record Type from the dropdown (for example, A). Do not leave it on Select type — see the known issue above.
5. Start the collection. Click Start Log Collection. A confirmation toast appears and the panel closes. The request is queued to the Publisher.
Download the Logs
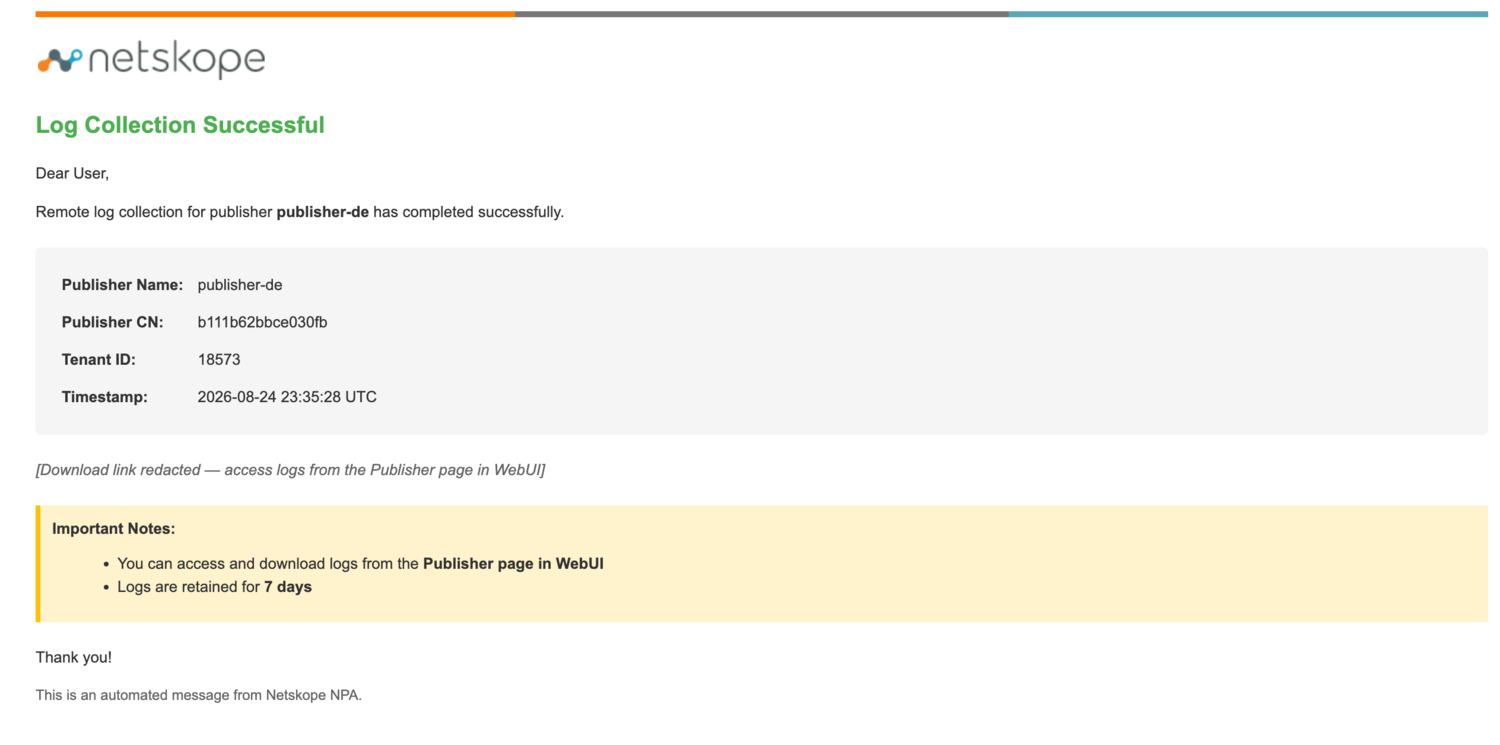
6. Wait for the completion email. When the Publisher finishes and uploads the bundle, Netskope sends a notification email confirming that log collection succeeded, along with the Publisher name, CN, tenant ID, and timestamp.
7. Download from the Publisher detail page. Return to the Publisher detail view. The Last Log Collection time updates and the Download Logs button becomes available. Click Download Logs to download the compressed bundle.
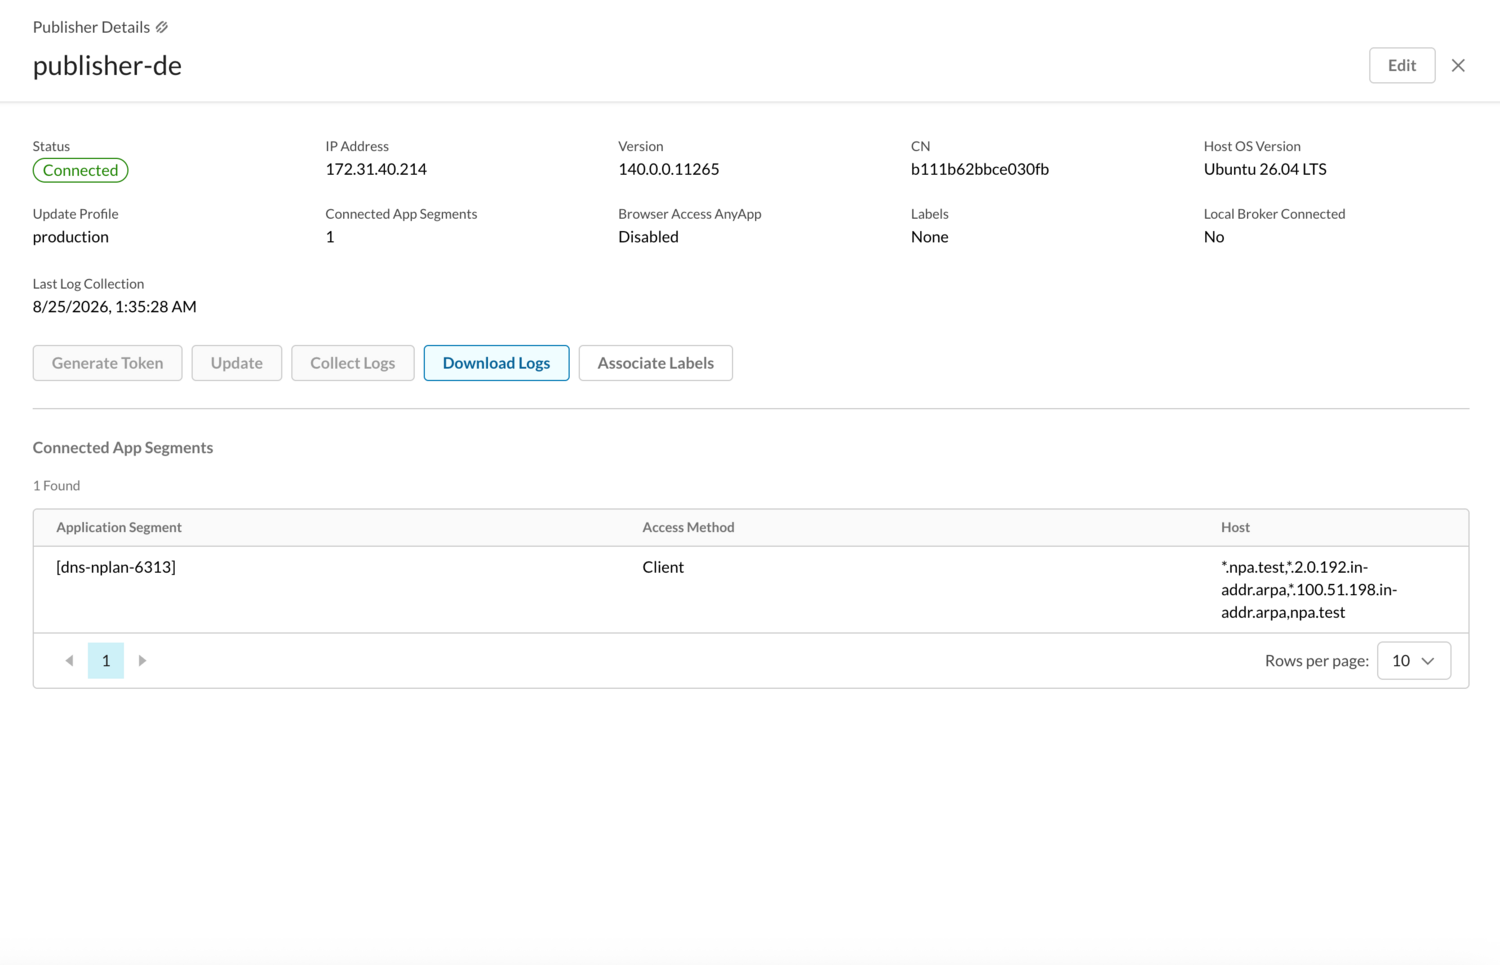
The bundle downloads as a compressed archive named using the tenant ID and Publisher CN, for example tenantid_18573_pub_cn_b111b62bb….

Understanding the Log Bundle
After extracting the archive, the bundle is organized into folders and summary files:
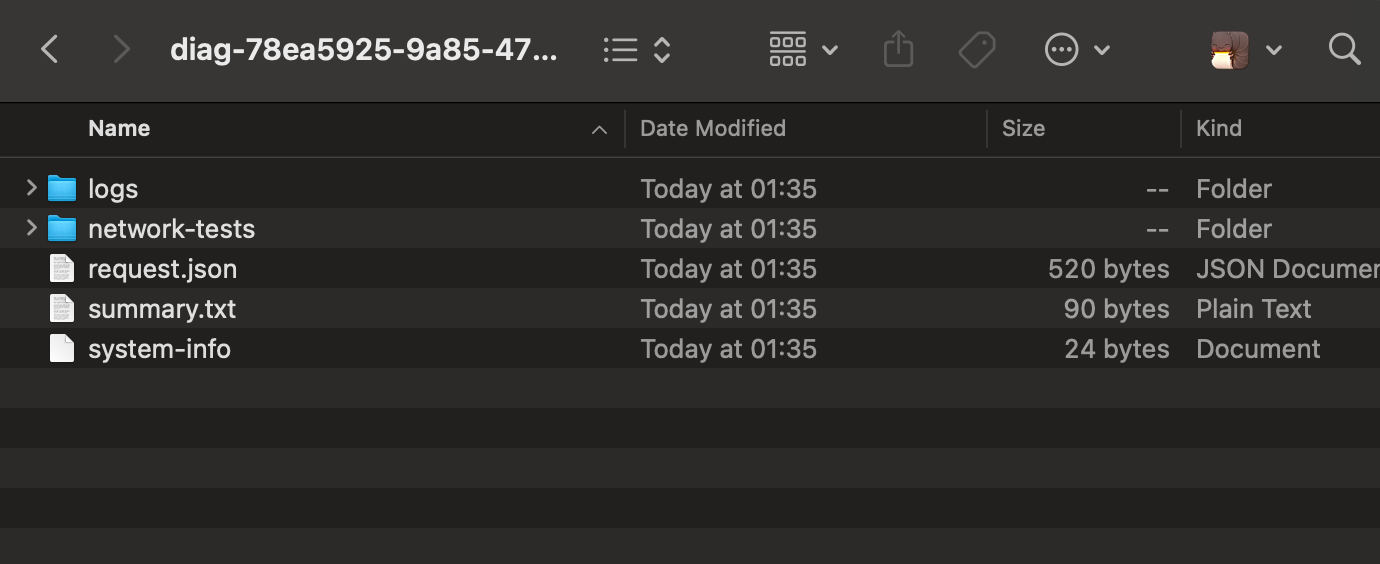
| Item | Contents |
|---|---|
logs/ | The predefined critical Publisher logs. |
network-tests/ | Output files for each network diagnostic you selected (DNS lookup, port scan, traceroute, ping). |
request.json | The parameters that were submitted for this collection. |
summary.txt | A short summary of the collection. |
system-info | Basic system information for the Publisher. |
Sample Diagnostic Output
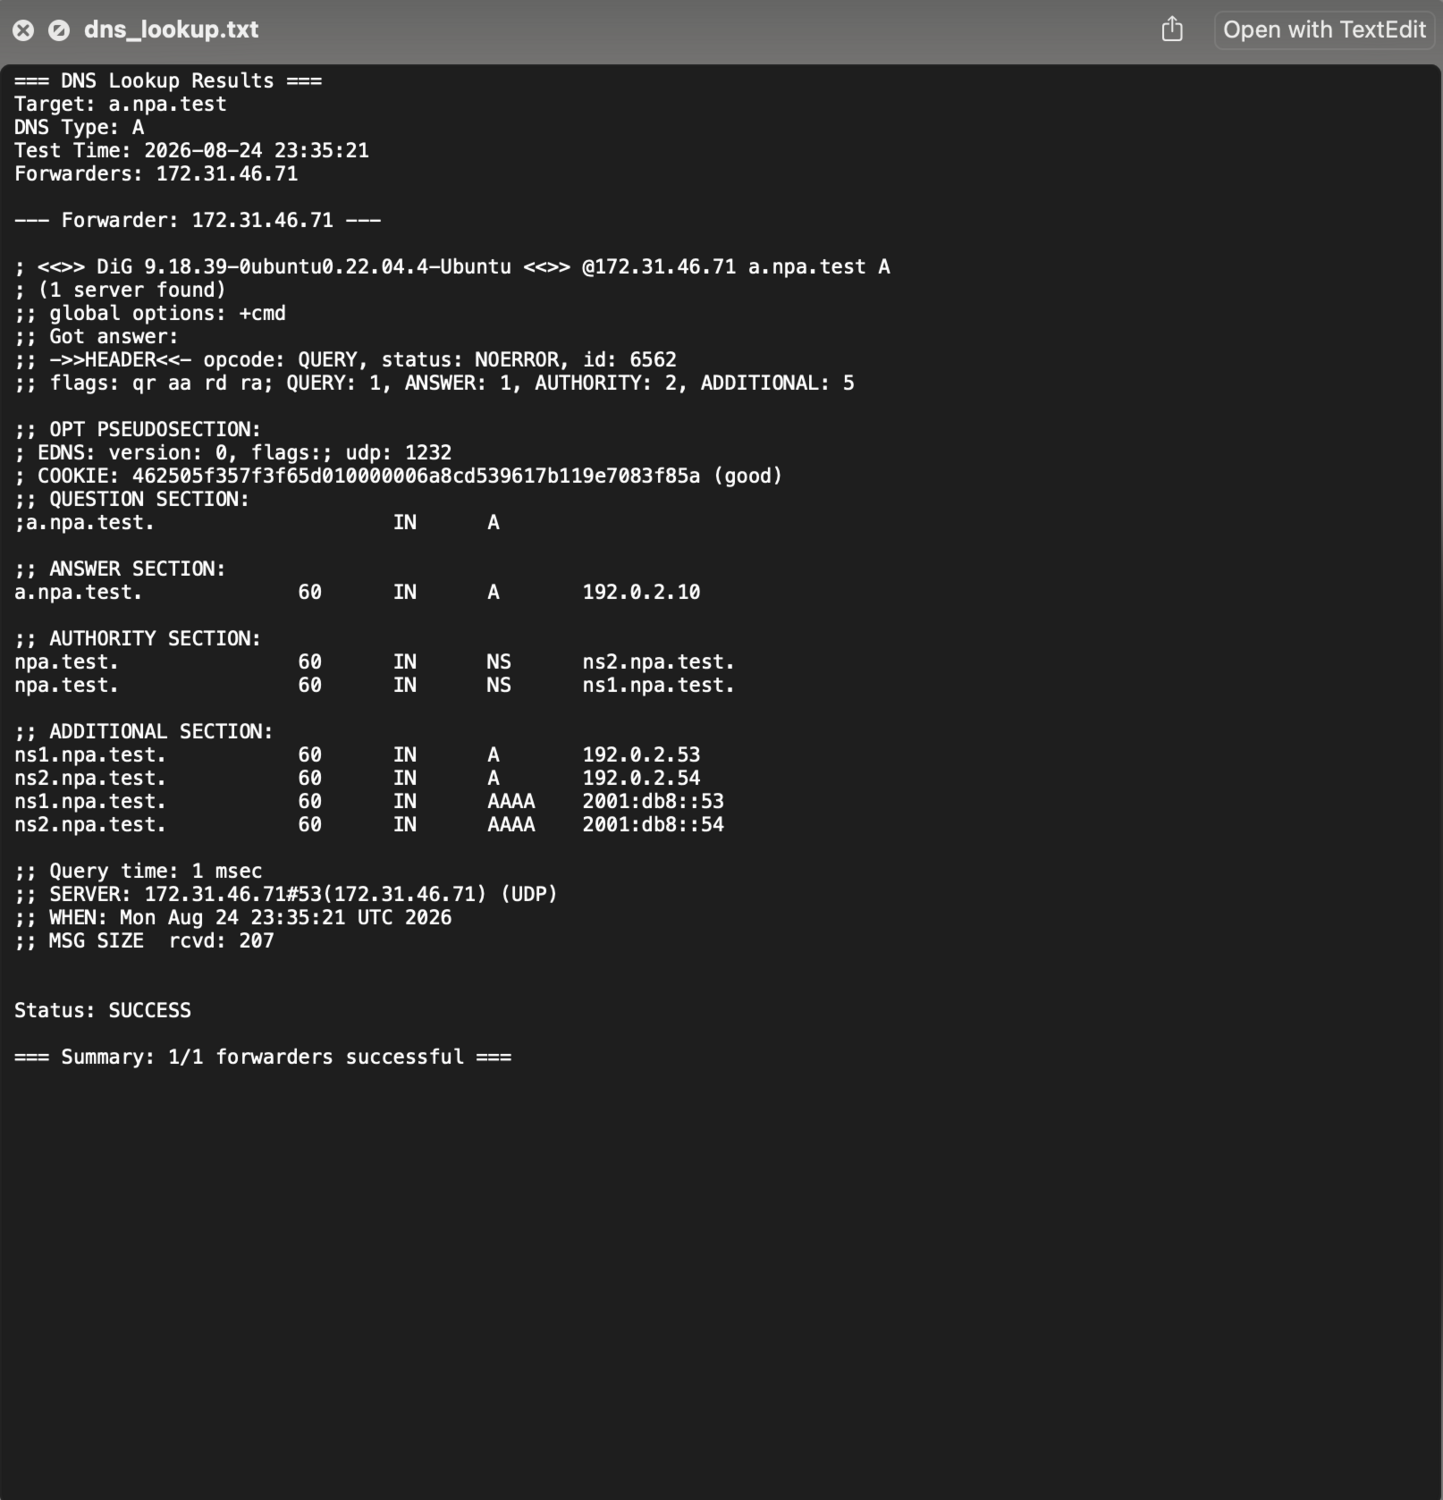
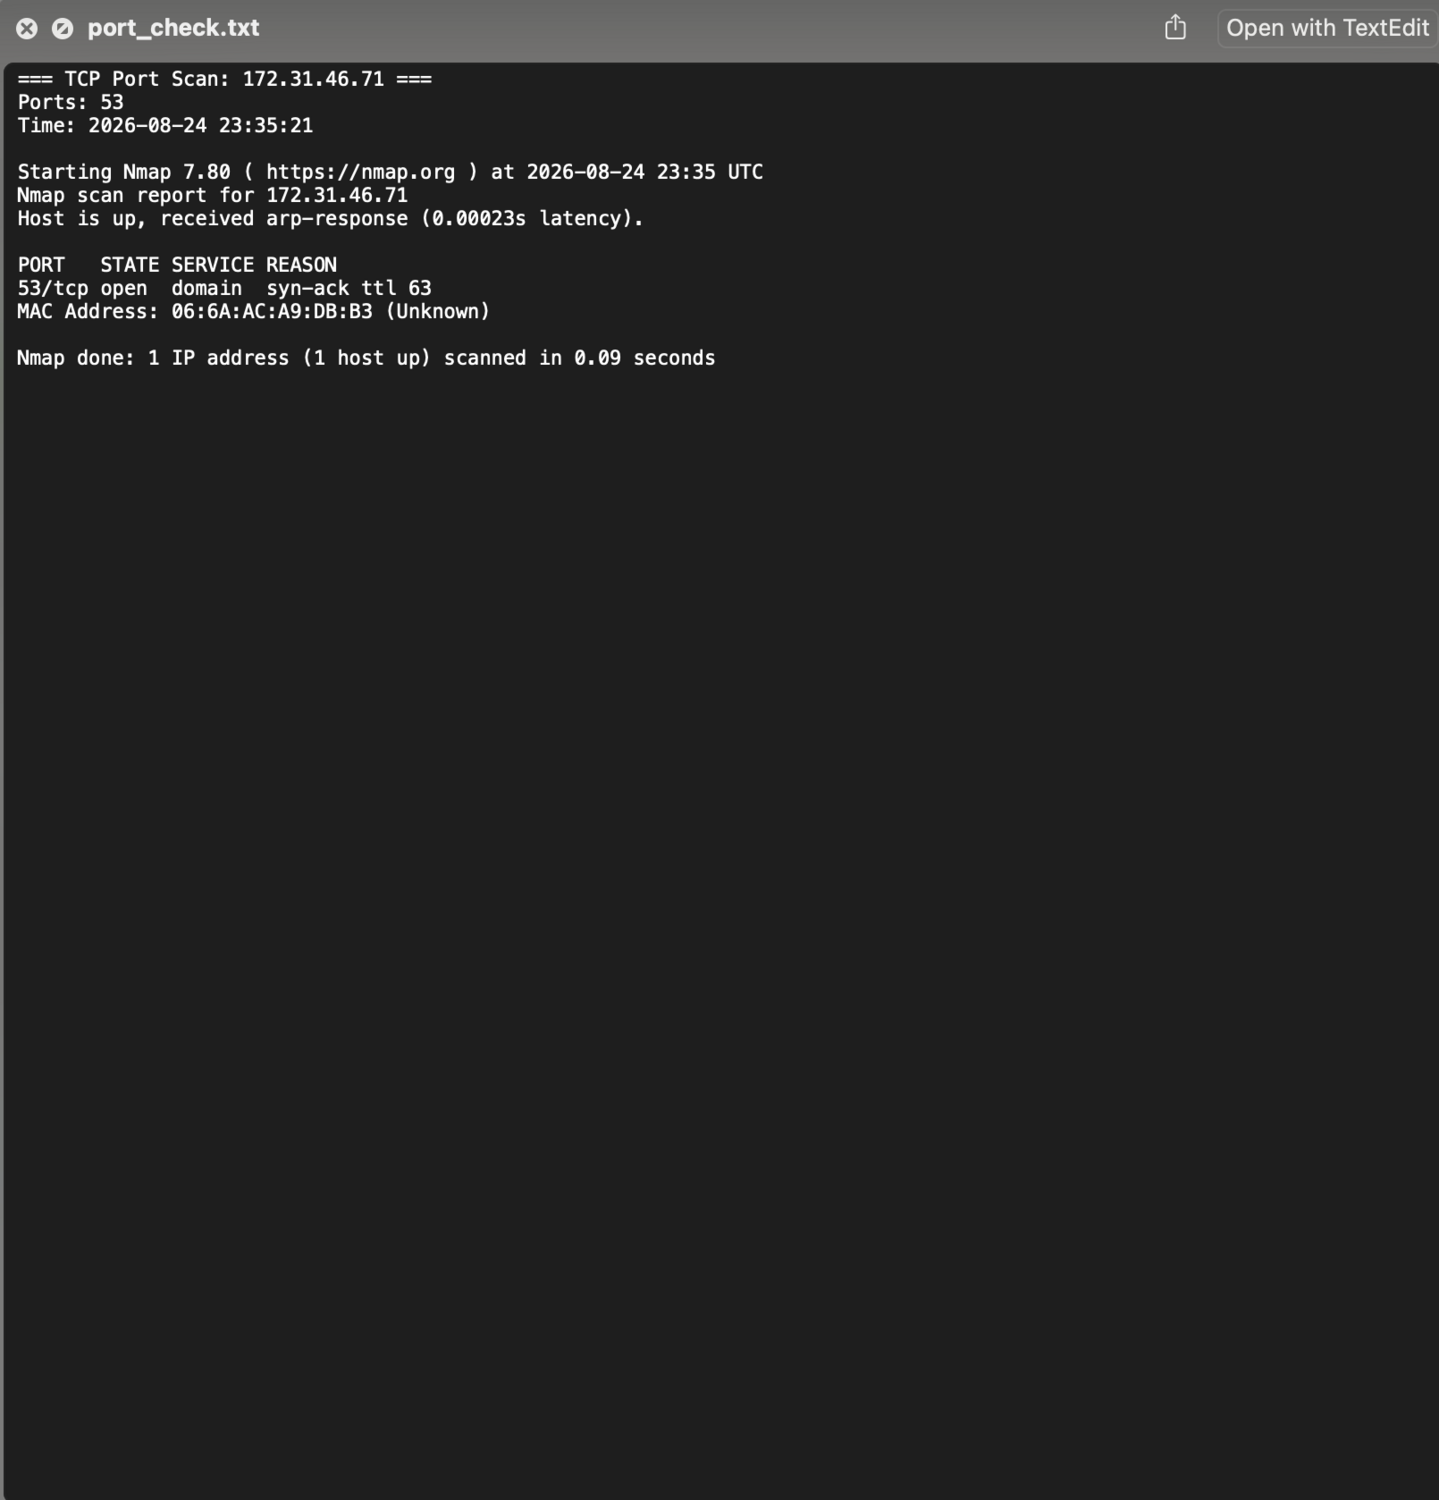
Each network test writes a plain-text result file under network-tests/. The examples below show a successful DNS lookup, a port scan, and a traceroute.
Notes and Limitations
- OS-level logs are excluded. The bundle contains predefined Publisher logs only, not host operating-system logs.
- Packet capture (PCAP / tcpdump) is not available through this customer-facing workflow.
- One collection at a time per Publisher. A new collection cannot start while one is already in progress for the same Publisher.
- Deletion is blocked during collection. A Publisher cannot be deleted while a log collection is in progress.
- No in-progress UI. The email notification is the signal that the bundle is ready; the UI does not poll for status.
- Retention: Collected bundles are retained for 7 days and then automatically deleted.
- Cooldown between collections. After a collection completes, you must wait 10 minutes before starting a new log collection on the same Publisher.
- Publishers only. Log collection is not supported on Local Brokers.