With P-DEM Enterprise enabled, all DEM-supported SaaS applications are automatically and proactively monitored through real user traffic analysis. It means that the end user experience score as well as application RTT are being computed and provided in the “User Overview” dashboard.
In addition to these applications, you can synthetically monitor any kind of web-based applications.
There are more than 80k applications in the Netskope CCI (Cloud Confidence Index) database. Any of these can be selected as a targeted monitored application.
If the application you want to monitor is not part of the provided list, then you can create your own.
A custom application is defined by a list of maximum three web targets.
When monitored from an NSClient, a custom application can be made up of three domains.
However, when monitored from an Enterprise Station, a custom application can include any URL, which makes it the ideal solution for monitoring specific web based API calls for example.
Custom Apps for NSClient
To access the custom application for NSClient configuration menu, click on the “Custom Apps” menu (1), then select the “Netskope Client” tab (2).
If you have previously created custom applications, they will appear in the table.
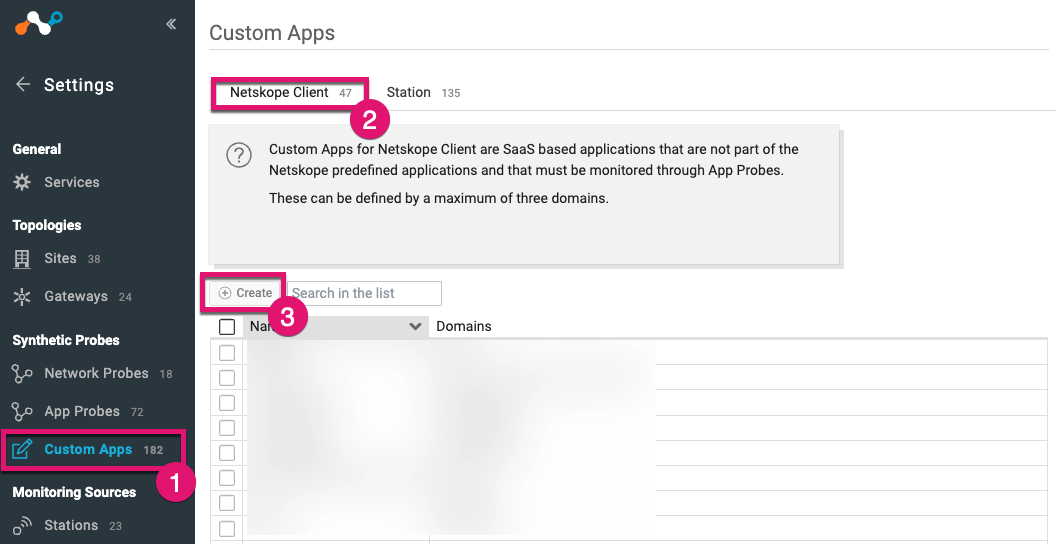
Click “Create” (3) to create a new custom application.
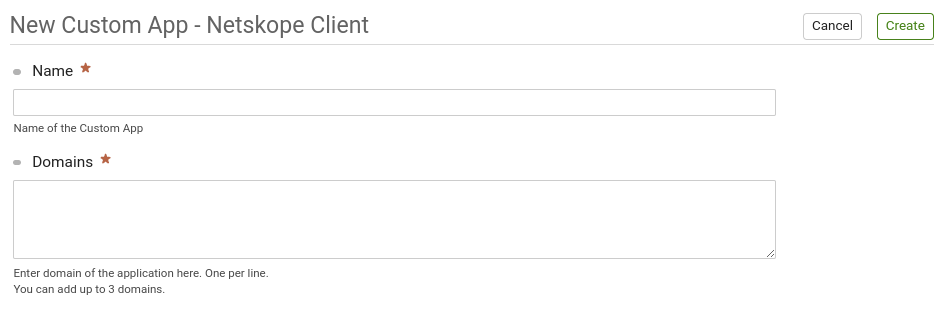
As previously mentioned, the definition of a custom application to monitor from NSClients can include up to three domains. In the “Domains” section, each domain must be filled in a separate line.
Custom Applications for Enterprise Station
In addition to targeting domains, the Enterprise Station is also able to test the reachability of any URL and provides advanced configuration options.
To access the custom application for Enterprise Station configuration menu, click on the “Custom Apps” menu (1), then select the “Netskope Station” tab (2).
If you have previously created custom applications, they will appear in the table.
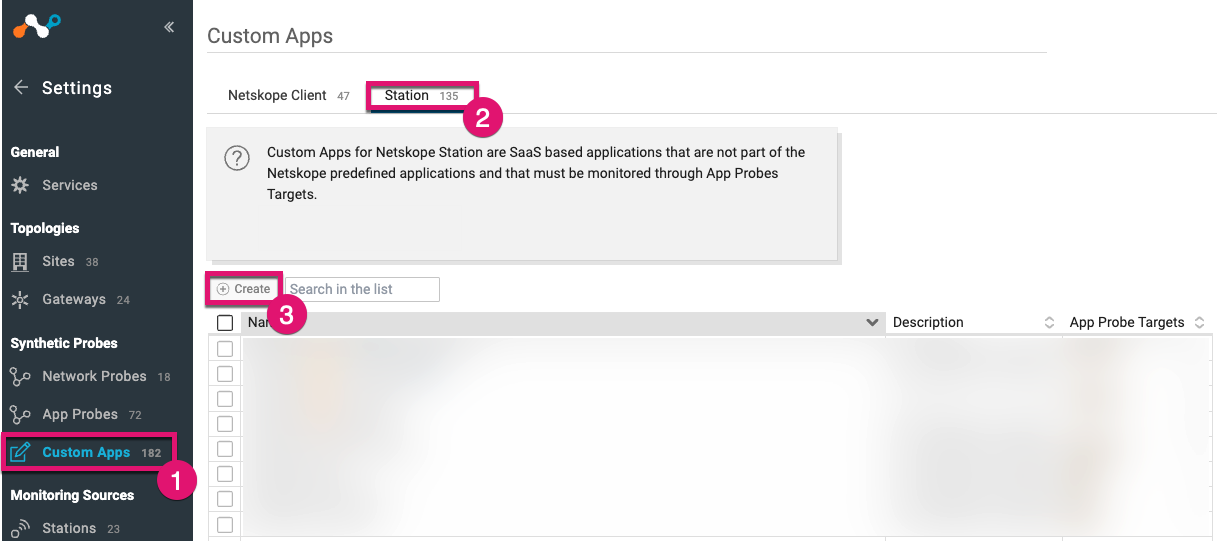
Each line corresponds to one custom application. For each application, you can see its name, description and number of URLs that have been specified to define the application.
Click “Create” (3) to create a new custom application.

Specify the name you want to use for this application (4). This name will be used in the different dashboards.
Click “Apply” (5) to create the application.
The custom application is now created but there is no synthetic test yet associated to it.
You can add “App Probe Targets” and “Network Probe Targets” from the custom application configuration view:

App Probe Targets
Click “Add” under “App Probe Targets” to configure App Probe targets.

Section 1: General
In the first section, you can configure:
| Parameter | Description |
| Name | Name of the target |
| Description | Description of the App Probe target (optional) |
| Method | HTTP method used to test the target.The supported methods are GET, POST, PUT, HEAD, DELETE, PATCH, OPTIONS, CONNECT and TRACE |
| Target URL | URL of the tested target. The URL can contain a domain name, an IPv4 or an IPv6 address. You can add a port in case the web service does not run on traditional ports like 443 (e.g. : https://www.netskope.com:4545) |
Section 2: Request
In the second section, you can configure:
| Parameter | Description |
| HTTP Redirect | By default, Netskope follows HTTP redirections.When disabled, the App Probe test analysis stops at the first server.In case of redirections, the response code is then like 301, 302, … |
| Headers | Optional headers can be added.For example, this can be useful when JWT (JSON Web Token) bearers are used for authentication, when you explicitly expect specific response format, or to activate some CORS (Cross-Origin Resource Sharing) headers. |
Section 3: Response
In the third section, you can configure:
| Parameter | Description |
| Expected Status | By default, Netskope expects a status code between 200 and 299.You can specify any status code (range) according to your specific requirements.If for an App Probe test, the Enterprise Station gets another response status code from the server, then the targeted web service will be considered unavailable and the response codes will be provided in the Application Details dashboard. |
Section 4: Advanced
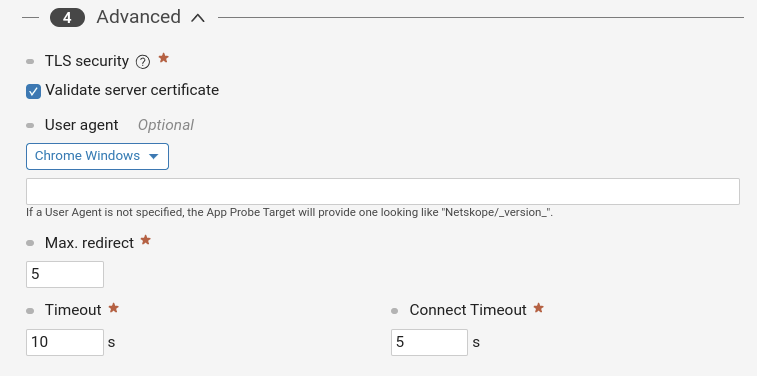
In the last section, you can configure:
| Parameter | Description |
| TLS security | By default, the App Probe test validates the server certificate.In case you want to test servers with embedded self-signed certificates, you may want to disable this option. |
| User agent | By default, the user agent for each App Probe test is like “Netskope/_version_”.Depending on potential constraints at the server level, you may change this.We provide prefilled user agents for Chrome Windows, Firefox Windows, Edge Windows and Safari MacOS. |
| Max. redirect | Maximum number of redirections before aborting the test.This would generate an error (type “Too many redirections”). |
| Timeout | Maximum number of seconds waiting for a server response before aborting the test and generating an error (type “Timeout”).The default value is set to 10 seconds. |
| Connect Timeout | Maximum number of seconds waiting for a server connection setup before aborting the test and generating an error (type “Connect”).The default value is set to 5 seconds. |
When you are done with the configuration, click on “Create an App Probe Target” .
You can see the newly created App Probe target in the list of the targets which are part of the currently created custom application:

You can delete, edit or copy the target configuration at any time by clicking on the corresponding pencil icon at the left side of its name.
Network Probe Targets
Click “Add” under “Network Probe Targets” to configure Network Probe targets.

Section 1: General
A Network Probe test is mainly defined by its name and the corresponding domain to target.
In this first section, specify the name of the Network Probe test to create (1).
Optionally, you can provide a description (2).
Section 2: Settings
This section allows you to configure the target itself.
Start by providing the domain to target (3). This can either be a hostname or an IP address.
Then select the method used by the Network Probe test (4). It can be either ICMP or UDP.
Please refer to this section for more details.
Finally, you can specify the IP protocol used to perform DNS resolution in case the specified target is a hostname (5). By default, this parameter is set to “Auto”. You can select either IPv4 or IPv6 instead.
Click on “Add” to confirm this Network Probe test configuration:
