

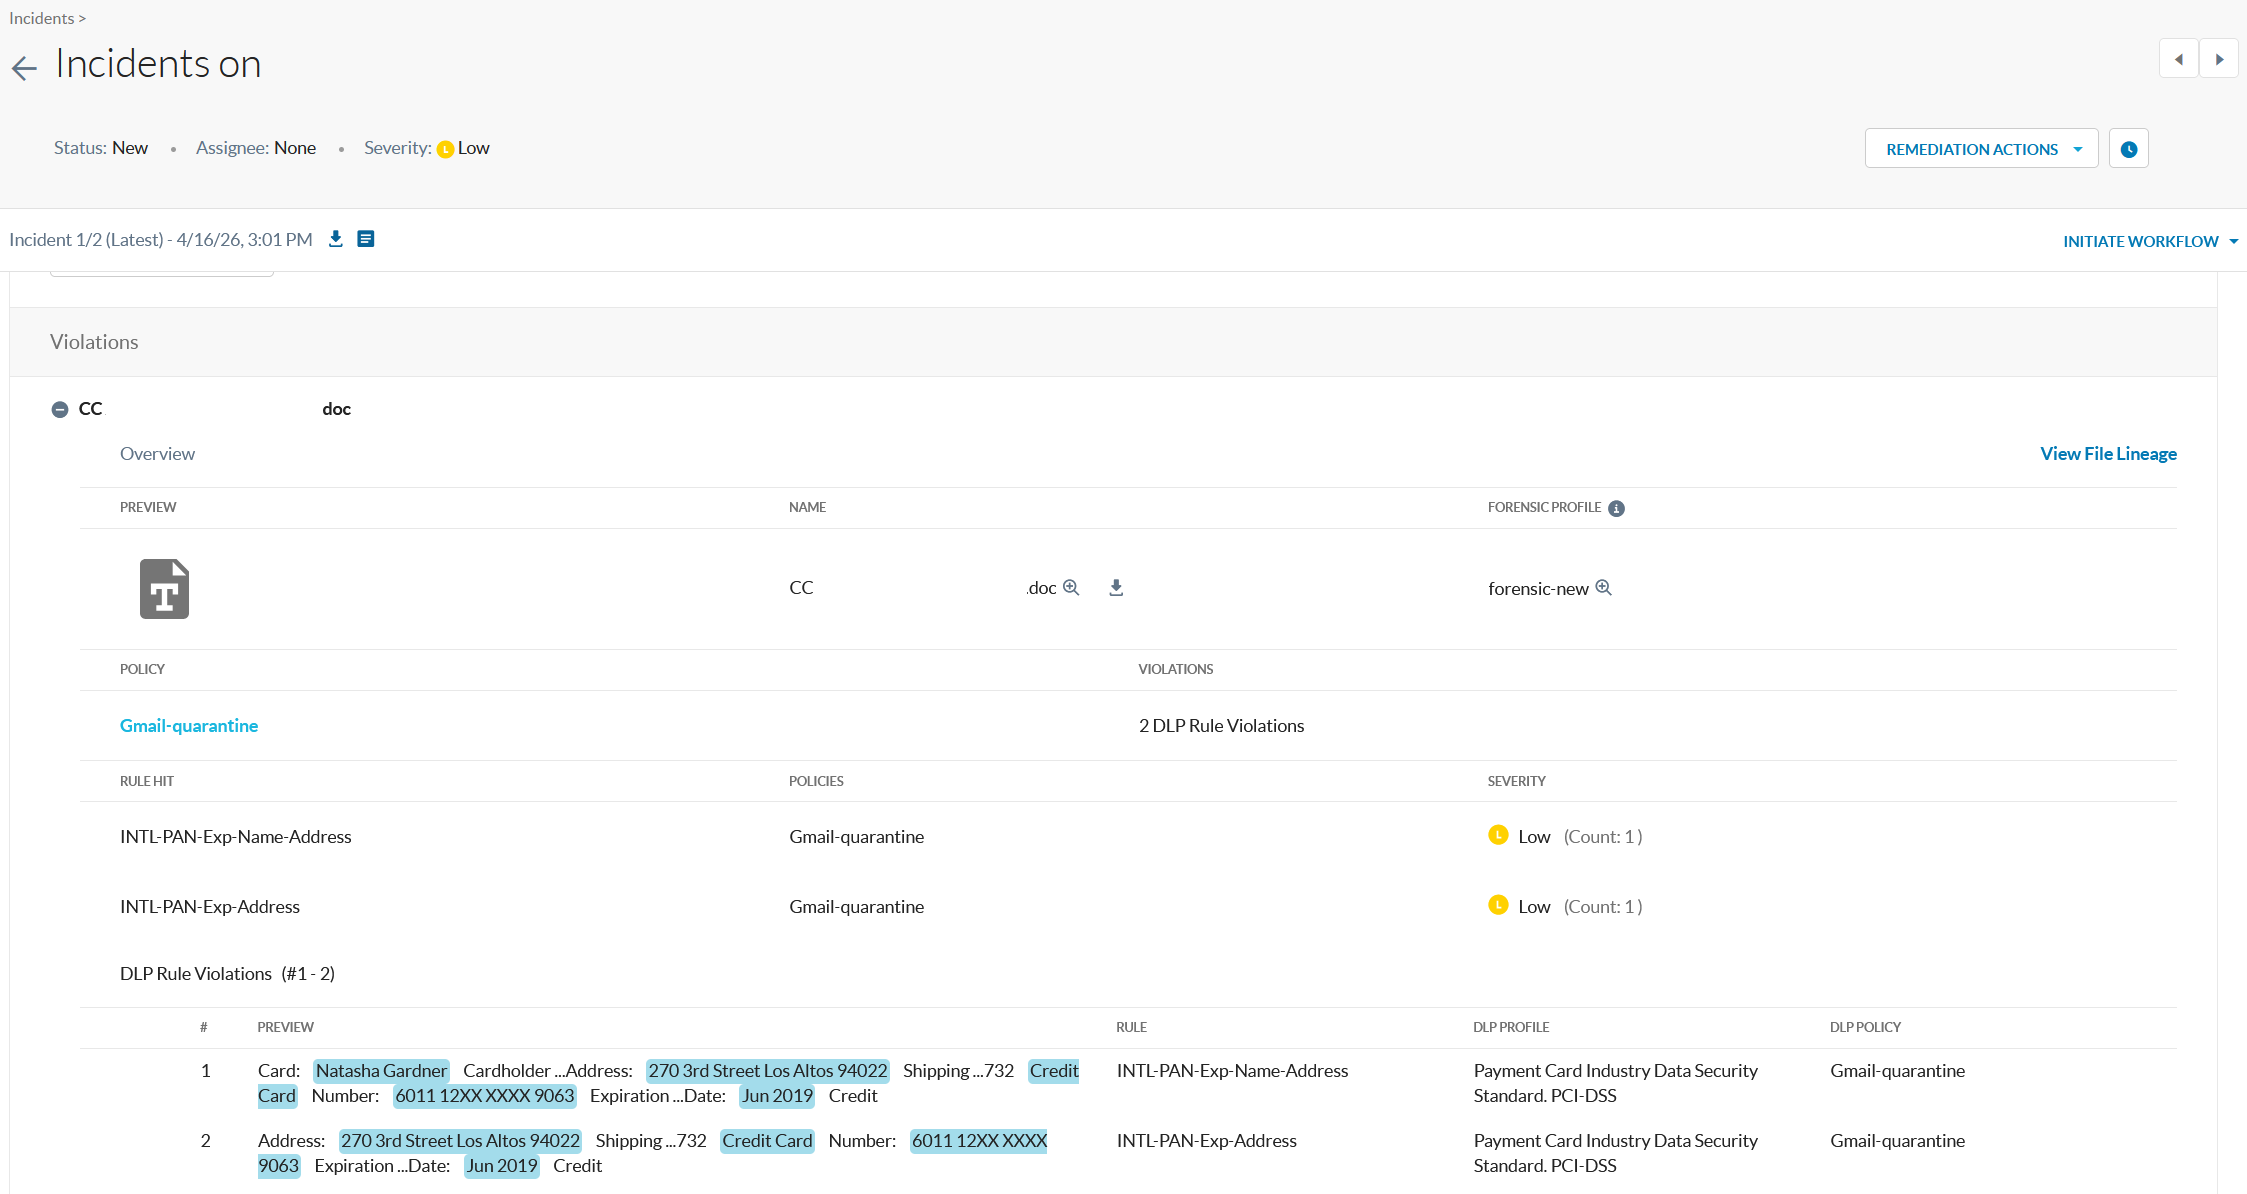
You can get to the data lineage graph by clicking View File Lineage on the associated Violation of a DLP Incident.
Graph View
Understanding the Lineage Investigation Path
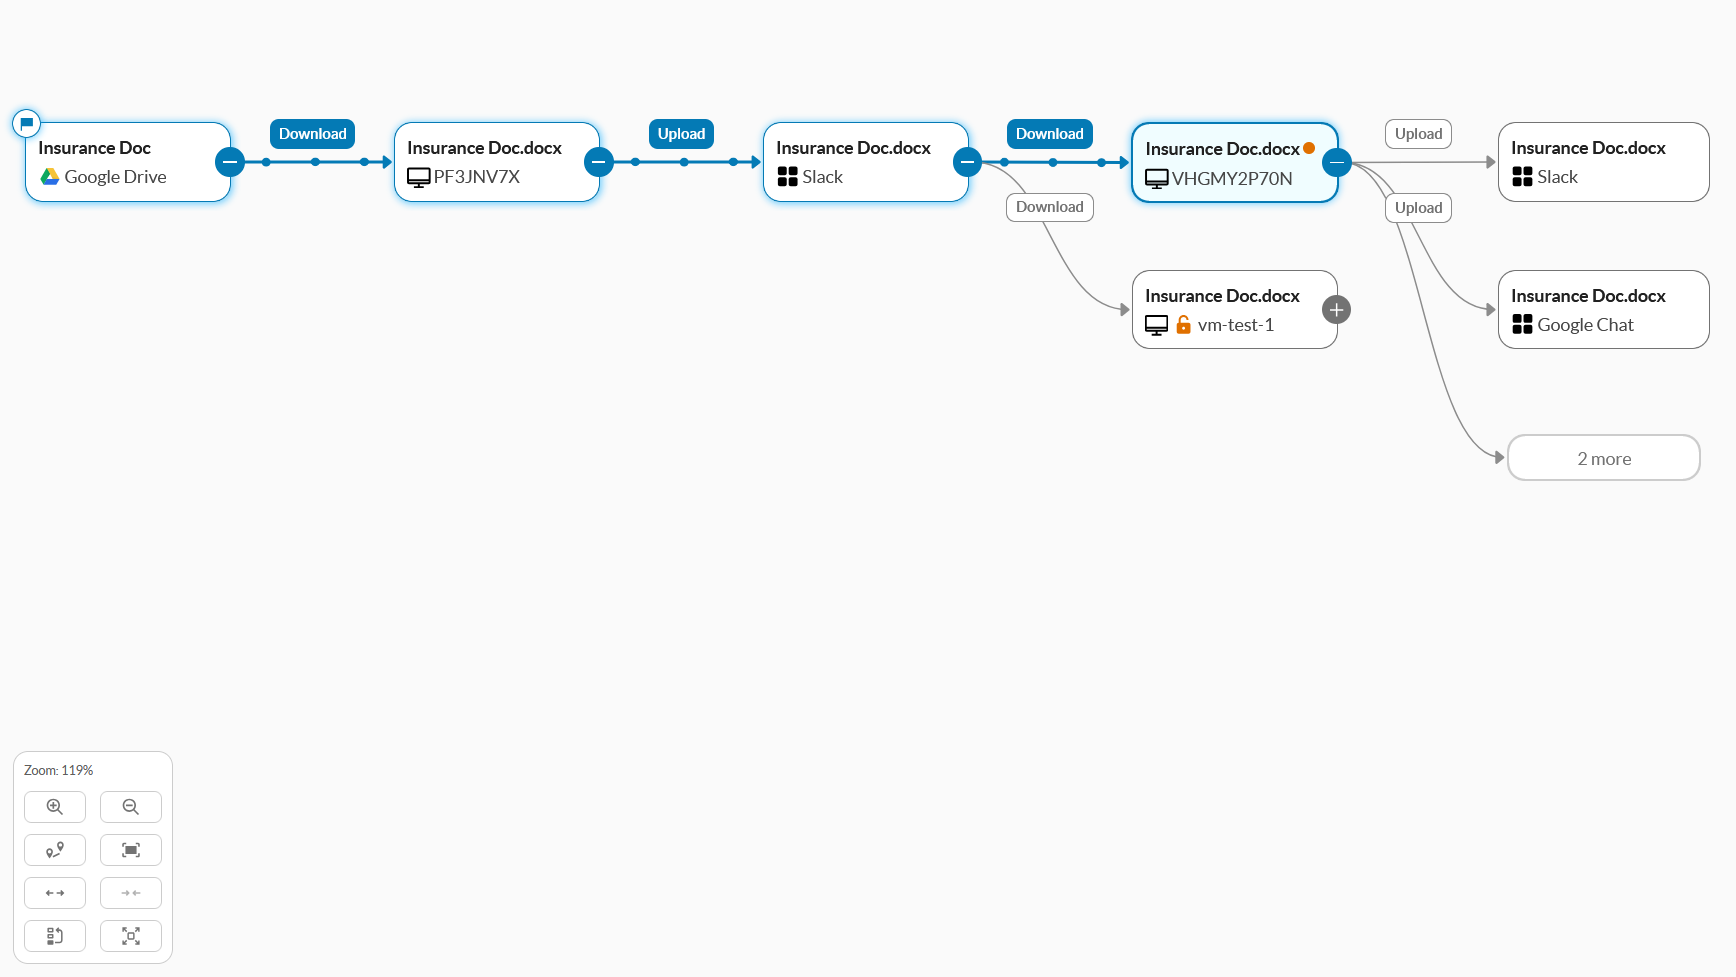
A thick blue line highlights the path from the origin file to the file currently under investigation. This visual path represents the sequence of related file activities that connect the origin to the selected file.
When a different file node is selected, the highlighted path updates automatically to reflect the lineage between the origin and the newly selected file.This allows investigators to quickly focus on the exact activity chain relevant to the file in question, without needing to manually trace connections across the full graph.
Within the Graph View:
- The full graph represents the file family, showing all related copies of the file. For example, when a file is downloaded from the cloud to an endpoint, 2 copies of the file. These files are related and will be tracked by Data Lineage.
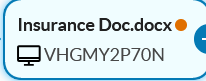
- Each node represents a file copy that’s sitting somewhere such as in the cloud, an endpoint, a public cloud, etc.
Potentially Related Activity
In some cases, the graph surfaces files that share metadata or behavioral similarity but are not linked by a direct lineage event. These connections appear as dotted lines between nodes, distinguishing them from the solid lines used for confirmed lineage connections.
Potentially Related Activity helps investigators see the broader context around a file, for example, files with similar names or matching hashes that may be part of the same workflow but were observed independently. This feature can be toggled on or off in the Settings dropdown. When turned off, only connections backed by a direct lineage event are shown. It is enabled by default.
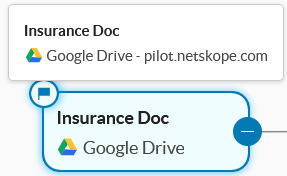
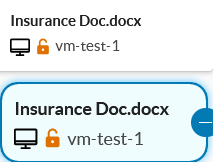
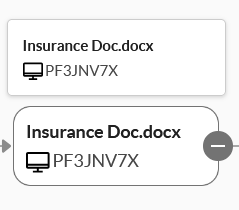
Hovering over nodes shows a tool tip that captures:
-
Storage location (for example, Google Drive or endpoint)
-
Instance name
-
Hostname
-
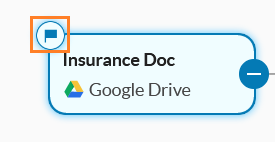
Flag icons represent an Origin file, which represents the first time Netskope observed the file.
-
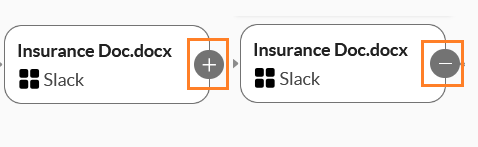
+/- icons represent files with derivatives and can be expanded or collapsed
-
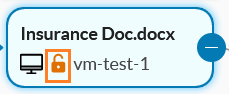
Unlocked icons represent files in an unmanaged location.
-
Orange dots represent files where a policy action was taken on the file when the action was evaluated.
Timeline View
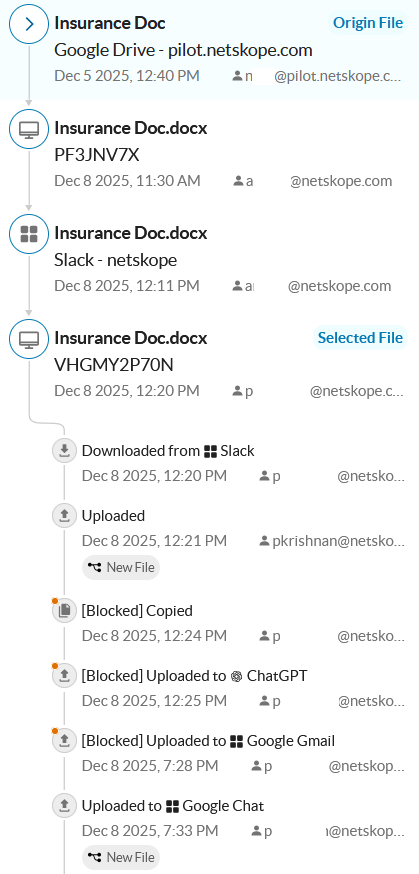
The Timeline View displays a chronological timeline showing the path from the origin file to the selected file. The timeline view provides detailed activity context that complements the visual graph. It helps identify actions that occurred before data movement, such as edits or renames prior to an upload, as well as blocked transactions that did not result in new file creation.
For each file node, you can:
- View file details such as owner, location, and instance information
- Expand the file node to see all recorded activities associated with that file
This includes not only data movement, but also all versions of that specific file:
- File creation
- Edits
- Renames
- Shares
Metadata View
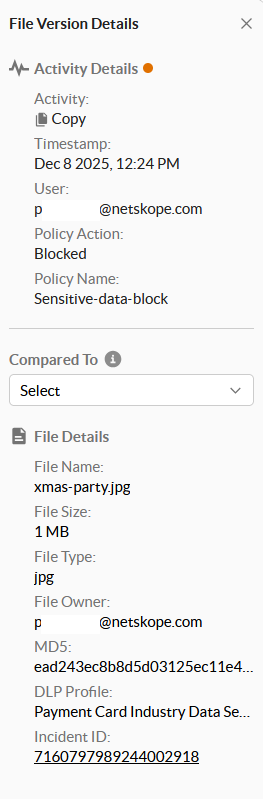
The metadata view displays detailed information for the currently selected file version.
When a file version is selected, the panel shows attributes such as file name, hash value (for example, MD5), file size, and other metadata. If a policy action or incident was triggered for that transaction, the associated policy details are also displayed.
This panel provides immediate investigative context without requiring navigation away from the timeline. It also includes a compare capability, allowing investigators to select an earlier file version within the same file node and compare metadata side by side. Changes such as modified hashes, file names, or file sizes can be quickly identified without leaving the view.
Control Panel
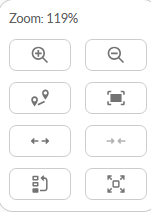
The control panel allows investigators to adjust and customize the graph view.
Capabilities include:
- Zoom in and zoom out
- Fit the investigation path within the canvas
- Fit the entire graph within the canvas
- Expand all file nodes
- Collapse all file nodes
- Reposition the investigation path to the top of the graph
- Toggle full screen view
These controls allow investigators to tailor the visualization based on the scope and focus of their investigation.