This document explains how to configure the Datadog v1.1.0 plugin with the Log Shipper module of the Netskope Cloud Exchange platform. This plugin supports the ingestion of Alerts (DLP, Malware, Policy, Compromised Credential, Malsite, Quarantine, Remediation, Security Assessment, Watchlist, UBA, and CTEP), Events (Page, Application, Audit, Infrastructure, Network, Incident, and Endpoint), WebTx(via Netskope LogStreaming), and Logs (Debug, Information, Error, and Warning) into the Datadog platform. It supports the ingestion of logs in both JSON and CEF formats.
Prerequisites
To complete this configuration, you need:
- A Netskope tenant (or multiple, for example, production and development/test instances).
- A Netskope Cloud Exchange tenant with the Tenant plugin and Log Shipper plugin already configured.
- A Netskope Cloud Exchange tenant with the AWS Netskope Log Streaming or Azure Netskope Log Streaming plugin already configured (for pulling WebTx from the Netskope Log Streaming plugins).
- A Netskope Cloud Exchange tenant with the Syslog for CE plugin already configured (for pulling CE Logs).
- Datadog Platform access with the Datadog Agent installed.
- Connectivity to the following hosts (any of these)
- https://app.datadoghq.com
- https://us3.datadoghq.com
- https://us5.datadoghq.com
- https://app.datadoghq.eu
- https://app.ddog-gov.com
- https://ap1.datadoghq.com
Datadog Plugin Support
Datadog plugin is used to ingest all the Alert, Events, CE Logs and WebTx[via Netskope LogStreaming] logs in CEF and JSON format.
| Data Type | Support |
|---|---|
| Alerts | Yes. DLP, Malware, Policy, Compromised Credentials, Malsite, Quarantine, Remediation, Security Assessment, Watchlist, CTEP, UBA |
| Event | Yes. Audit, Application, Infrastructure, Network, Incident, Page, Endpoint |
| WebTx | Yes (Compressed) (via Netskope LogStreaming) |
| Syslog CE Logs | Yes. Info, Error, Warning, Debug |
Note
- CLS WebTX based on Google Pub Sub Lite is deprecated. Please refer to Netskope Product EOL/EOS Announcements – Netskope Knowledge Portal
- For ingesting WebTX logs to your Log delivery destinations like SIEM, SOAR, XDR, Data Lake, use the AWS Netskope Log Streaming or Azure Netskope Log Streaming plugin.
Permissions
Permission to generate an API Key in Datadog.
API Details
List of APIs used
| API Endpoint | Method | Use Case |
|---|---|---|
| https://http-intake.logs.datadoghq.com/api/v2/logs | POST | Send Logs to the Datadog Platform |
Send Logs
API Endpoint: https://http-intake.logs.datadoghq.<Datadog site>/api/v2/logs
Method: POST
Headers:
| Key | Value |
|---|---|
| Content-Type | application/json |
| Accept | application/json |
| Content-Encoding | gzip(Only for WebTX[via Netskope LogStreaming] logs) |
| DD-API-KEY | <API Key> |
| User-Agent | netskope-ce-5.1.0-cls-datadog-v1.1.0 |
Parameters:
| Key | Value |
|---|---|
| ddsource | netskope-ce |
| ddtags | netskopelogs,alerts |
Request Body:
[{'message': '{"cci": 43, "timestamp": 1708515322000, "ccl": "poor", “ce_tenant_name”: “Plugins”}'}]
Sample API Response:
202 Accepted
Performance Matrix
This performance reading is conducted on a Large Stack CE with these VM specifications. These readings are noted with the consideration that it will ingest around 10K events in 10 seconds to the Datadog platform.
| Description | Specification |
|---|---|
| Stack details | Size: Large RAM: 32 GB CPU: 16 Cores |
| Alerts/Events ingested to SIEM | ~200k EPM |
User Agent
The user-agent added in this plugin is in the following format
netskope-ce-<ce_version>-<module>-<plugin_name>-v<plugin_version>
For example:
netskope-ce-5.1.0-cls-datadog-v1.1.0
Workflow
- Get your Datadog API Key.
- Configure the Datadog Plugin.
- Configure a Business Rule for the Datadog Plugin.
- Configure Log Delivery for the Datadog plugin.
- Validate the Datadog plugin.
Click play to watch a video.
Get your Datadog API Key
- Log in to your machine where the Datadog Agent is installed.
- Go to your Datadog agent directory as per your OS (https://docs.datadoghq.com/agent/?tab=Linux)
- Open datadog.yaml file.
- Change to logs_enabled: true.

- Based on your OS flavor, you need to restart your Datadog Agent.(https://docs.datadoghq.com/agent/?tab=Linux)

- Log in to Datadog Platform.

- Hover on your username from the bottom Left corner.

- Click Organization Settings.

- Under Access click API Keys.

- Click on the API Key, and then click Copy to copy the key.

Configure the Datadog Plugin
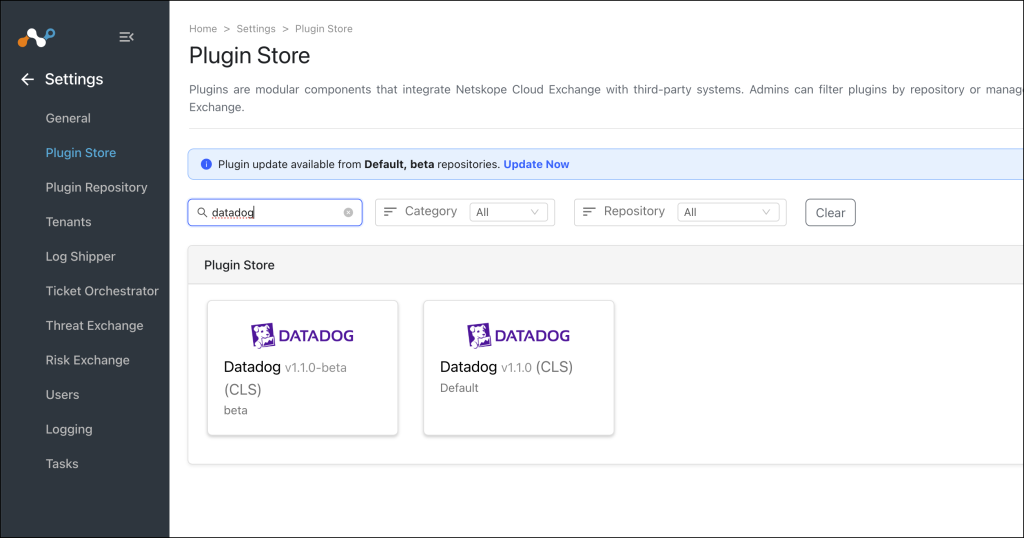
- Go to Settings > Plugin Store. Search for and select the CLS Datadog v1.1.0 (CLS) plugin.
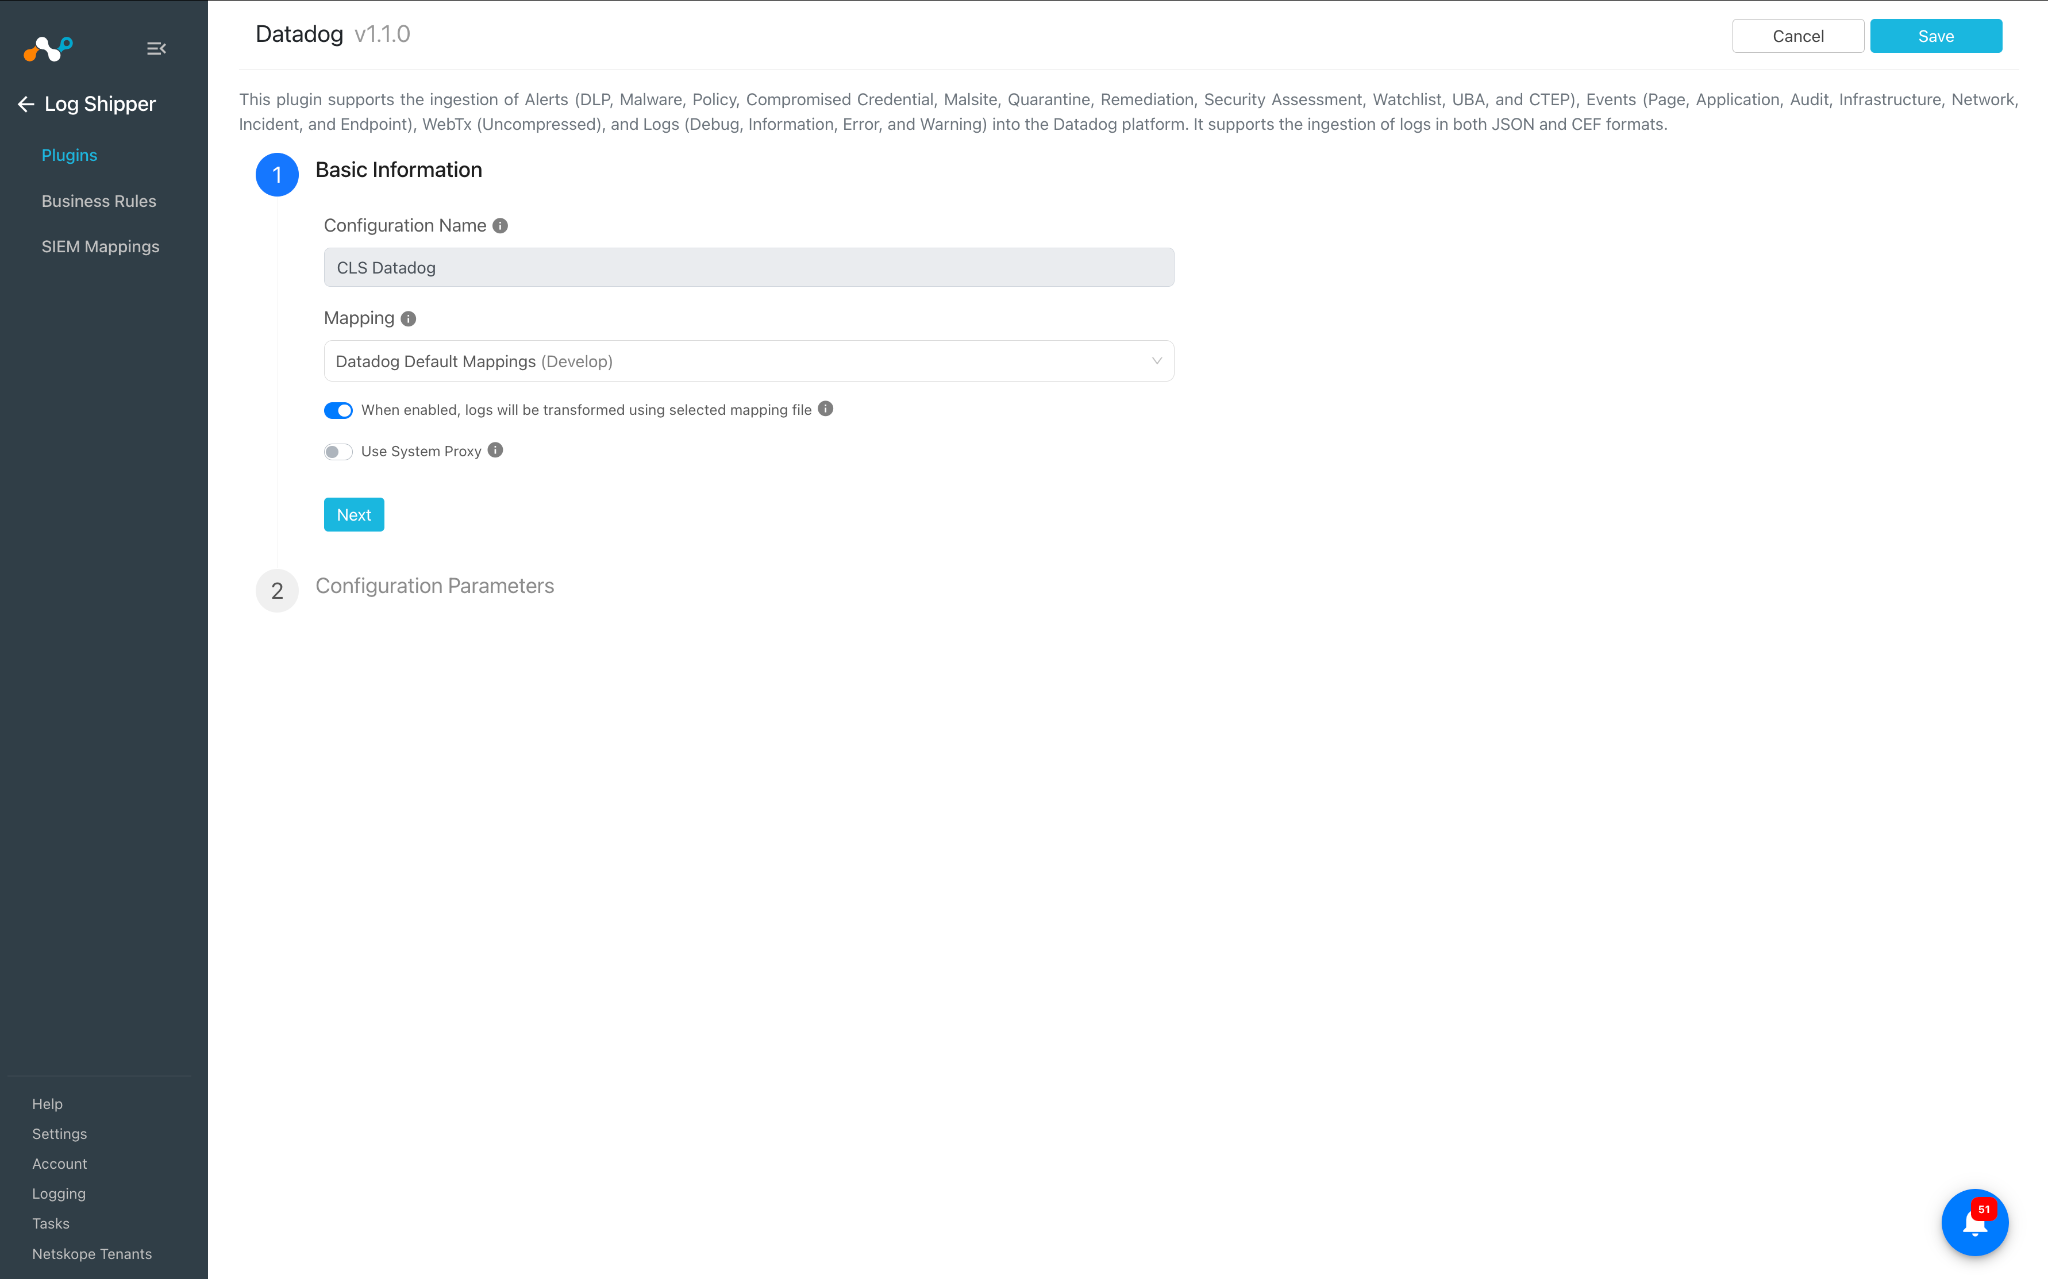
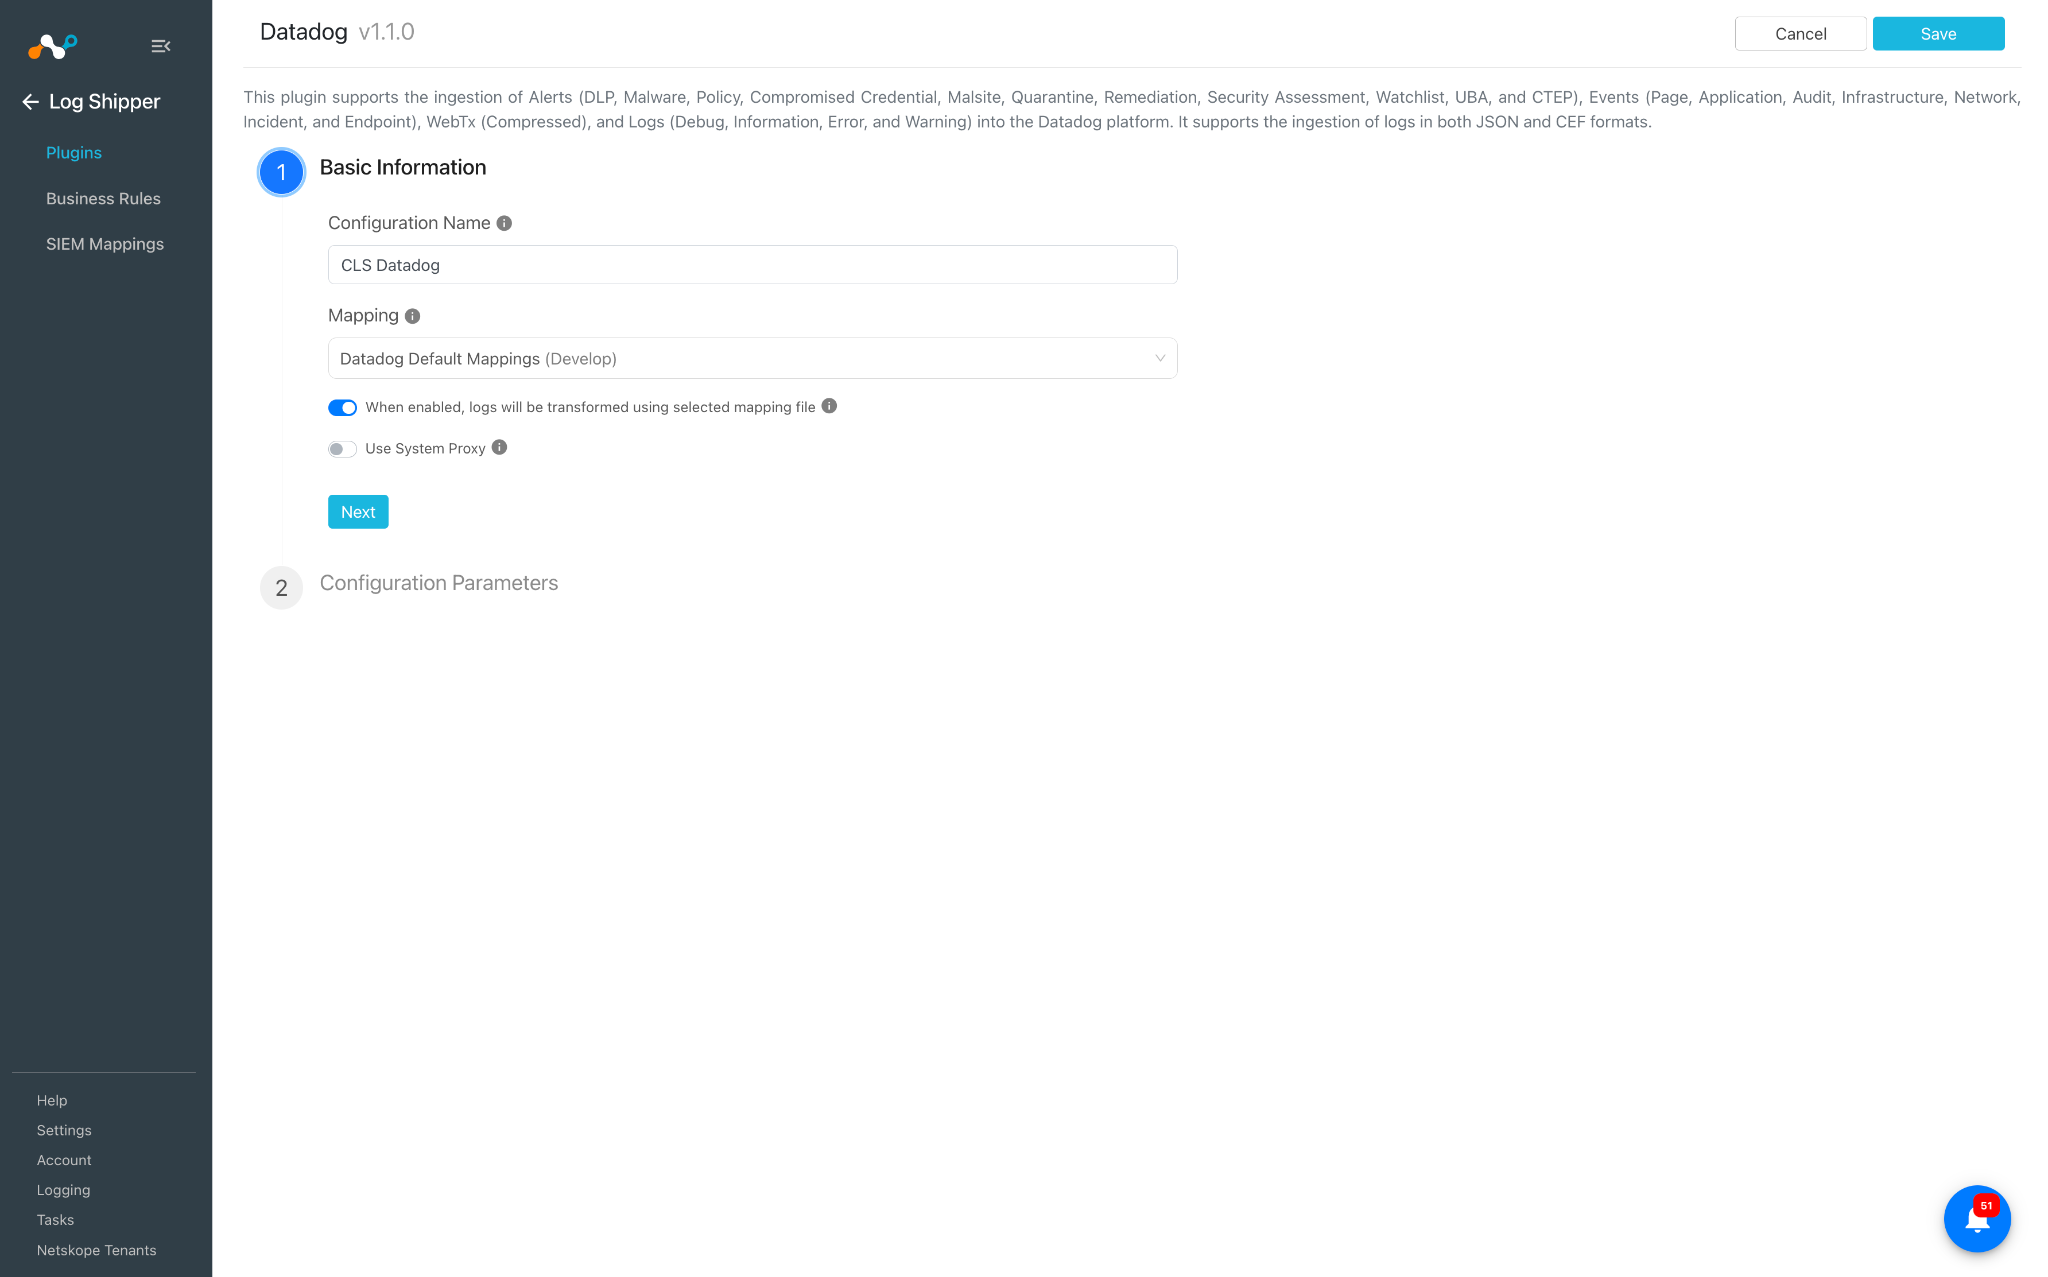
- Add a plugin configuration name and make sure the Datadog Default Mapping file is selected for Mapping.
- Disable the toggle button to transform the logs if you want to ingest the data in JSON format; keep it enabled if you want to ingest the data in CEF format.
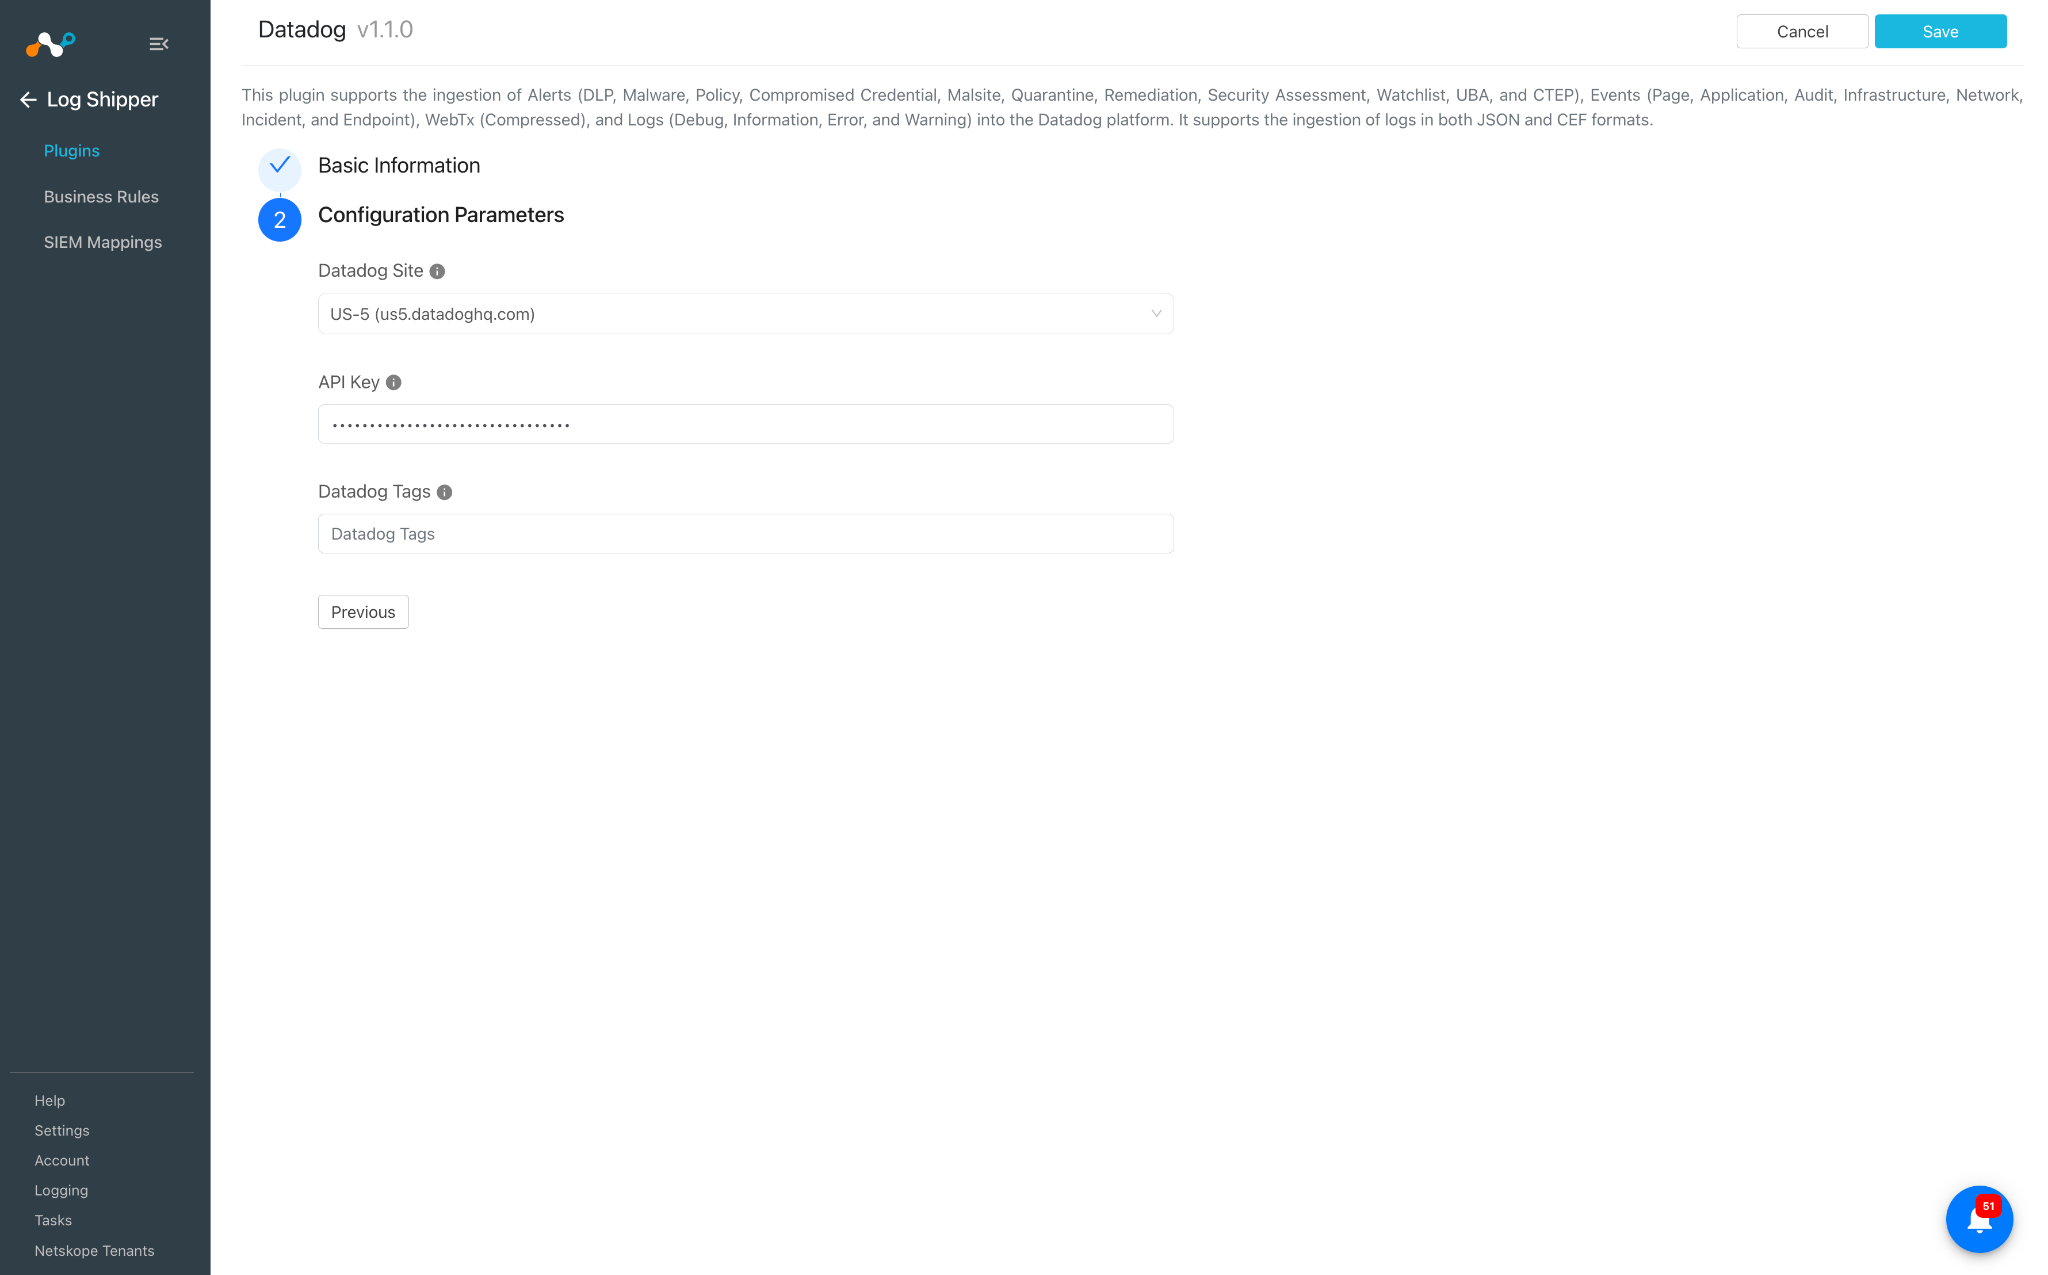
- Click Next and enter these parameters:
- Datadog Site: The site associated with your Datadog account. For example: datadoghq.com.
- API Key: An API Key is required by the Datadog Agent to submit metrics and events to Datadog. Provide the Datadog API Key obtained previously (from Organization Settings > Access > API Keys on the Datadog platform.
- Datadog Tags: Tags associated with your logs. To add multiple tags, provide them as comma-separated values. For example: env:prod,region:us-east-1.
- Click Save. The new plugin will be seen on the Log Shipper > Plugins page.

Configure a Log Shipper Business Rule for Datadog
- Go to Log Shipper > Business Rules.
- By default, there is a business rule that filters all alerts and events.
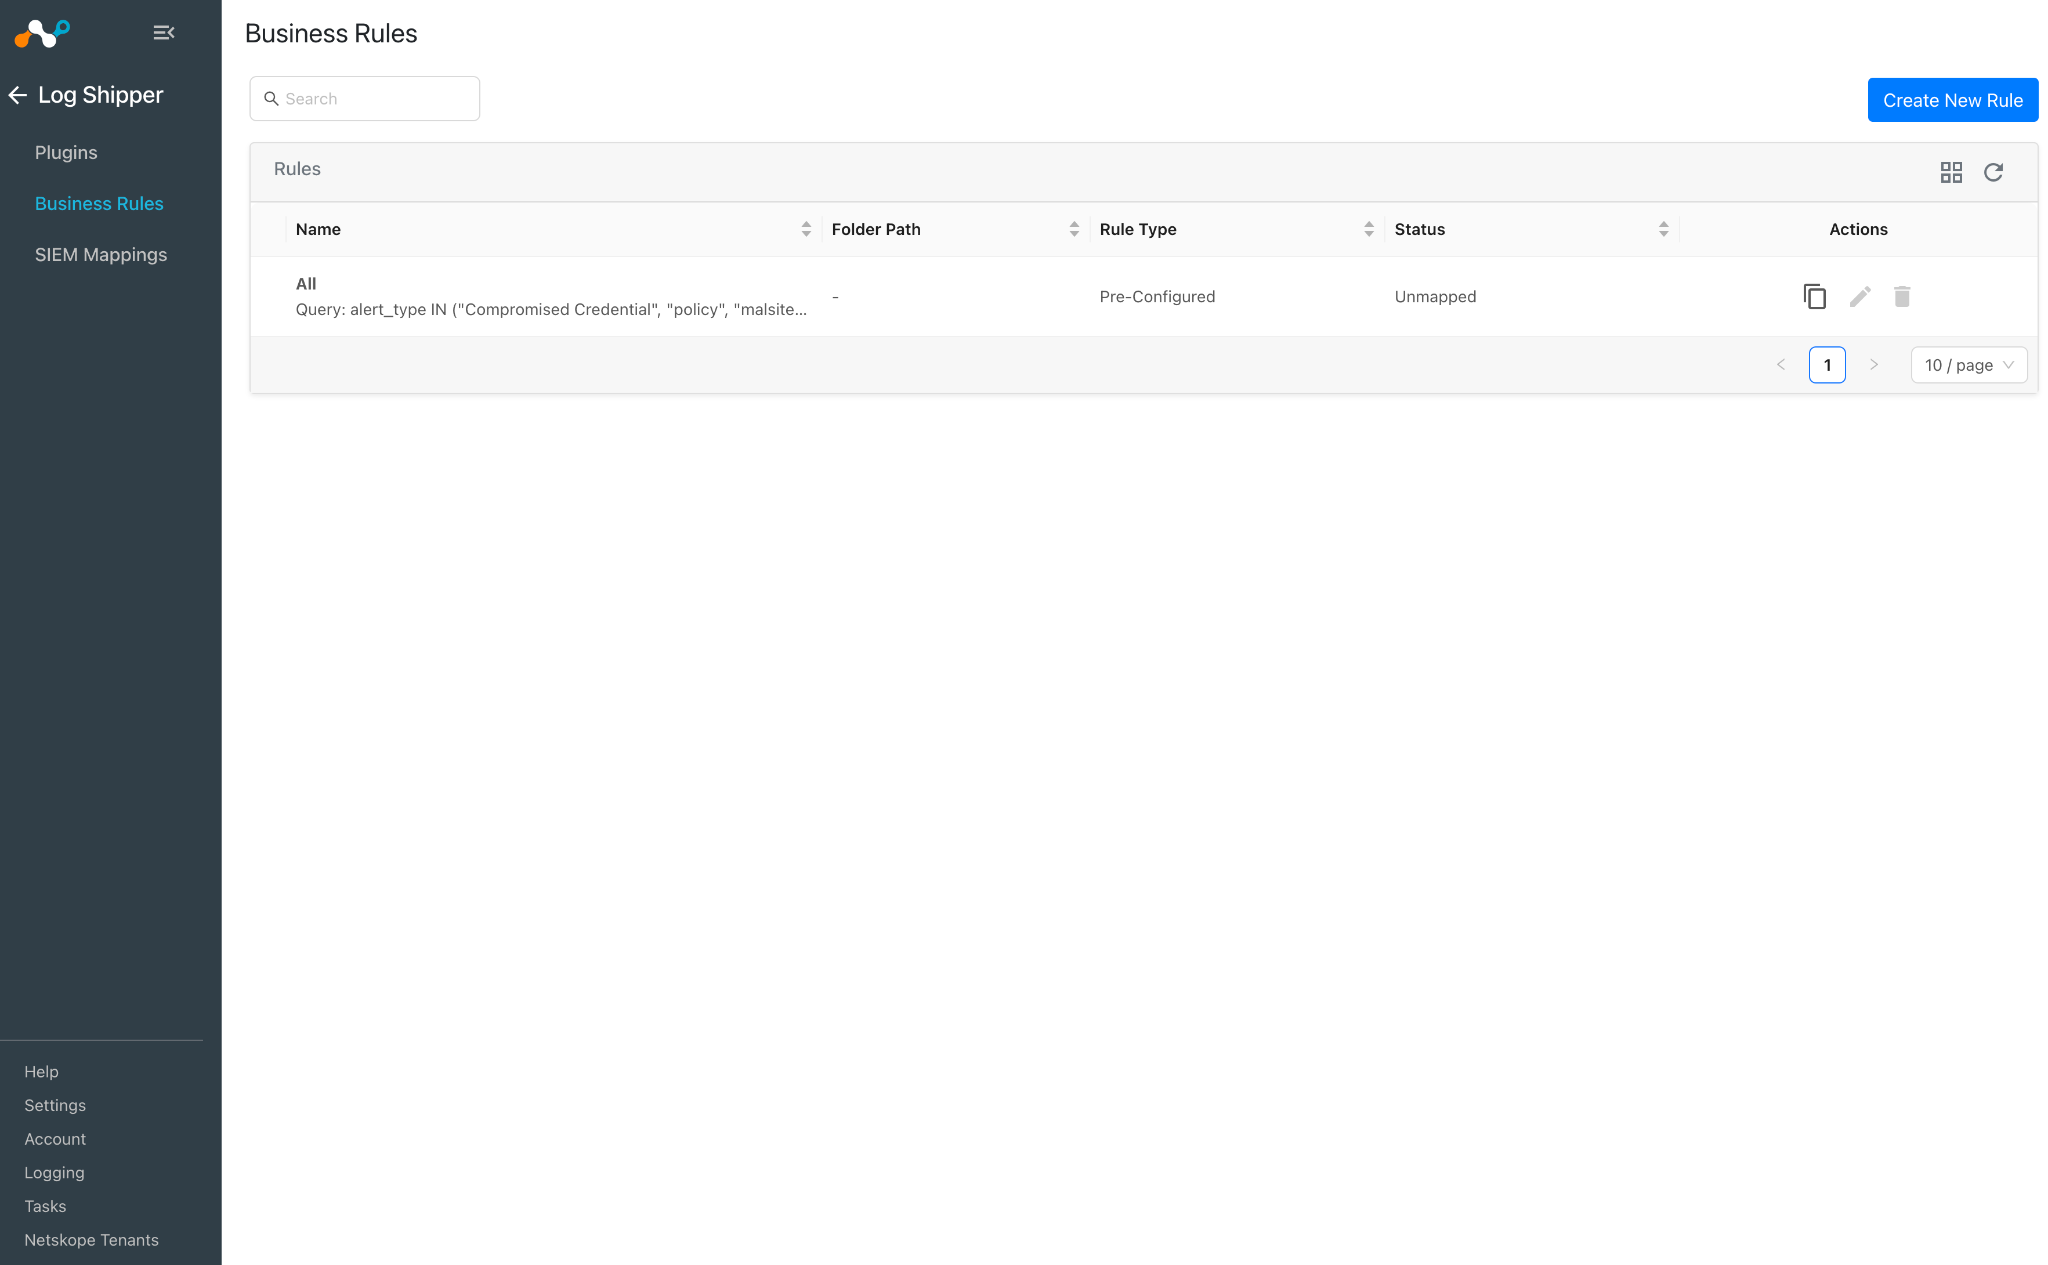
- If you want to filter out any specific type of alert or event, click Create New Rule and configure a new business rule by adding the rule name and filter.
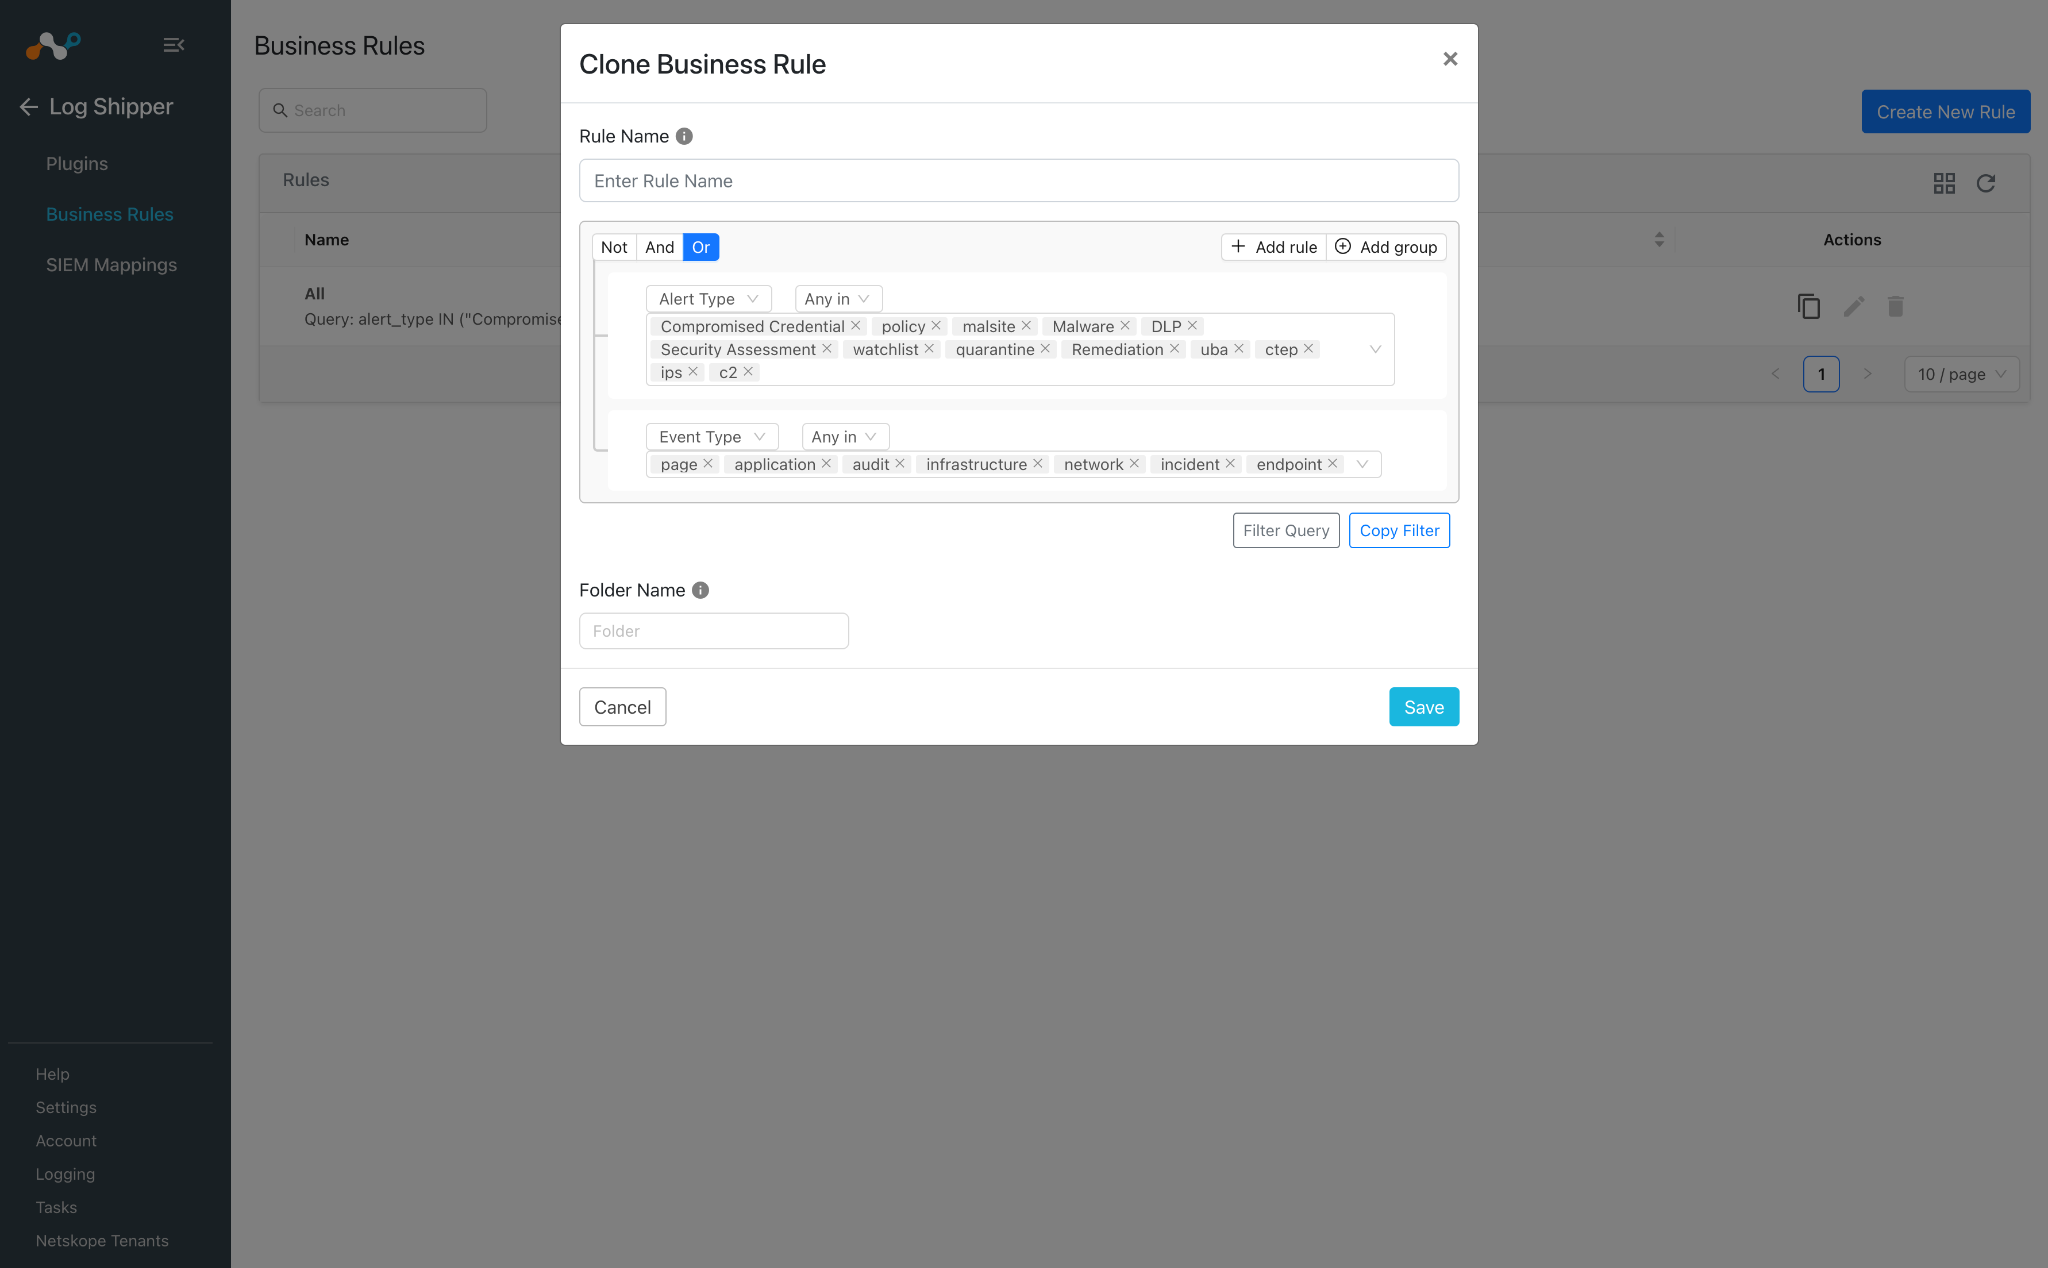
- Click Save.
Configure Log Shipper Log Delivery for Datadog
- Go to Log Shipper > Log Delivery and click Add Log Delivery Configuration.
- For alerts and events, select the Source plugin (Netskope CLS), Destination plugin (Datadog), a business rule, and then click Save.
- For WebTX select Source plugin (AWS Netskope Logstreaming or Azure Netskope Logstreaming), Destination plugin (CLS Datadog), a business rule, and then click Save.
- For log sharing, select Source plugin (Syslog for CE) and Destination plugin (Datadog), a business rule, and then click Save.
- After the Log Delivery configuration is added, the data will start to be pulled from the Netskope tenant, transformed, and ingested into the Datadog platform.
Validate the Datadog Plugin
Validate the Pull
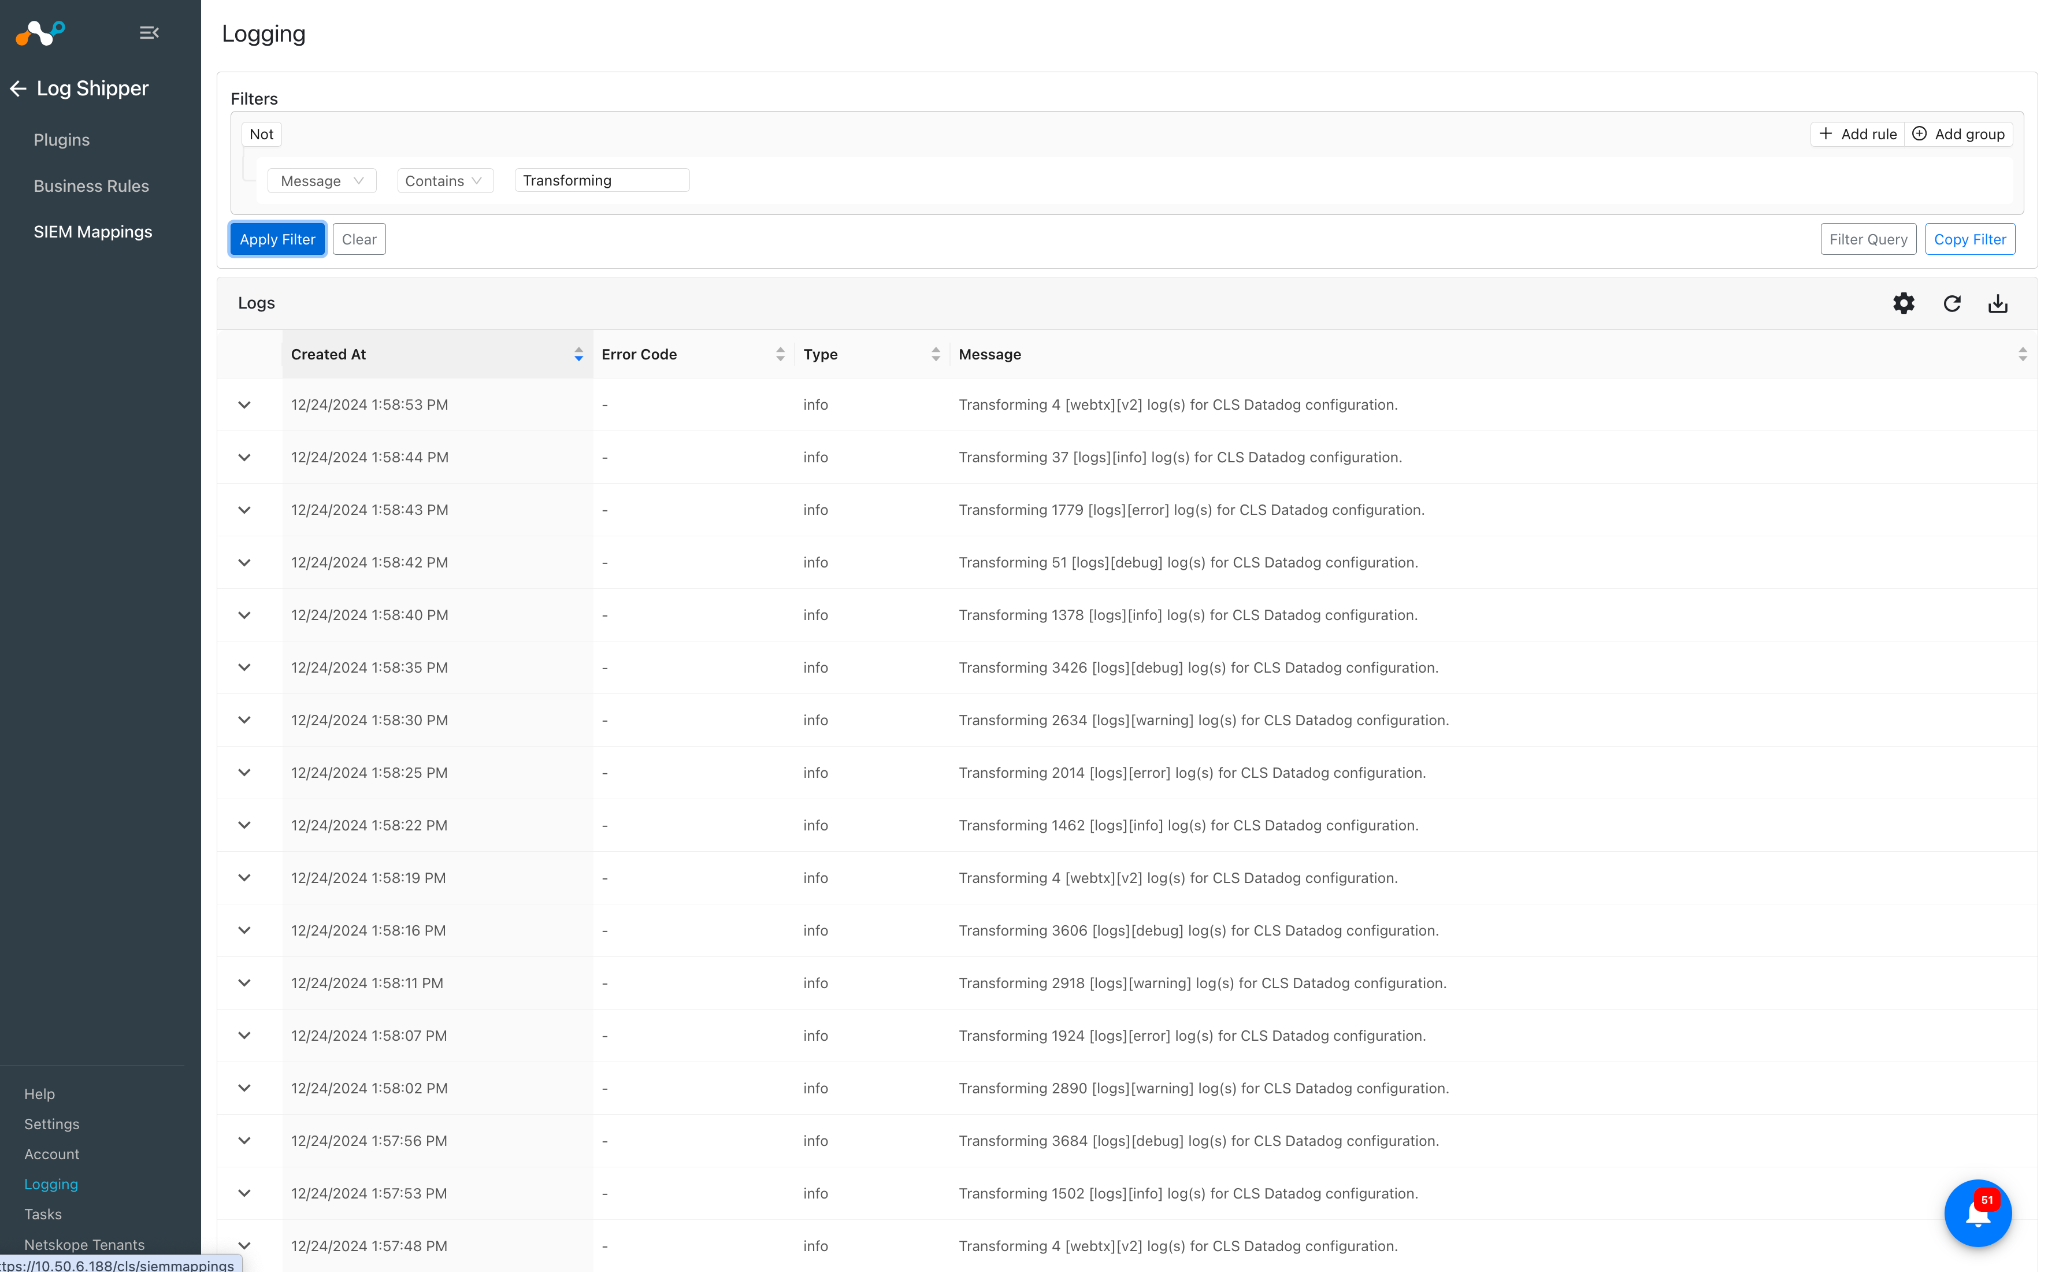
To validate the pulling of Events, Alerts, logs, and Webtx (via Netskope LogStreaming) from the Netskope tenant:
- Go to Logging in Cloud Exchange and search for the pulled logs.
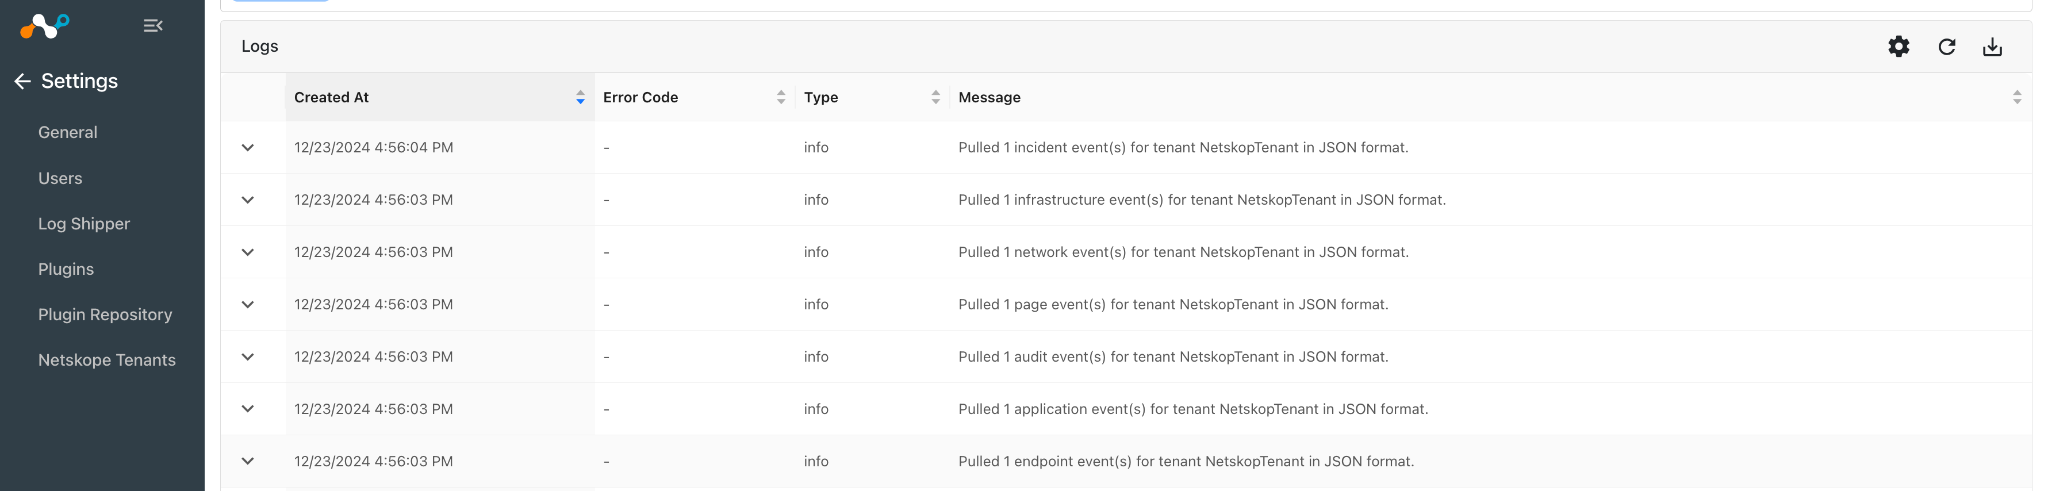
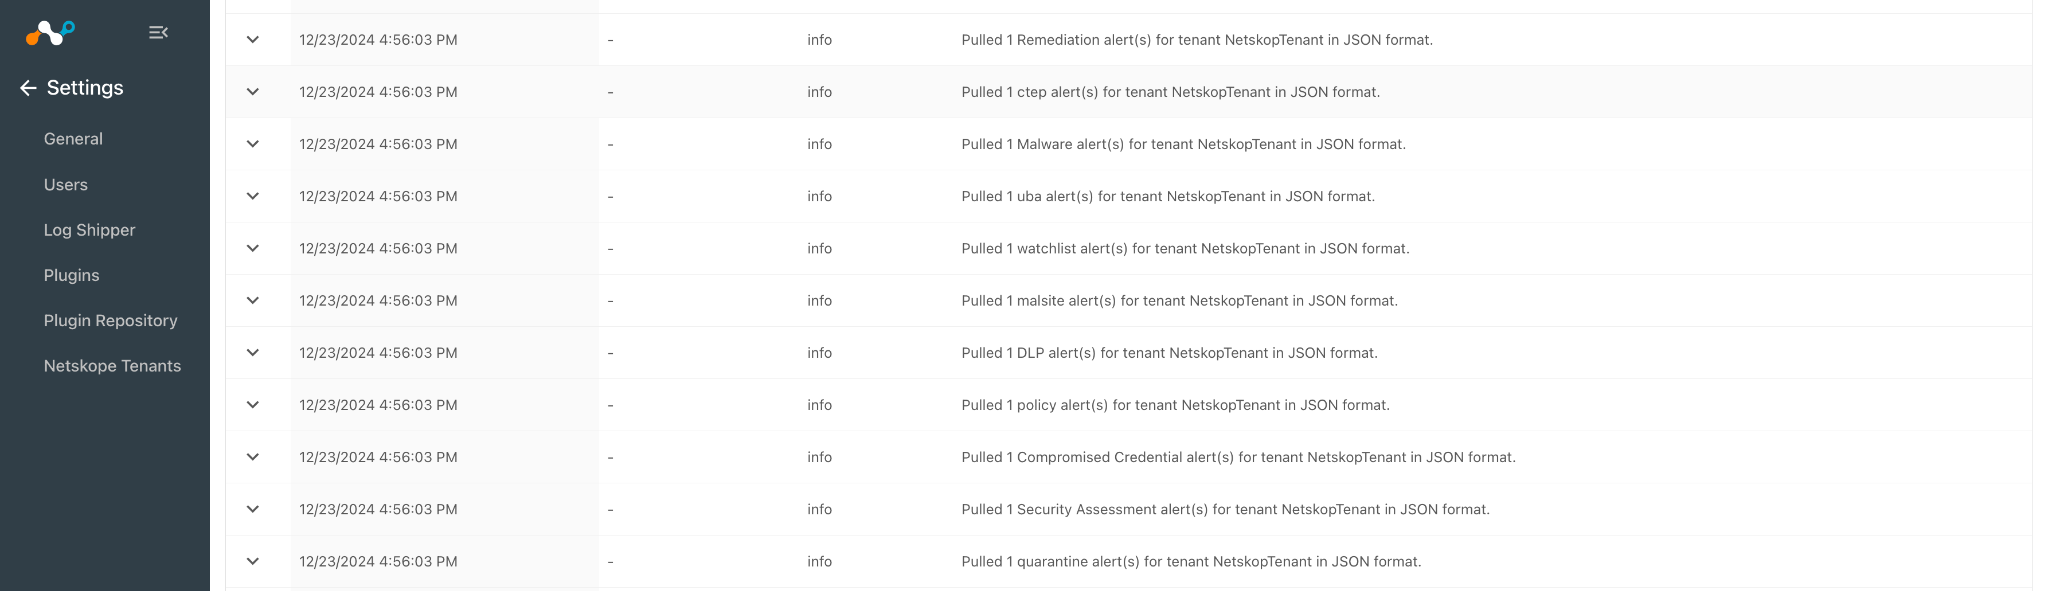
Validate the Push
To validate the plugin workflow:
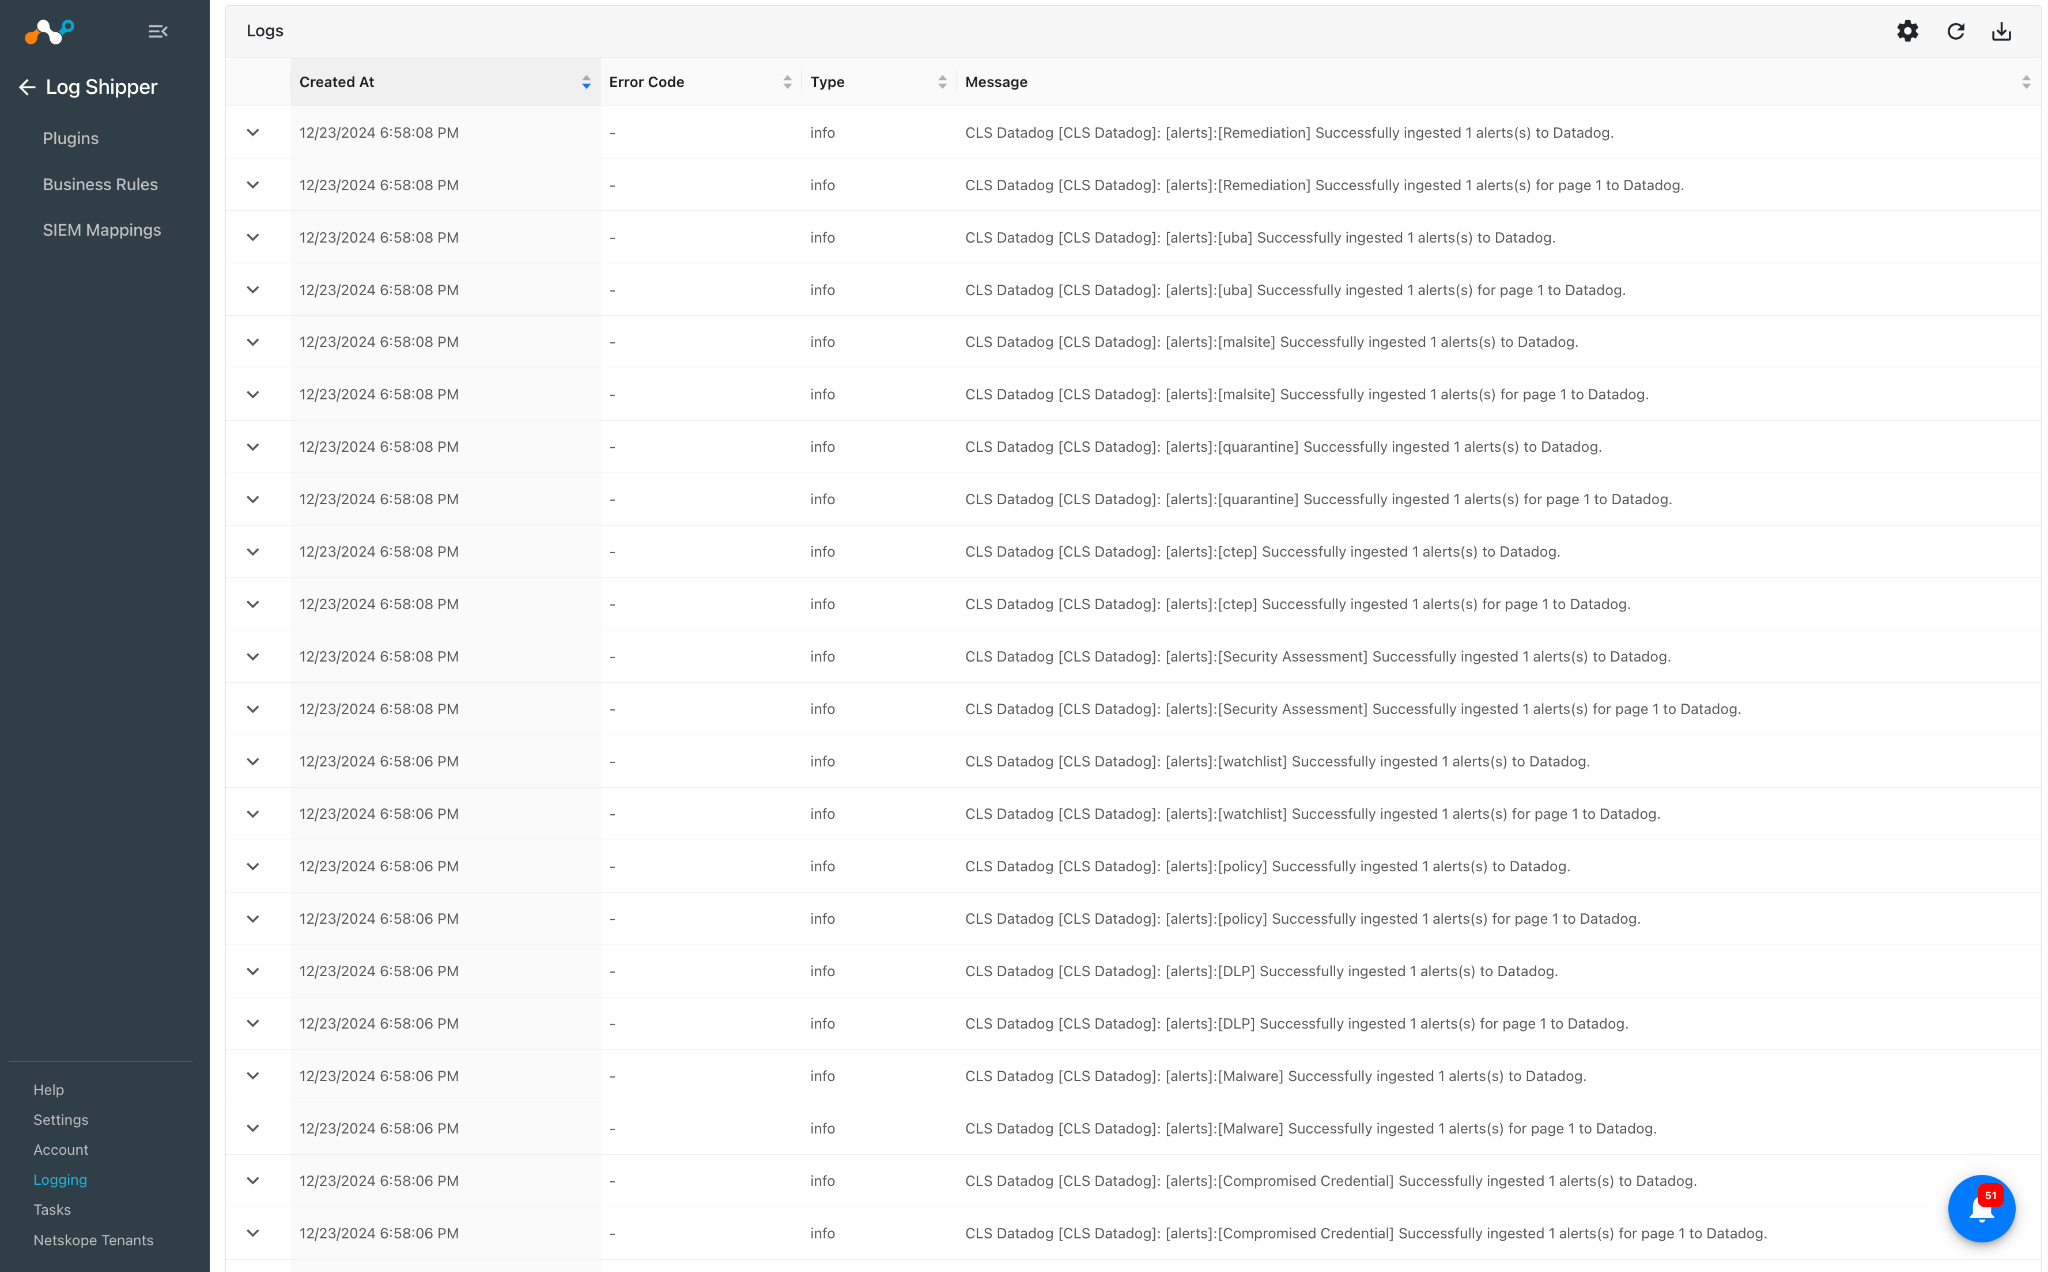
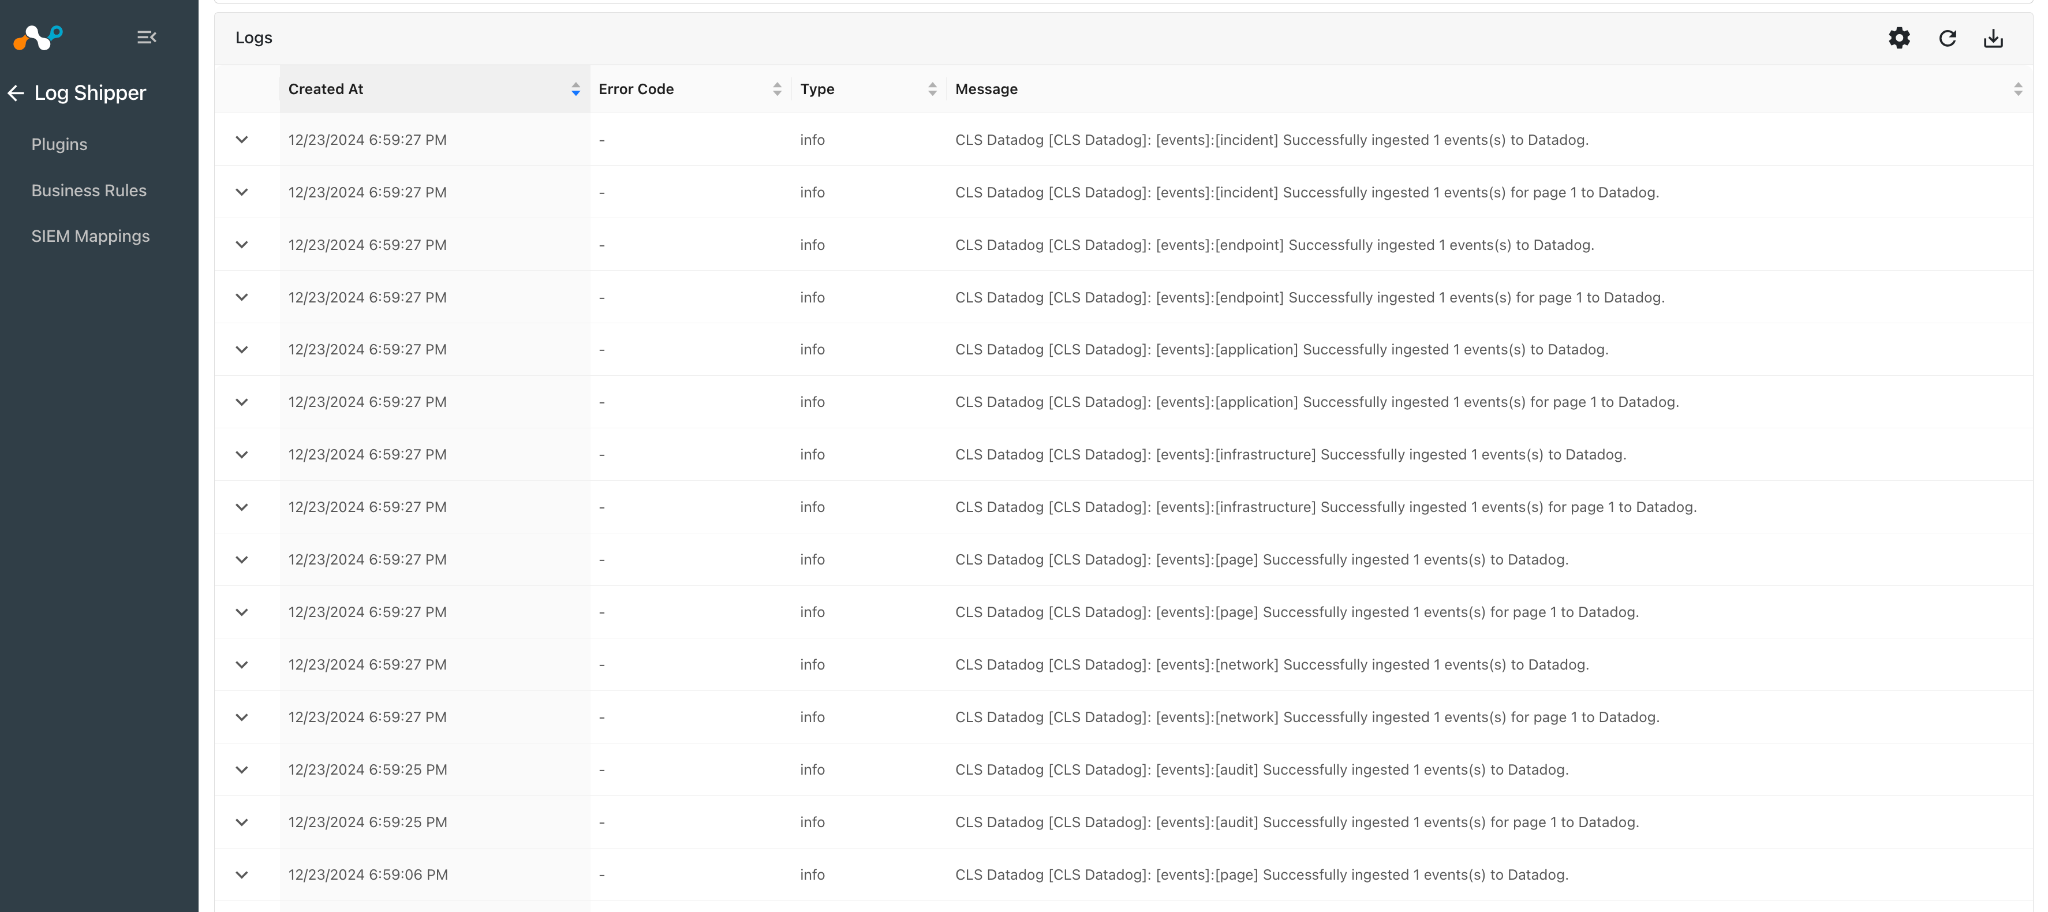
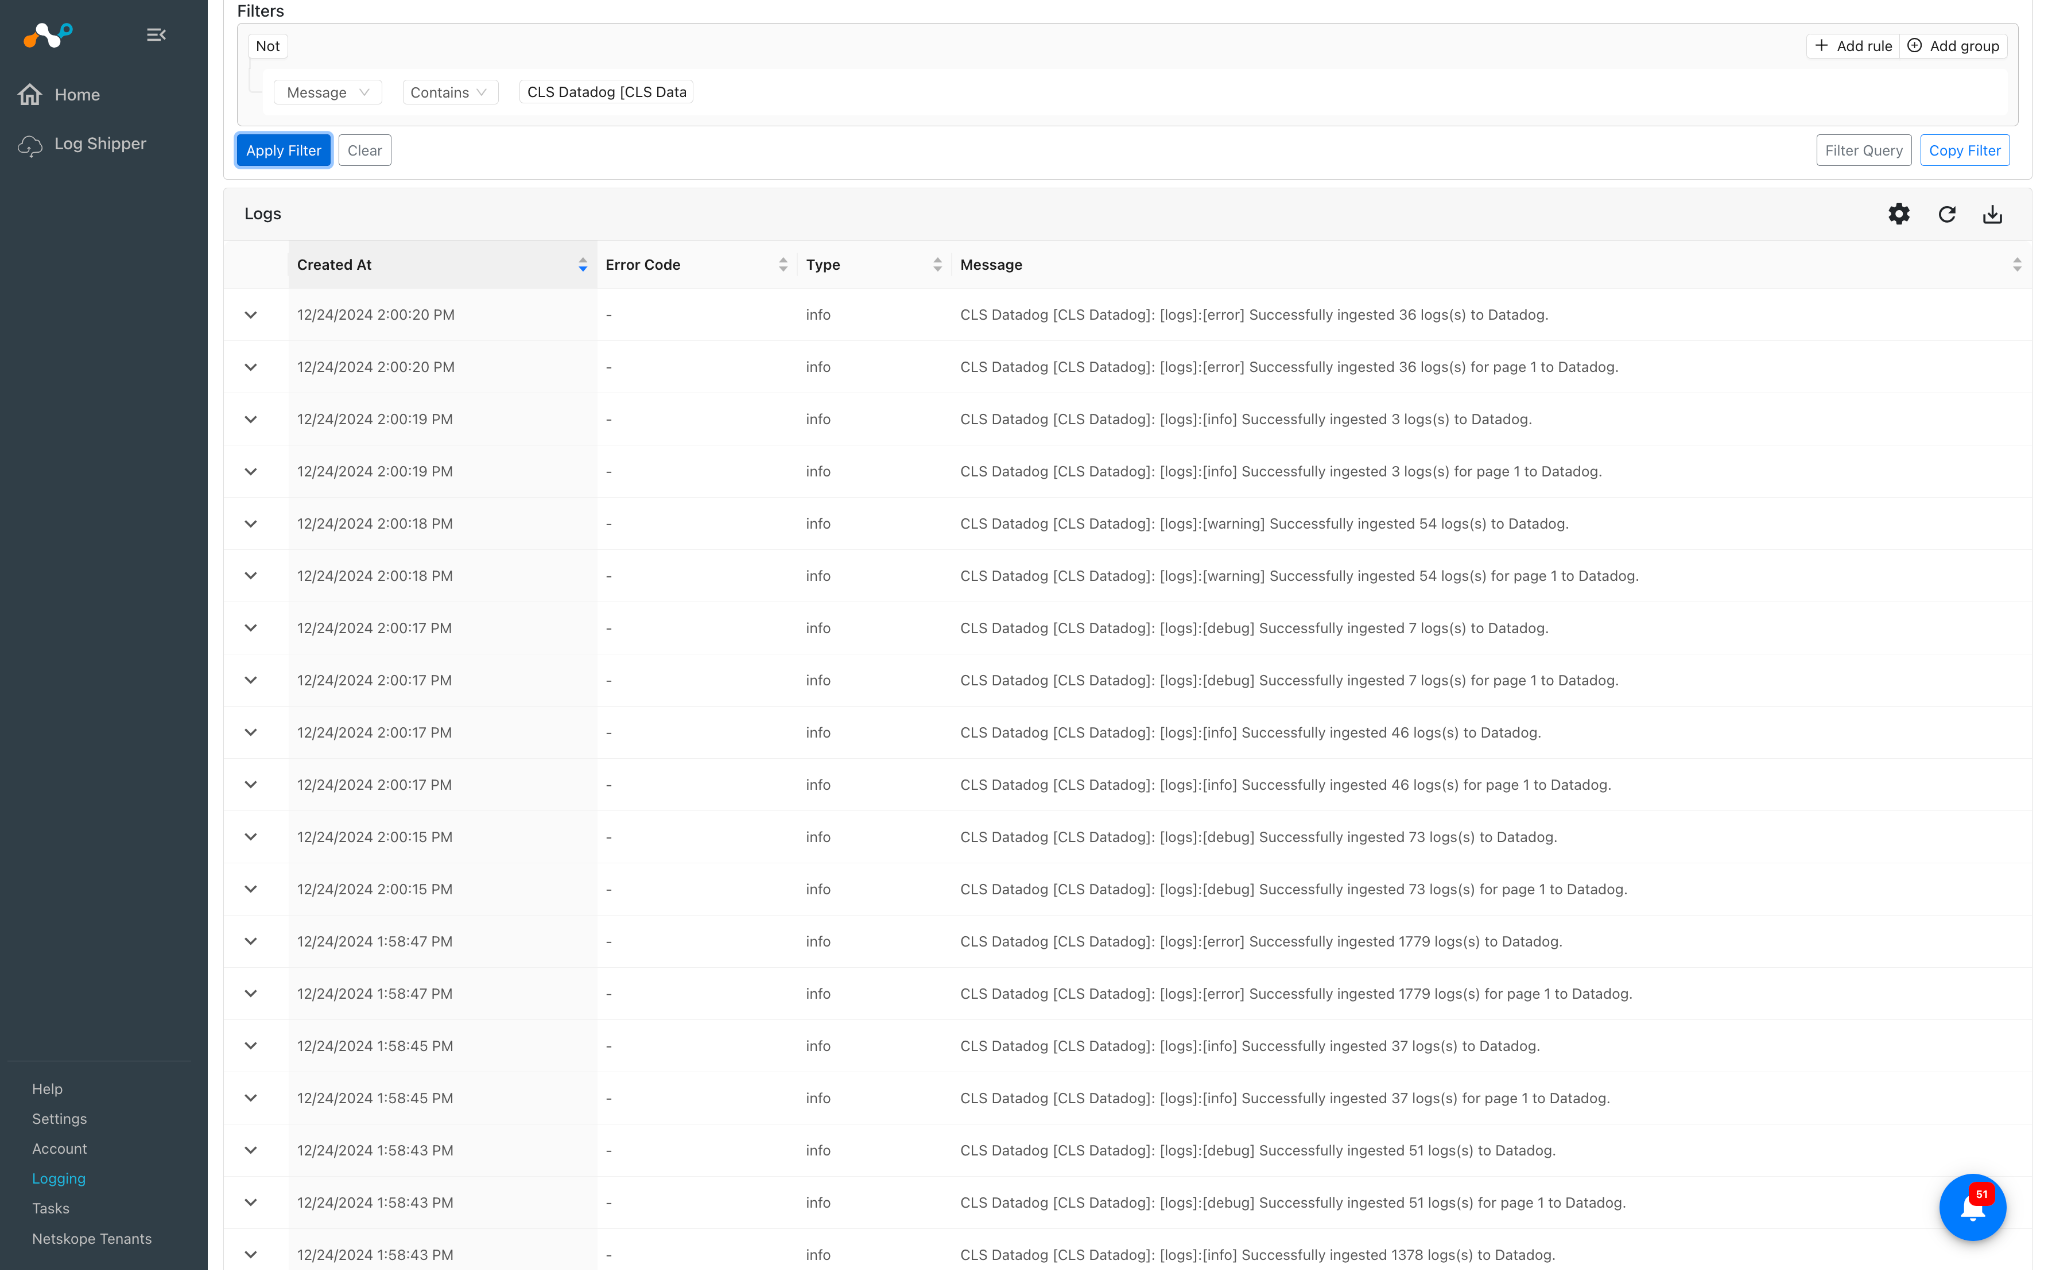
Go to Logging and Search for ingested Events, Alerts & WebTx (via Netskope LogStreaming) with the filter message contains ingested. The ingested logs will be filtered.
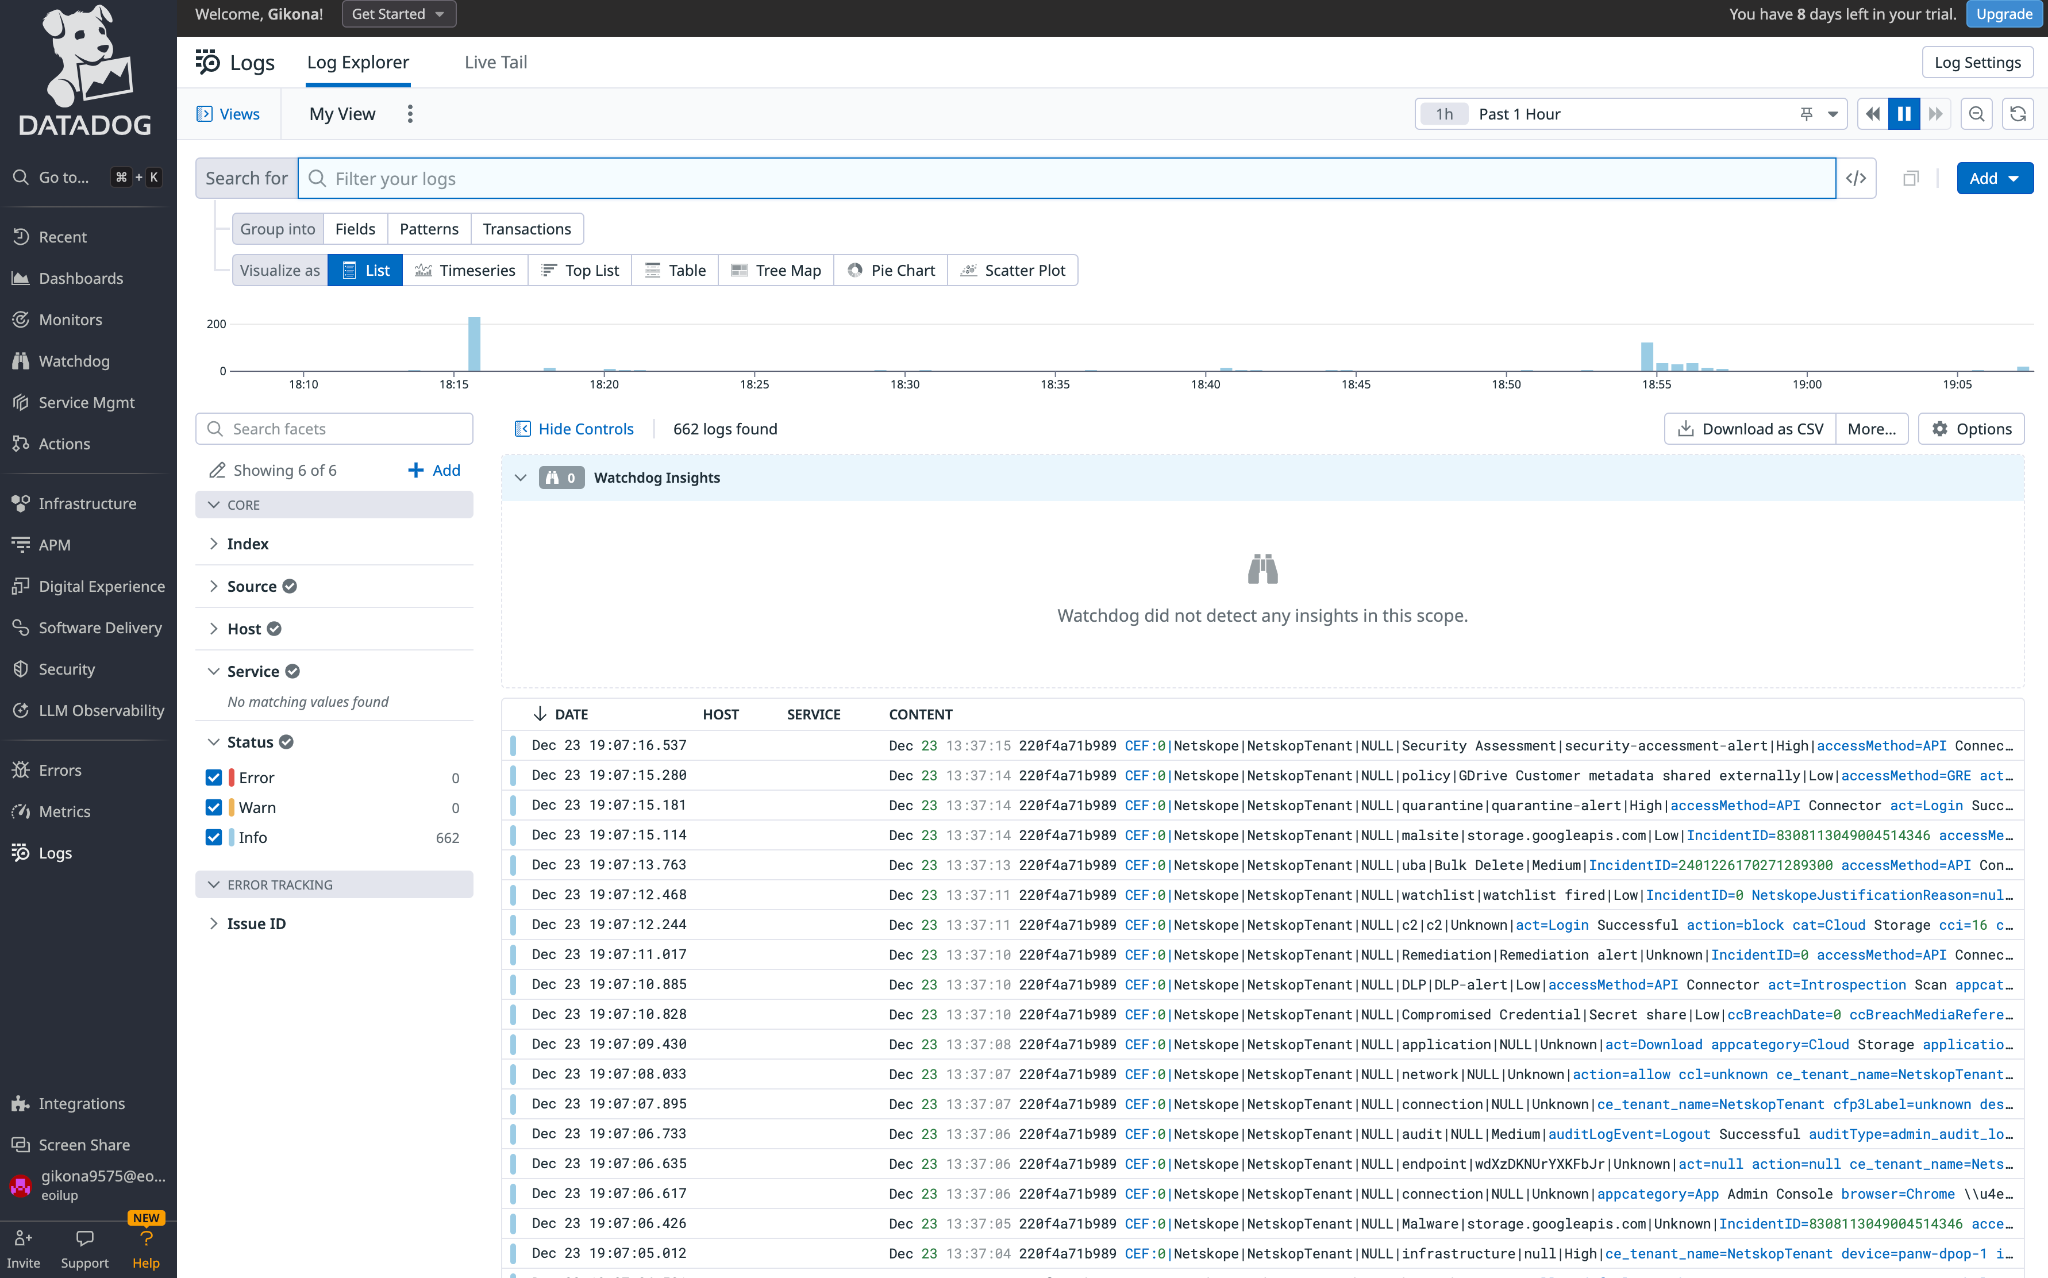
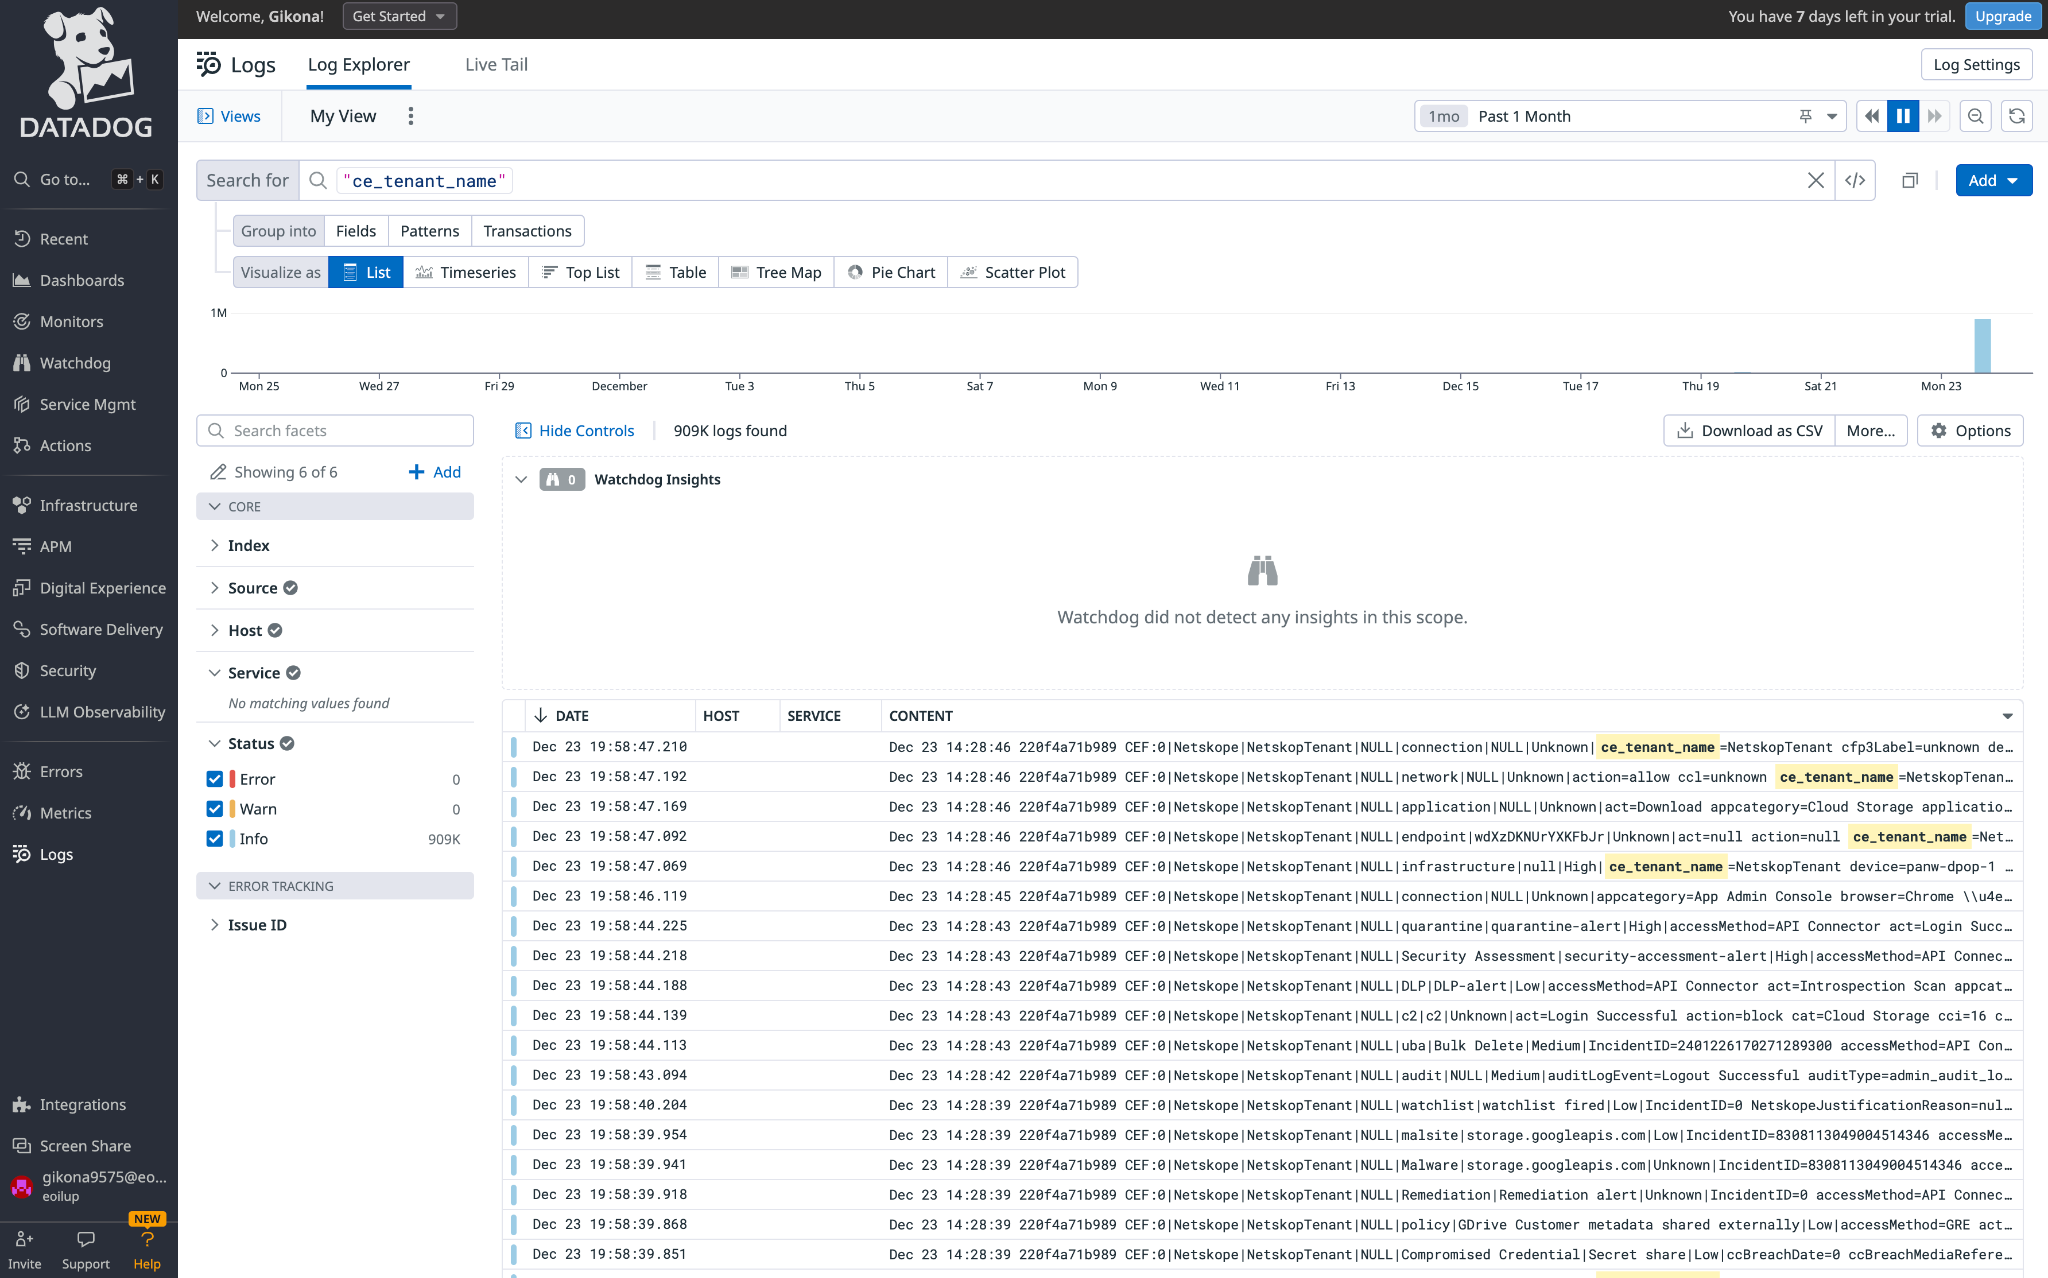
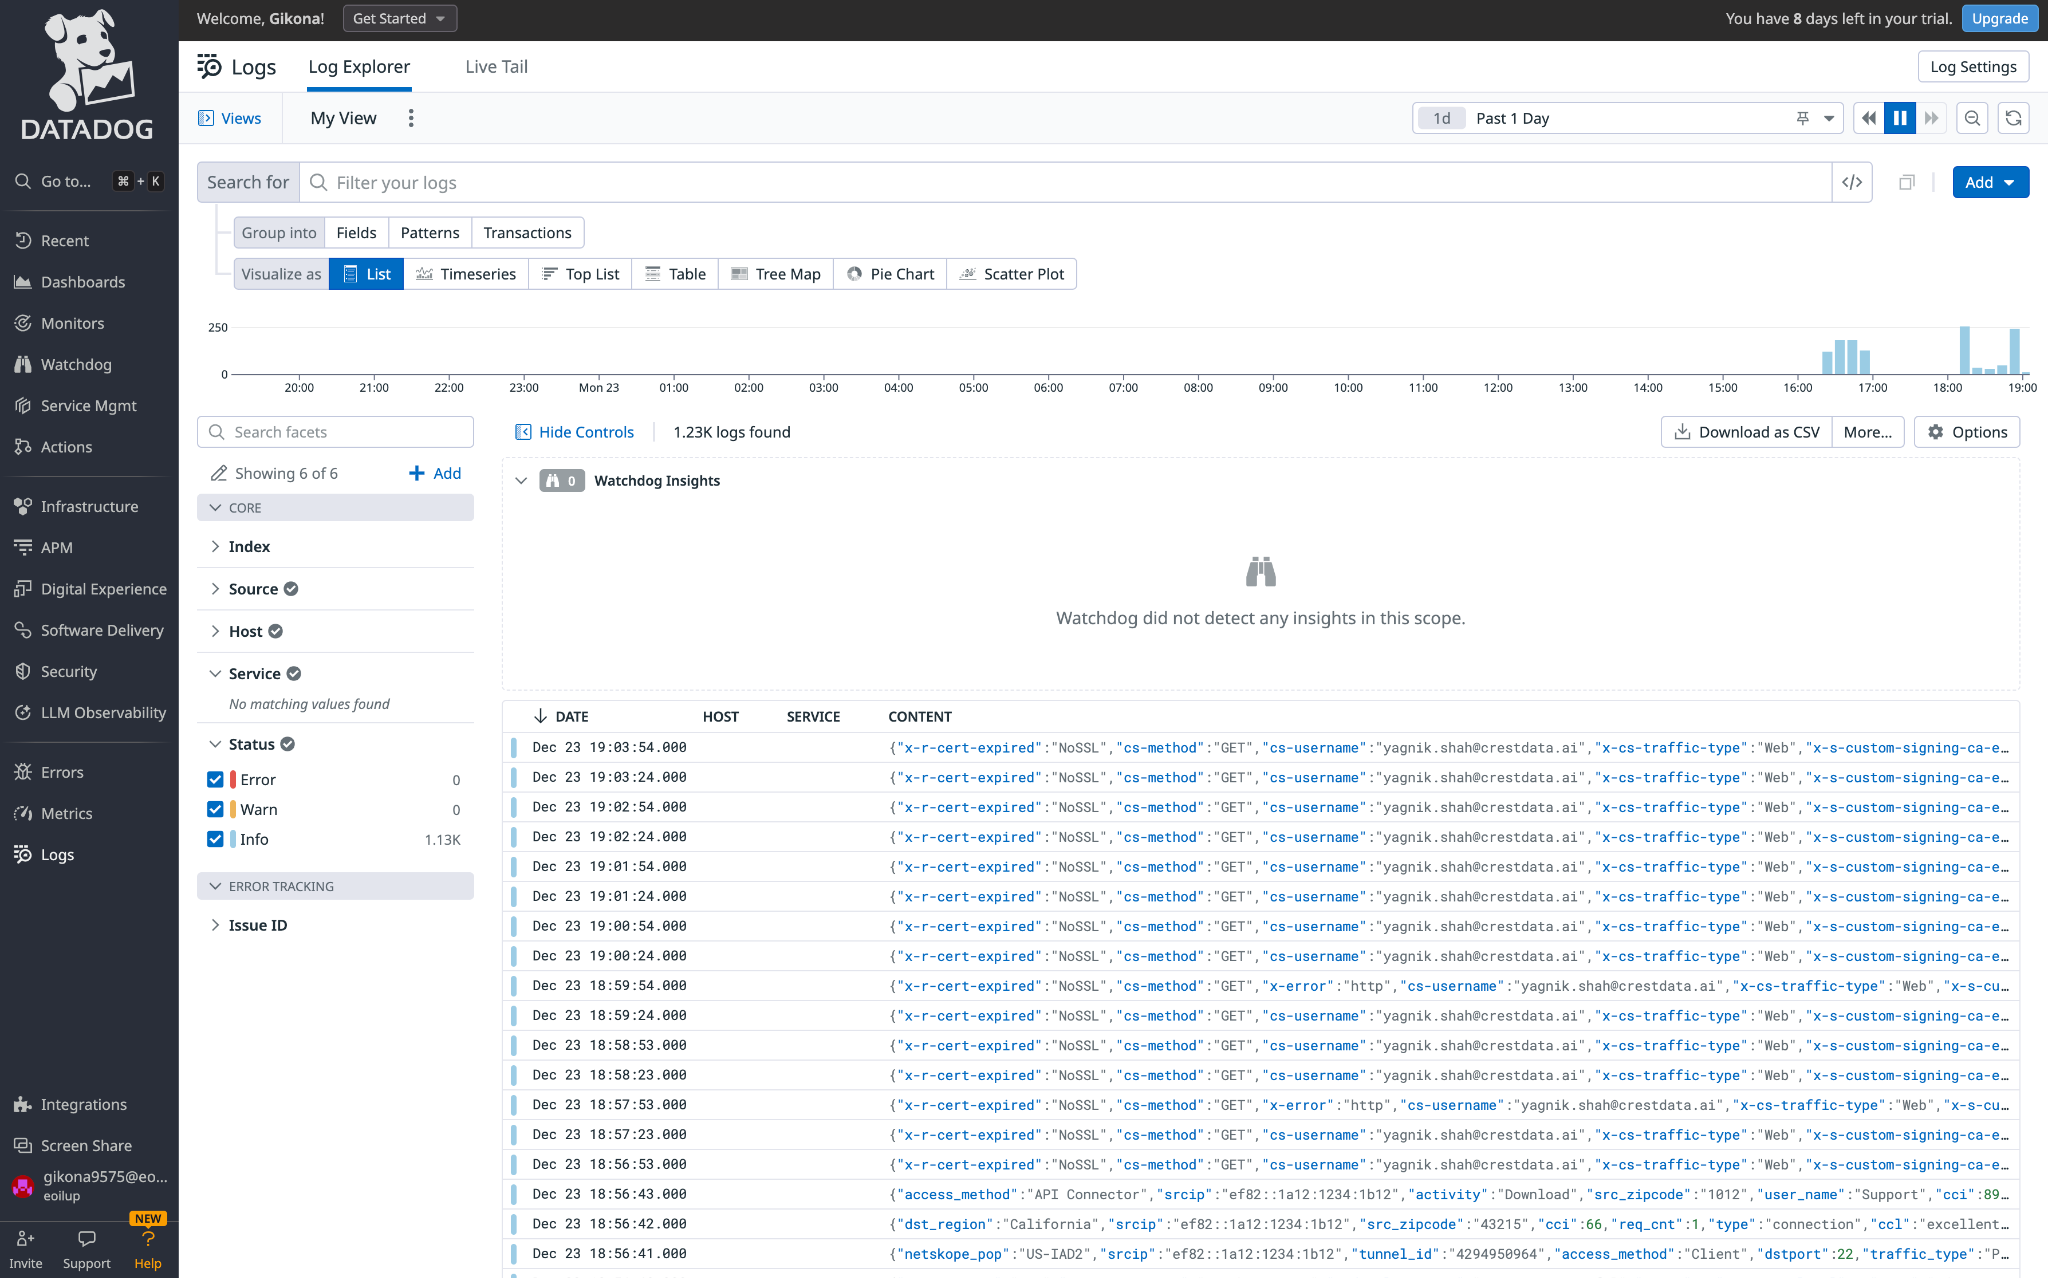
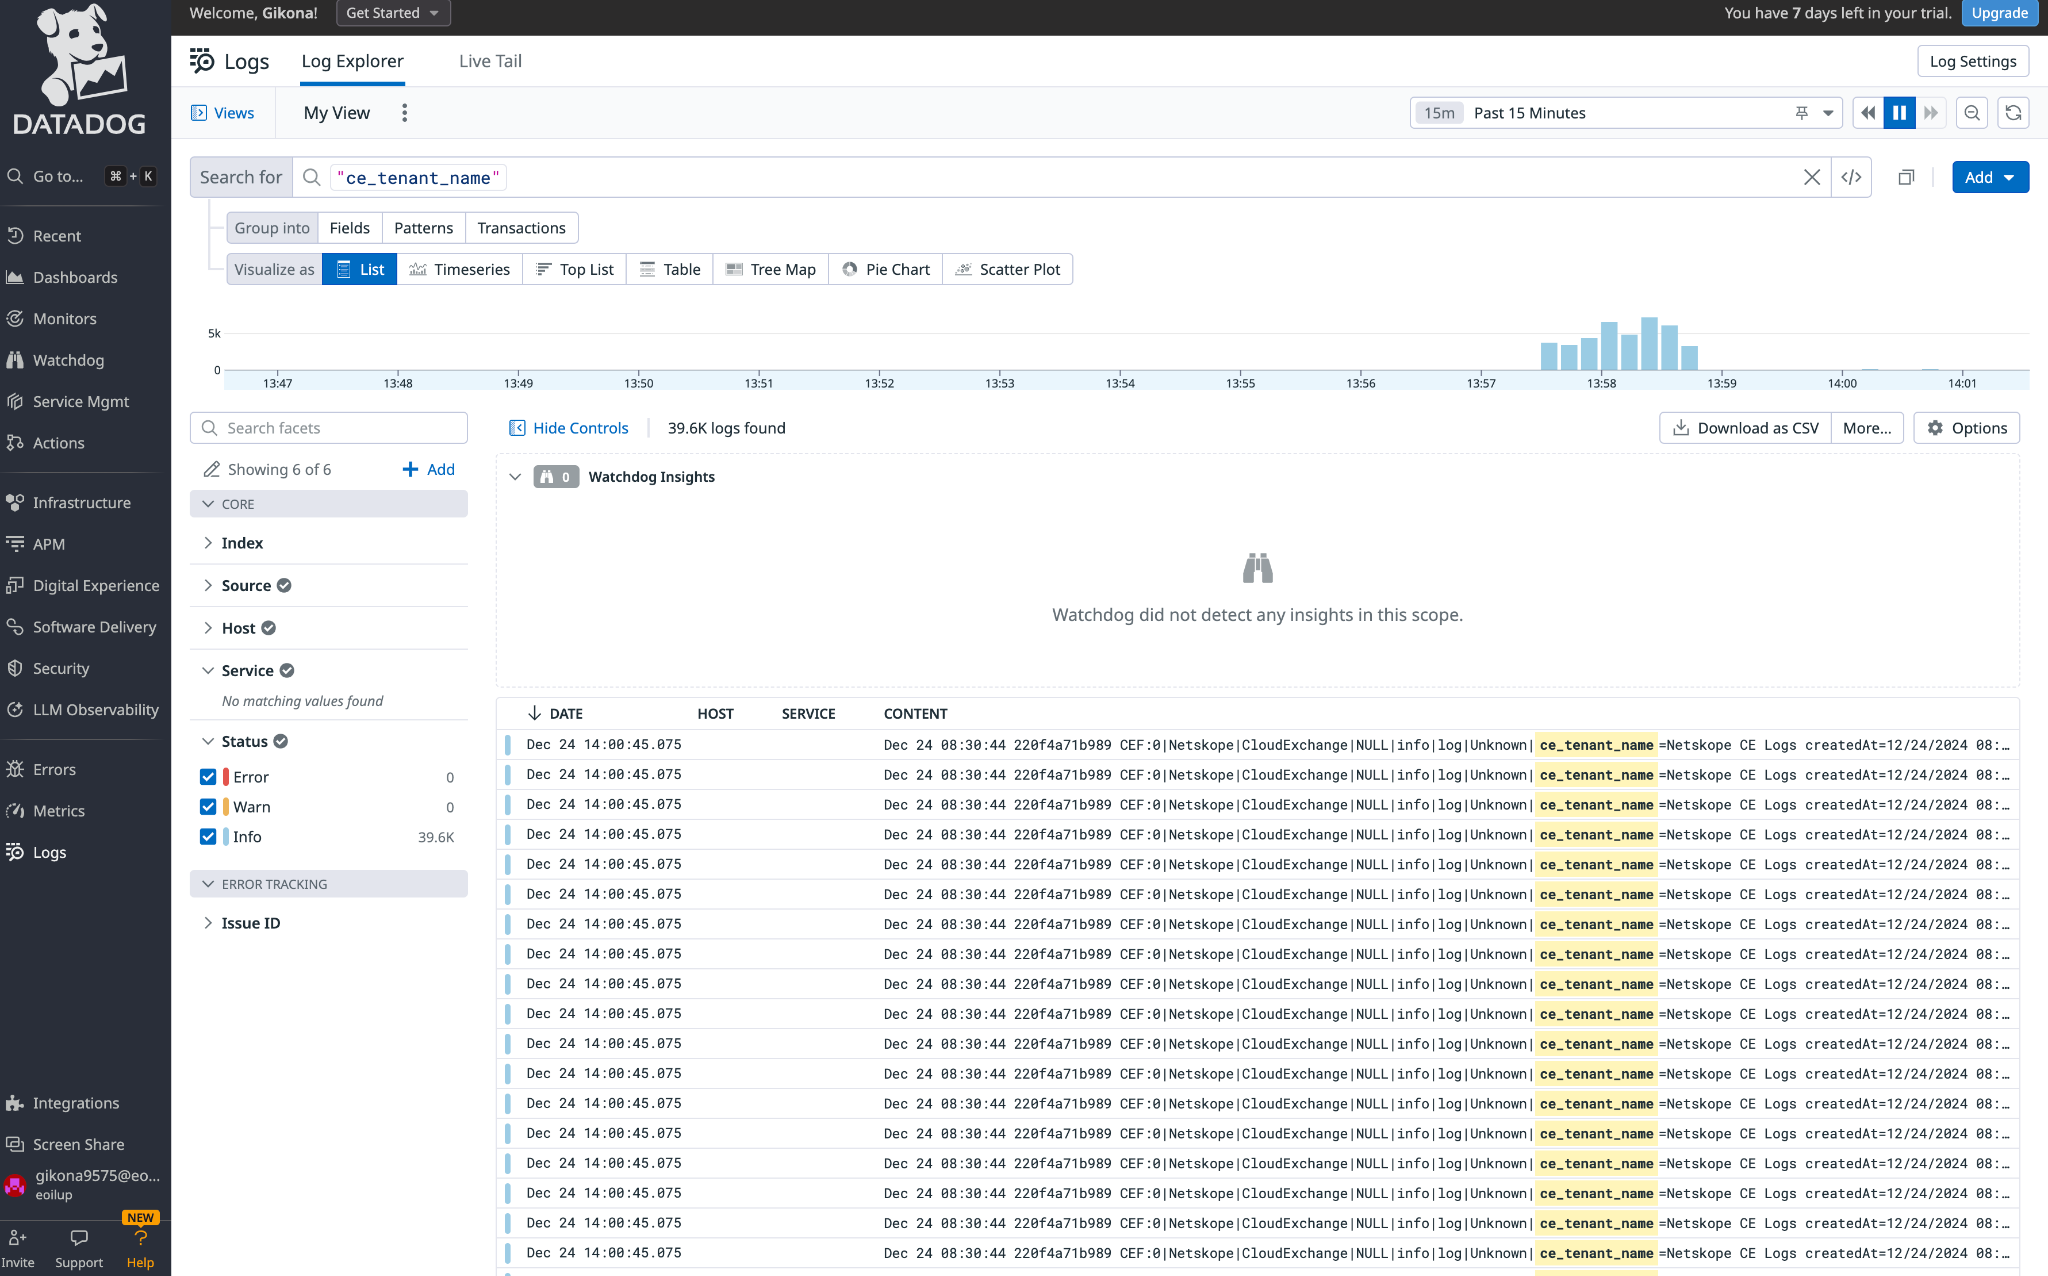
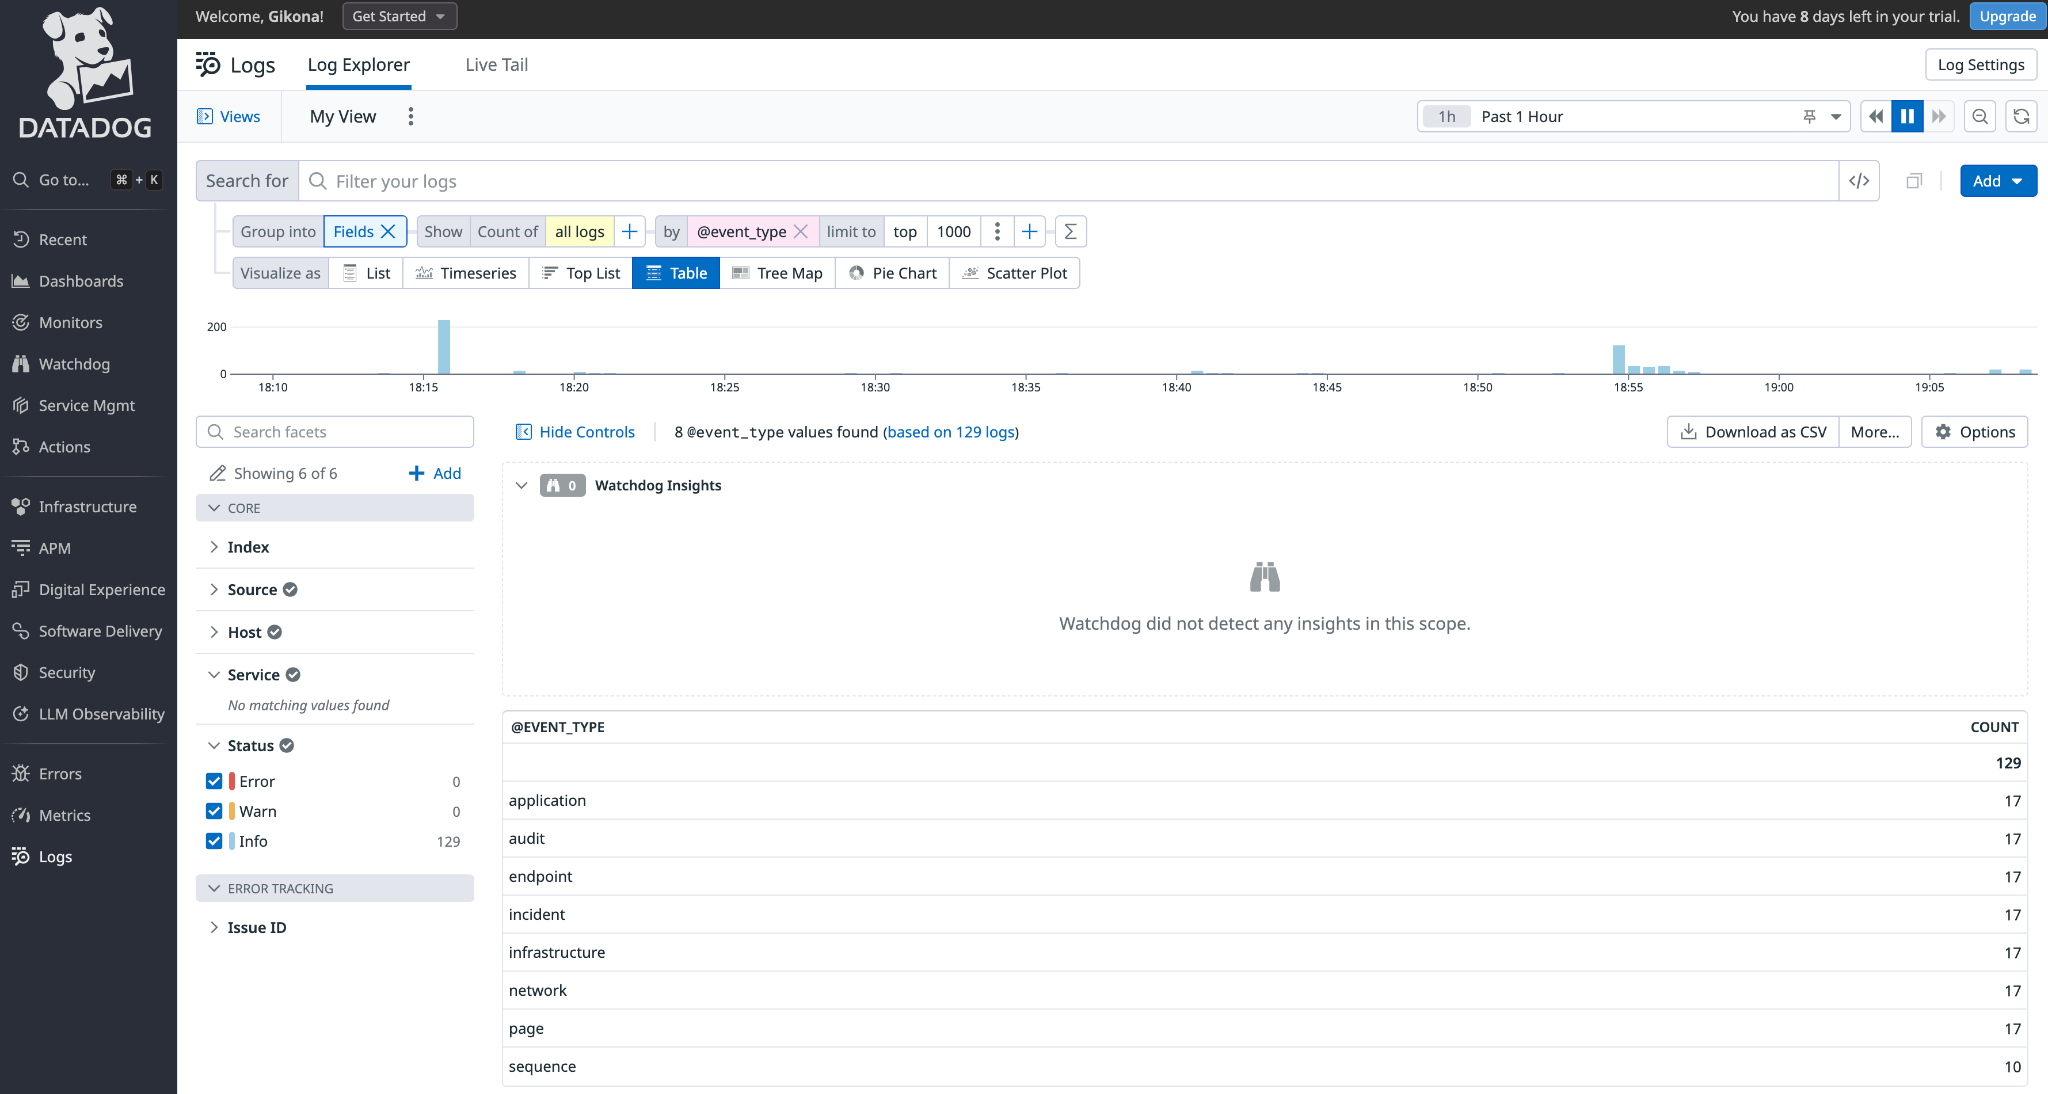
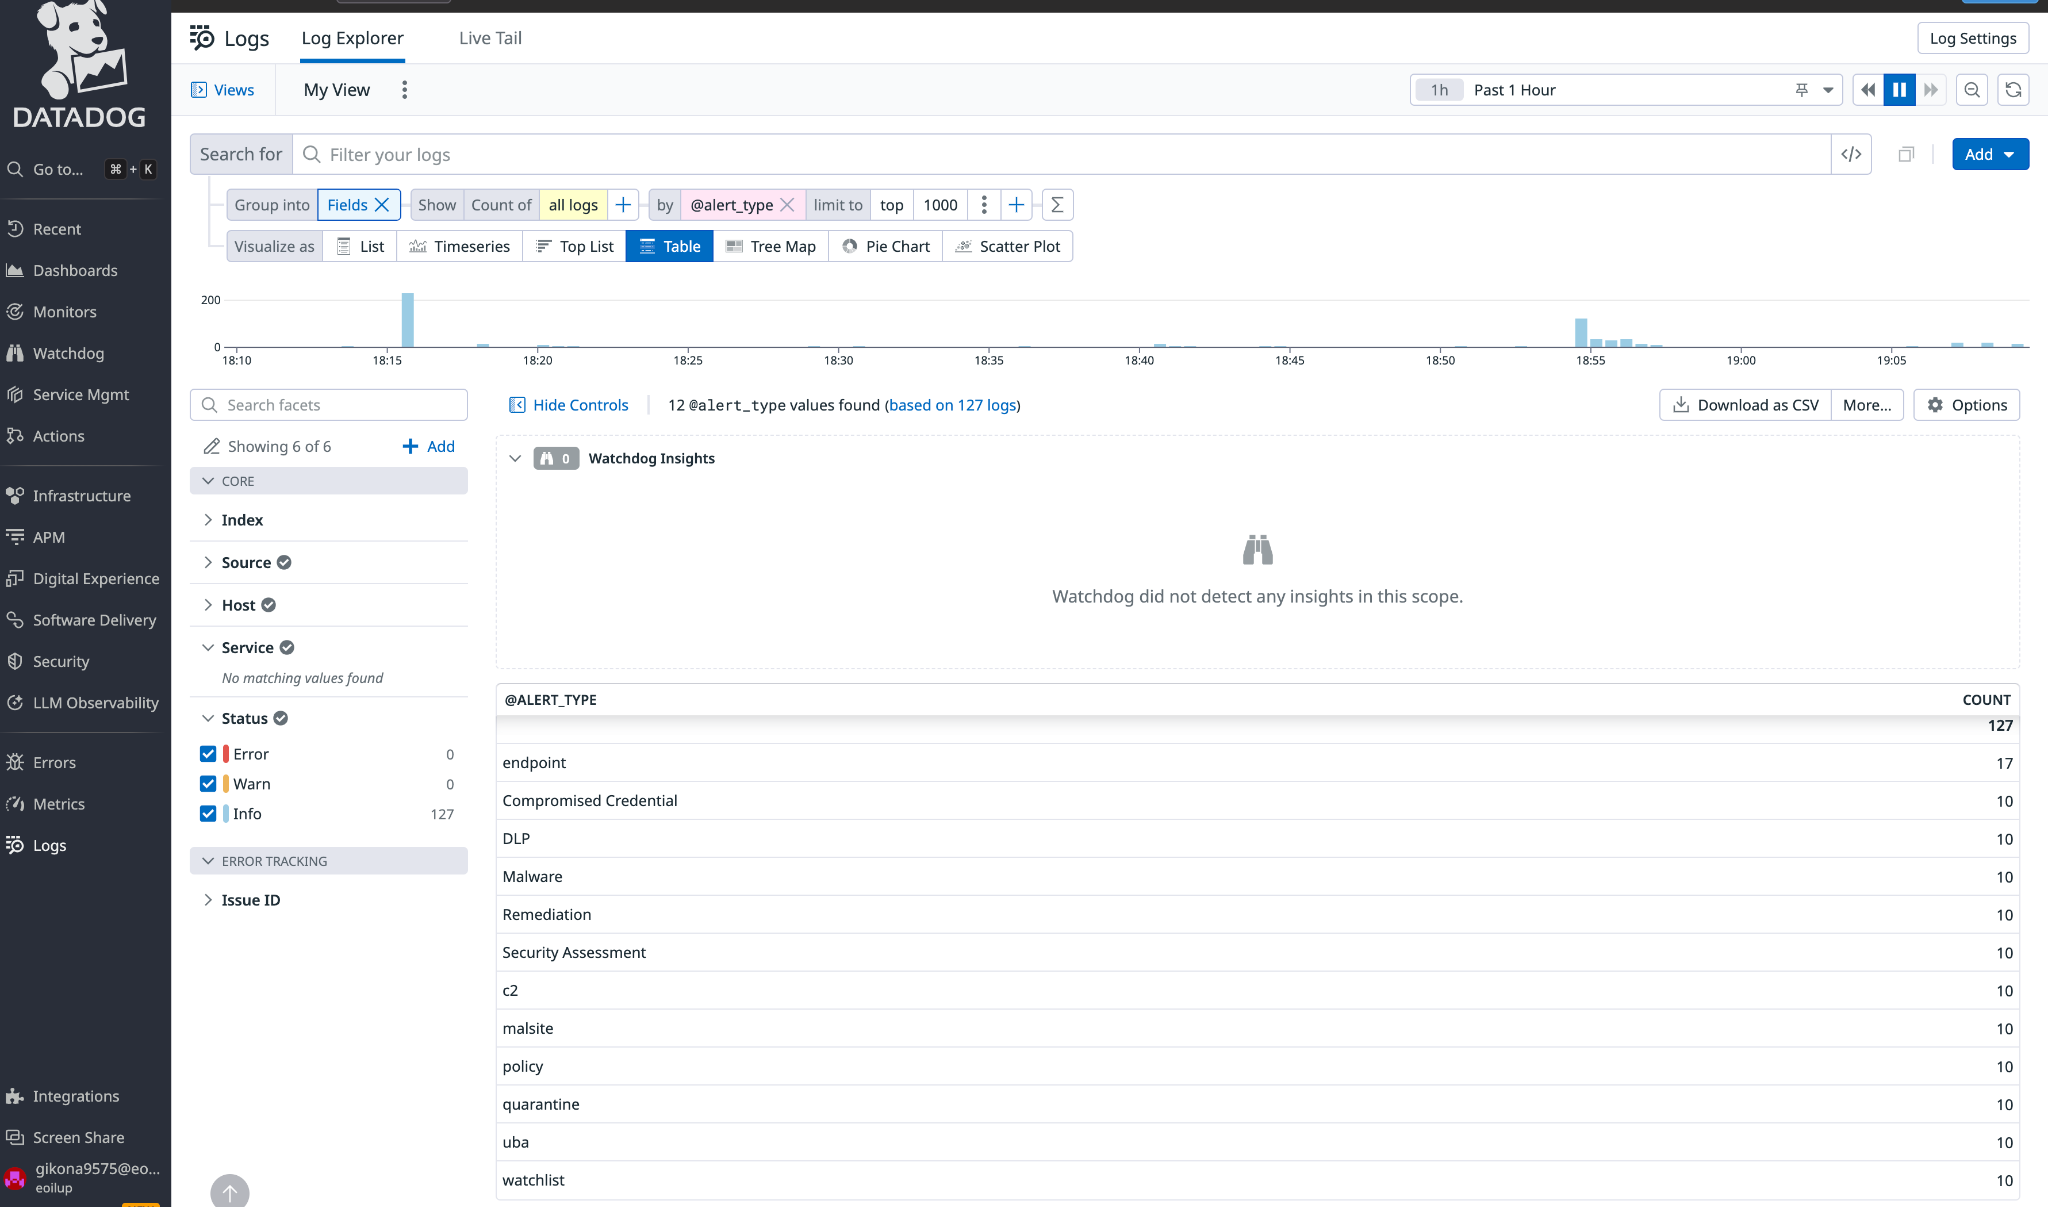
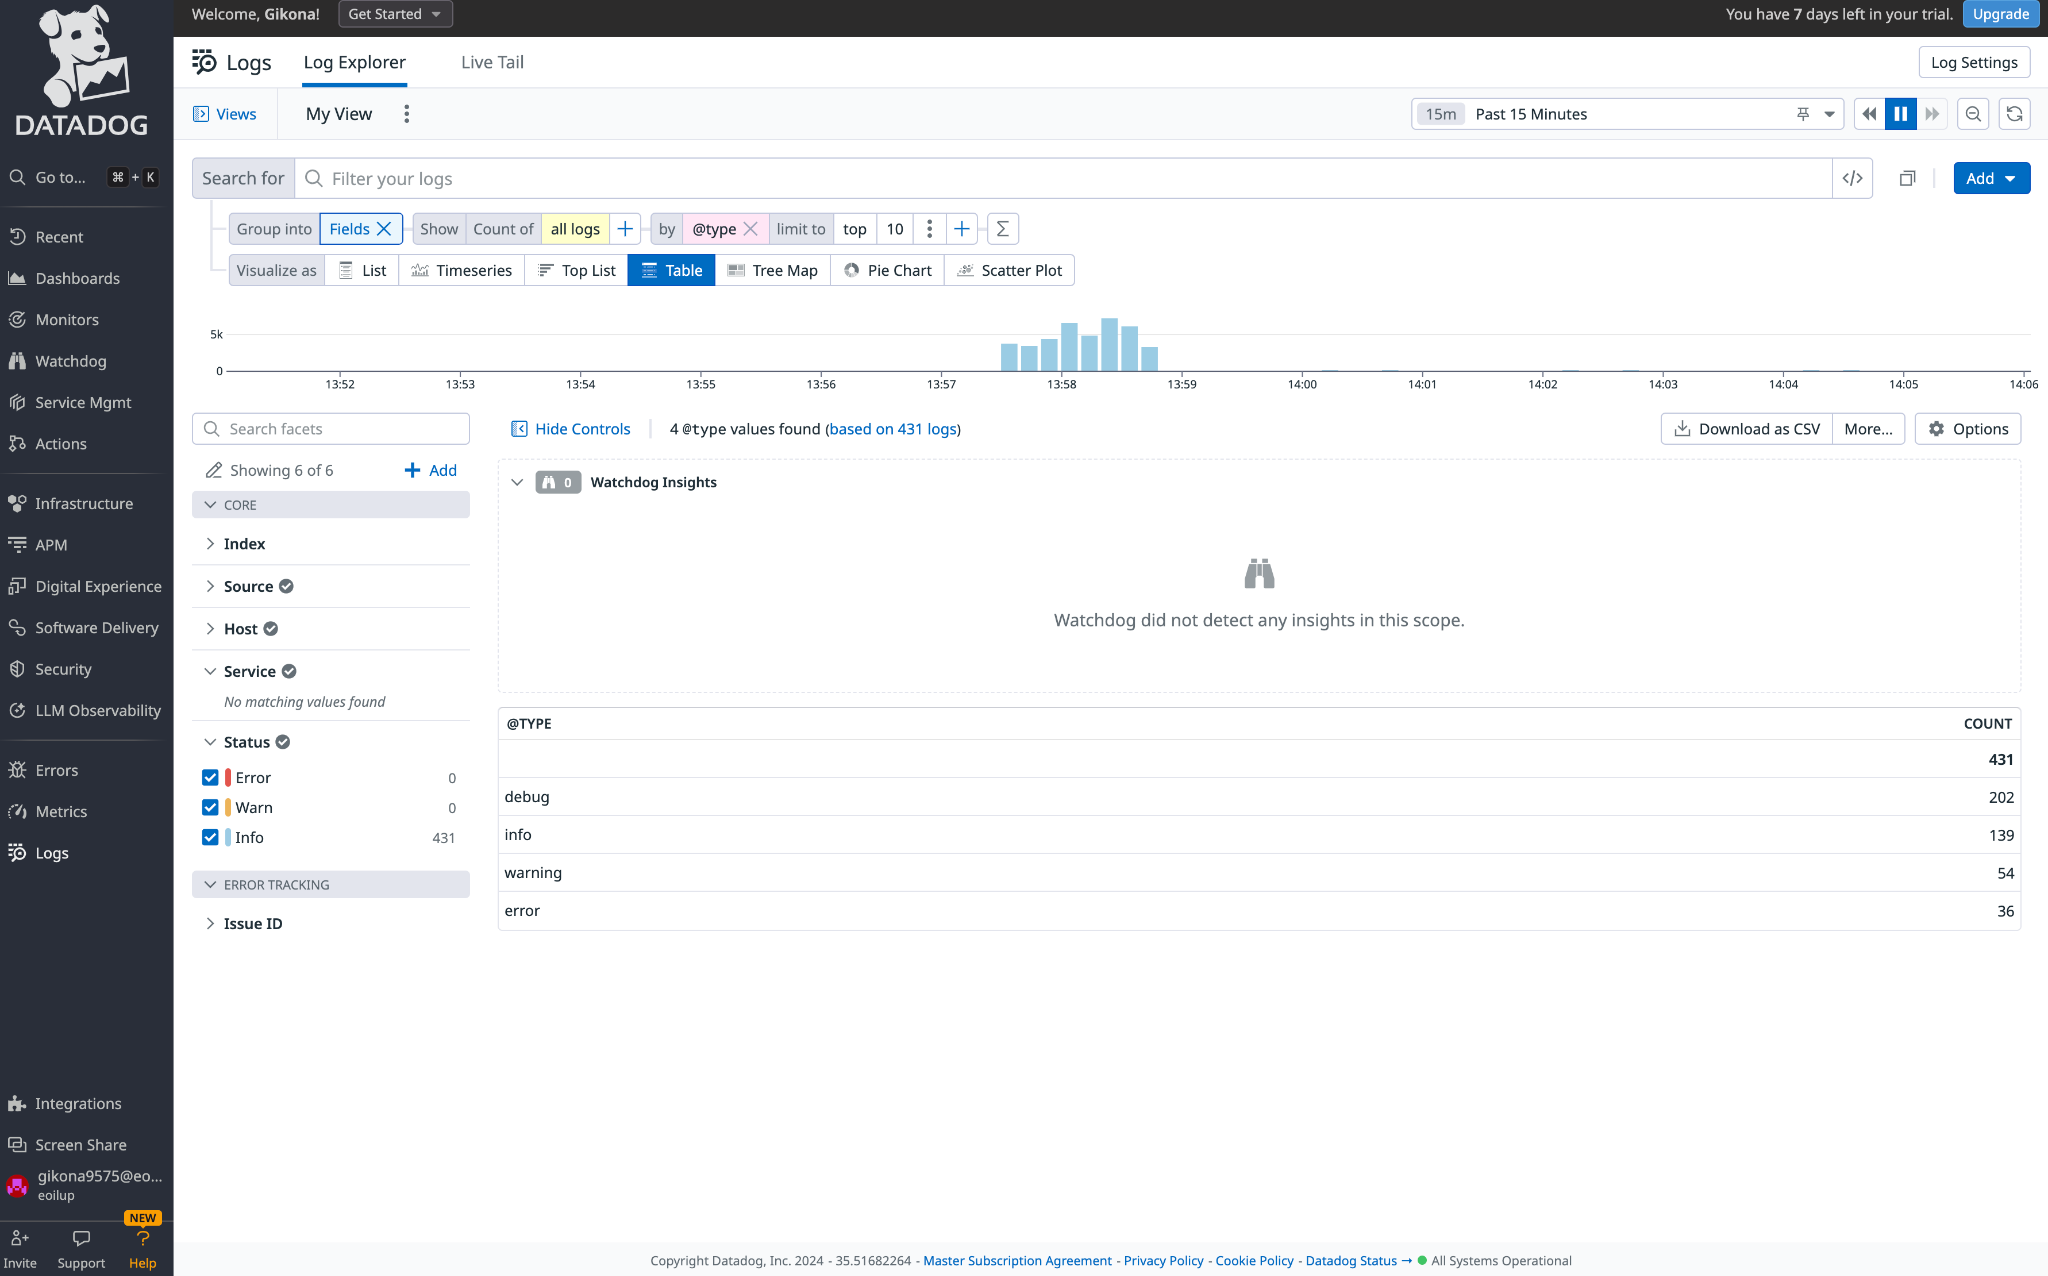
To validate the push on Datadog, follow these steps:
- Log in to the Datadog Platform.

- Click Logs. You have the ability to apply filters based on your host by utilizing your Tenant name.
Troubleshooting the Datadog Plugin
Not able to see JSON Data on Datadog in historical cycle
Note: Data in JSON format sent to Datadog will not appear on the platform if it is more than 18 hours old.
The logs in Cloud Exchange for the historical data in JSON format will show Ingested without any Error.
What to do: Edit the Plugin and change the JSON to CEF format by enabling the transform logs option, so it will share the Historical Data.