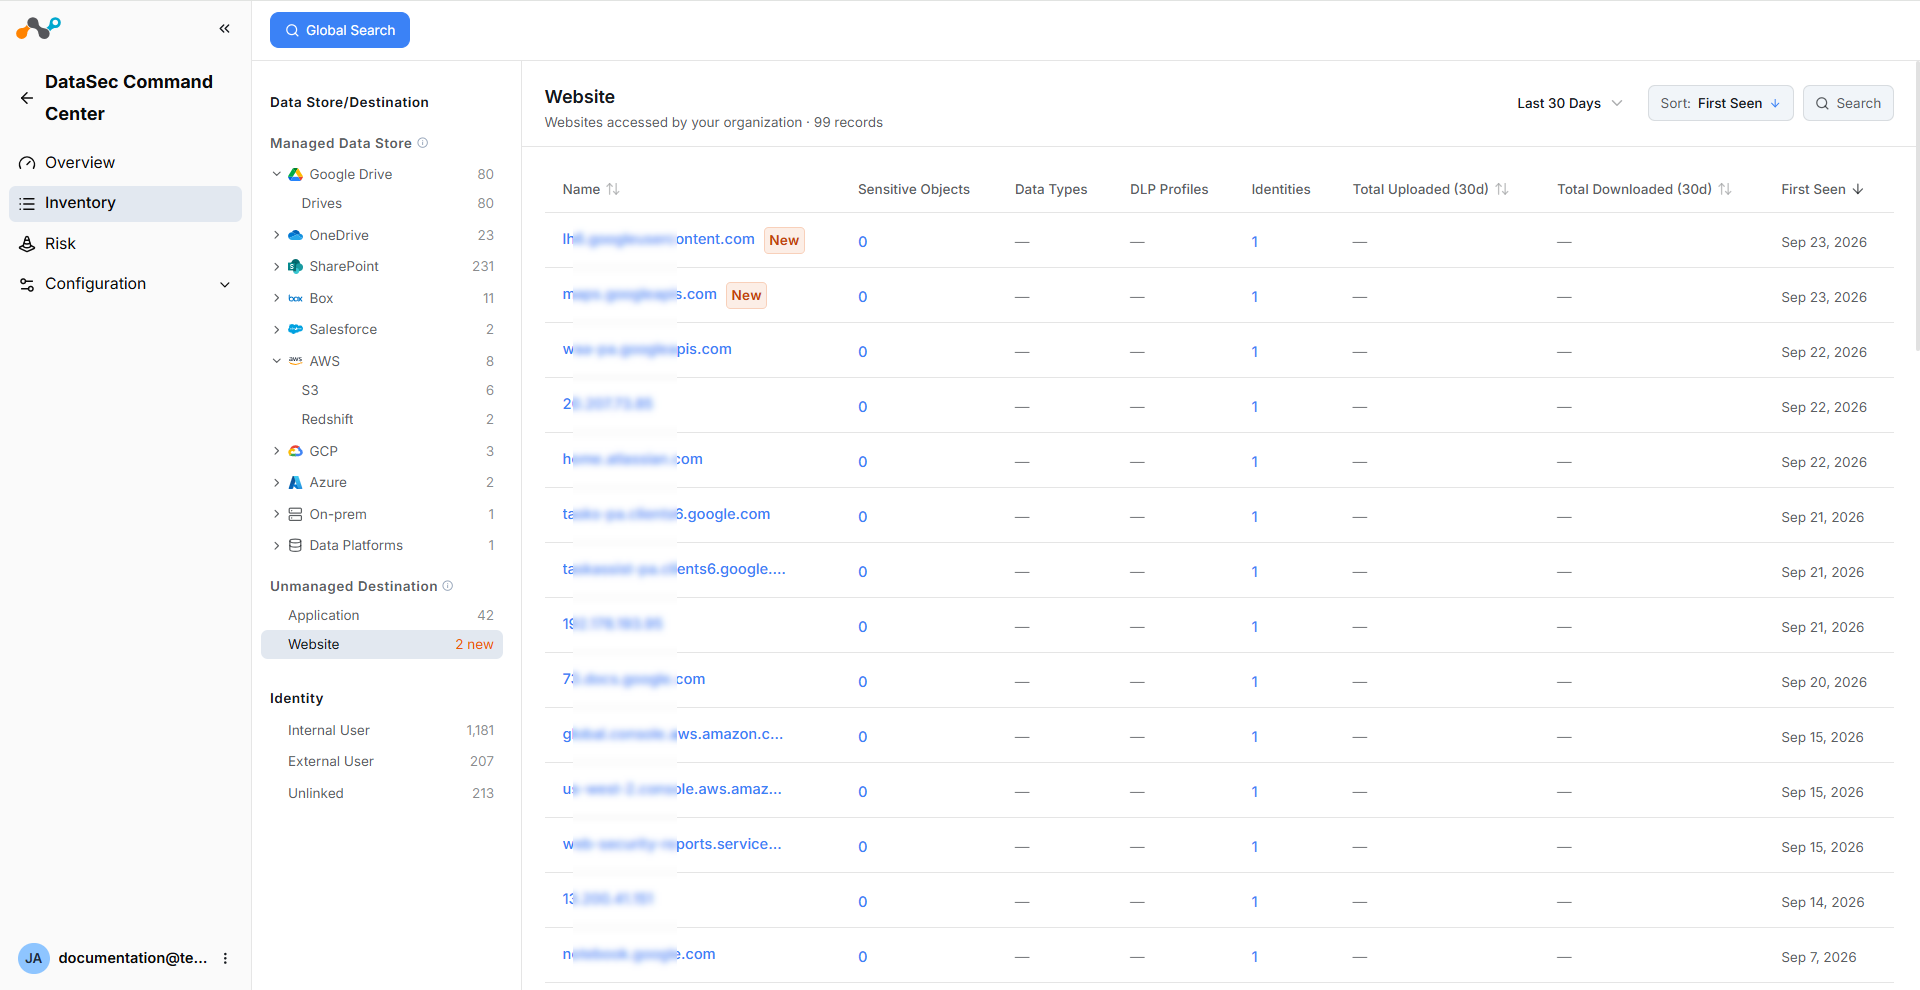
The Data Stores and Destinations page provides a unified inventory of all data repositories and destinations where DataSec Command Center (DCC) detects sensitive data across your environment.
The left navigation panel lists all available data stores. The number beside each data store name represents the total data store count, not the app instance count. For example, if you have two instances of Google Drive with four drives each, the number displays 8, not 2.
The page divides your inventory into two main categories:
- Managed Data Stores: Data stores connected to Netskope (CASB API or DSPM) with scanning enabled, such as Google Drive, OneDrive, AWS S3, or Azure Blob Storage.
- Unmanaged Destinations: Applications and websites detected only through Real-Time Protection (Inline), without a configured API connection.
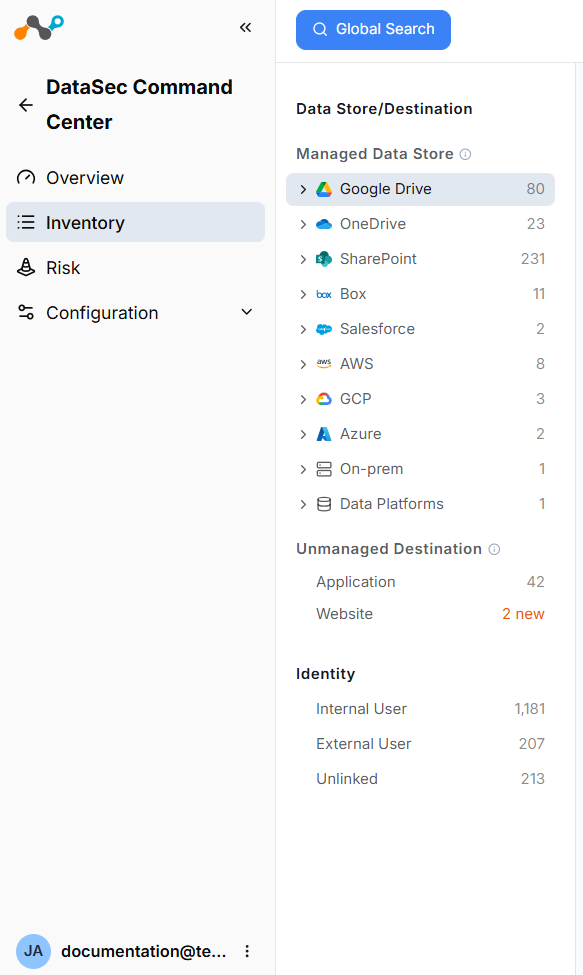
Managed Data Stores
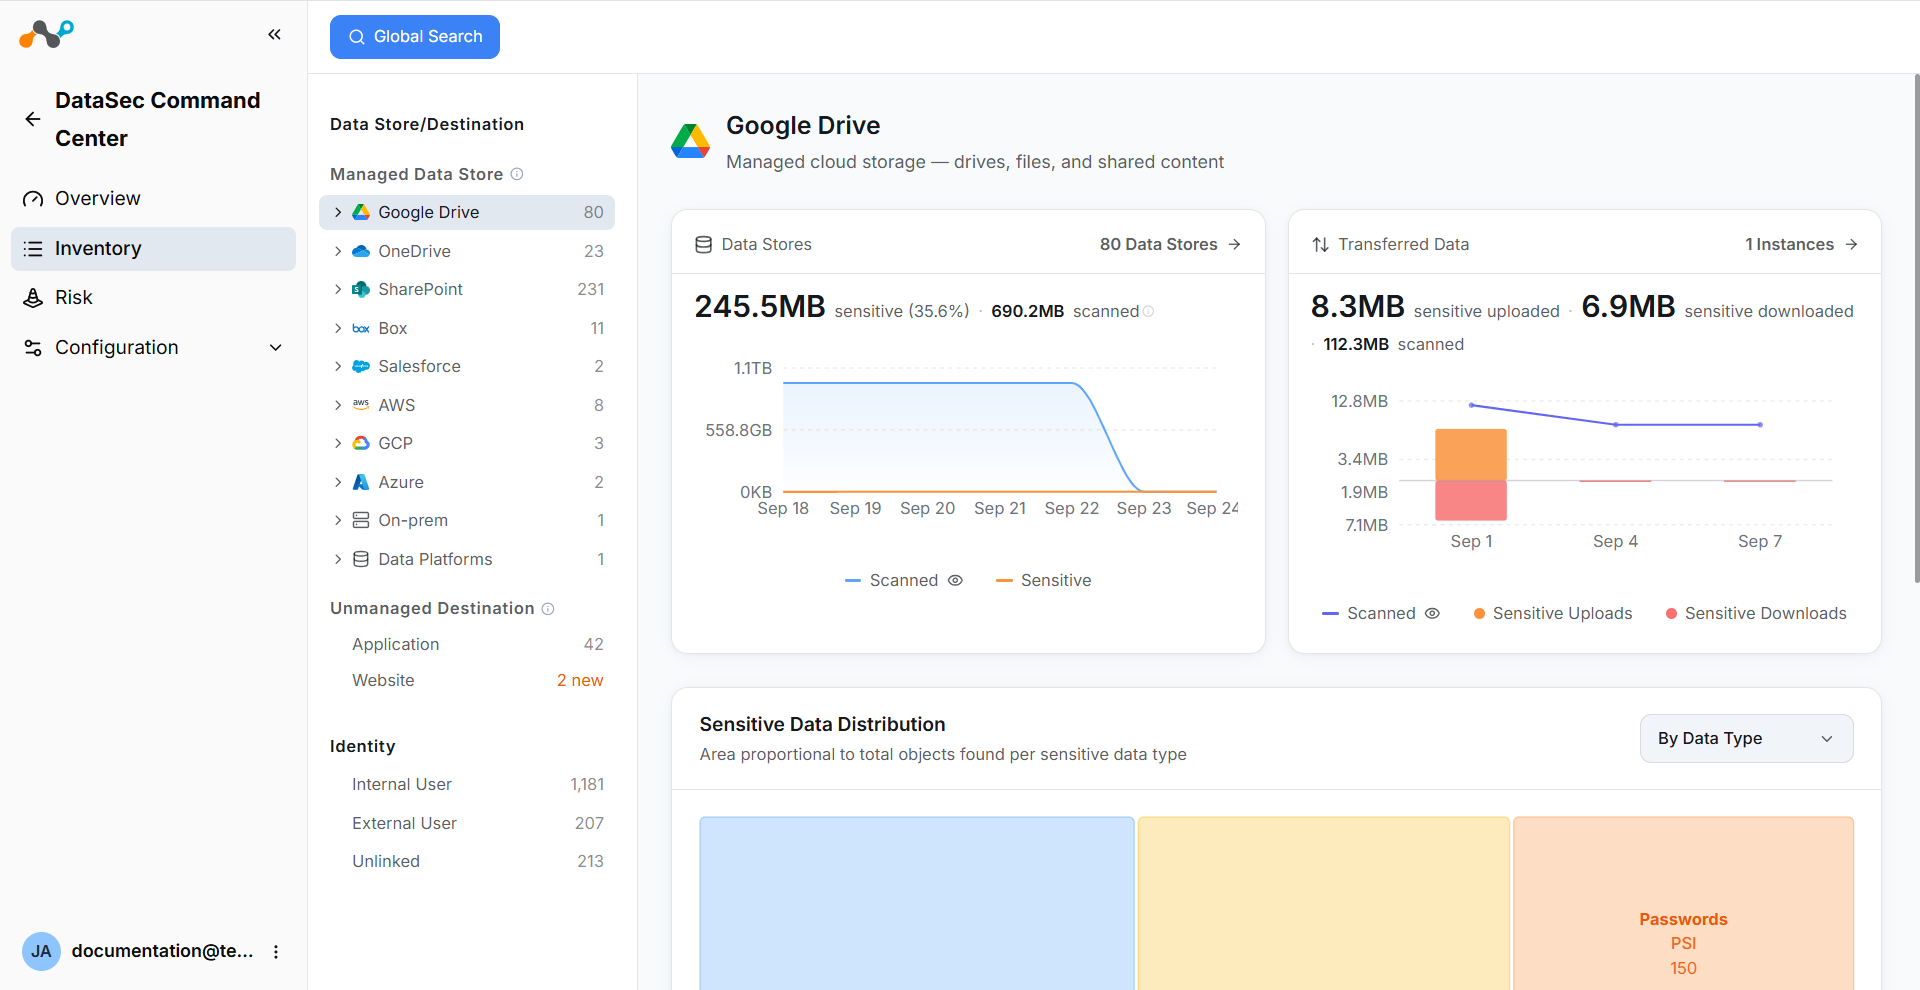
Selecting a data store from the navigation panel opens a data store dashboard. This dashboard aggregates data across all instances and data stores for that selection.
Data Store Dashboard
The dashboard includes the following components:
-
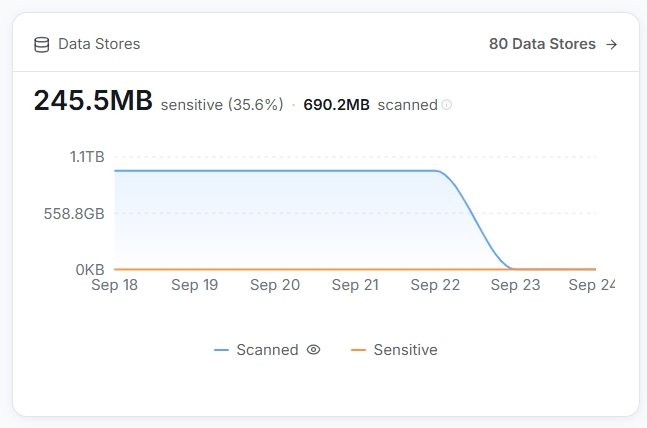
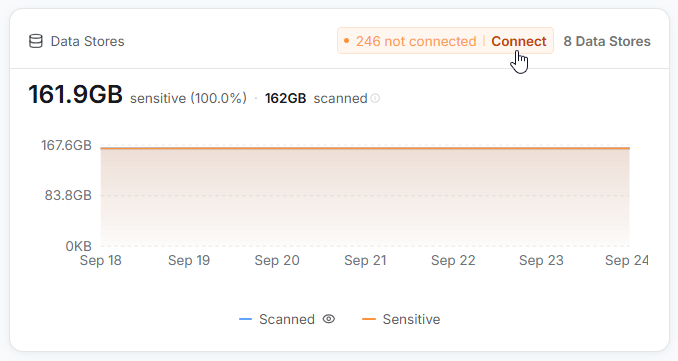
Data Store Summary: Displays the total number of data stores and the total sensitive data size.
-
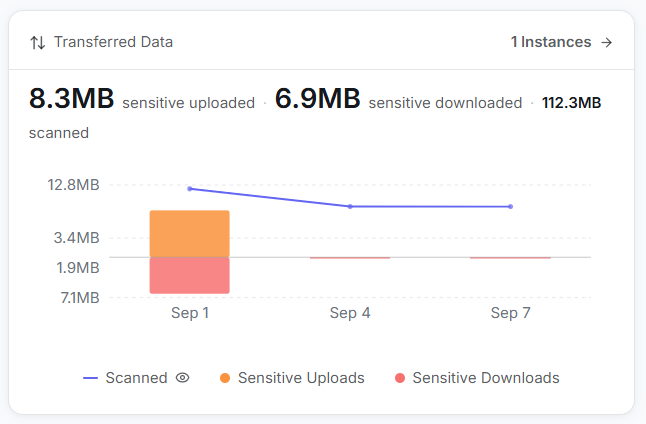
Transferred Data: Displays data in motion metrics for the selected data store, including volume counts for sensitive uploaded, sensitive downloaded, and scanned data. A chart displays trends over time for scanned volume, sensitive uploads, and sensitive downloads, with legend toggles to show or hide each data series. Click the Instances link in the top right of the widget to view the associated application instances.
-
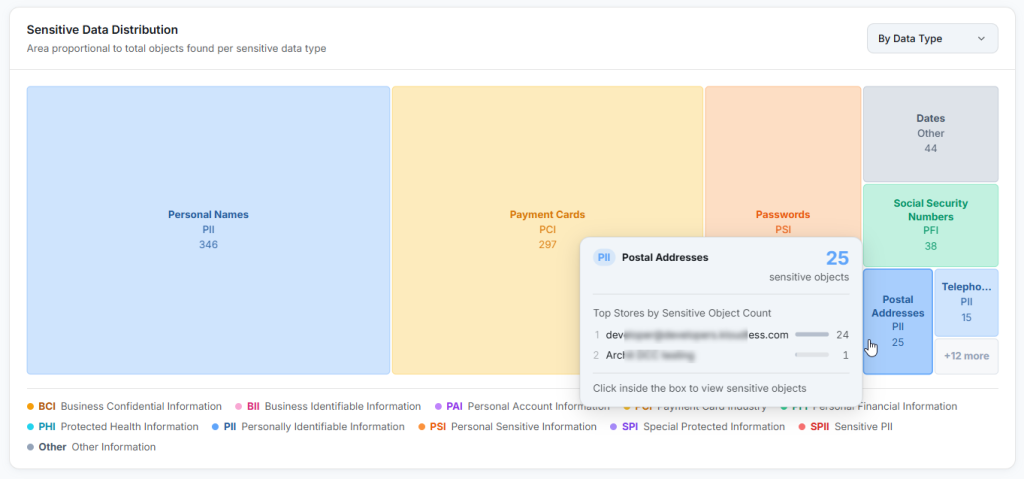
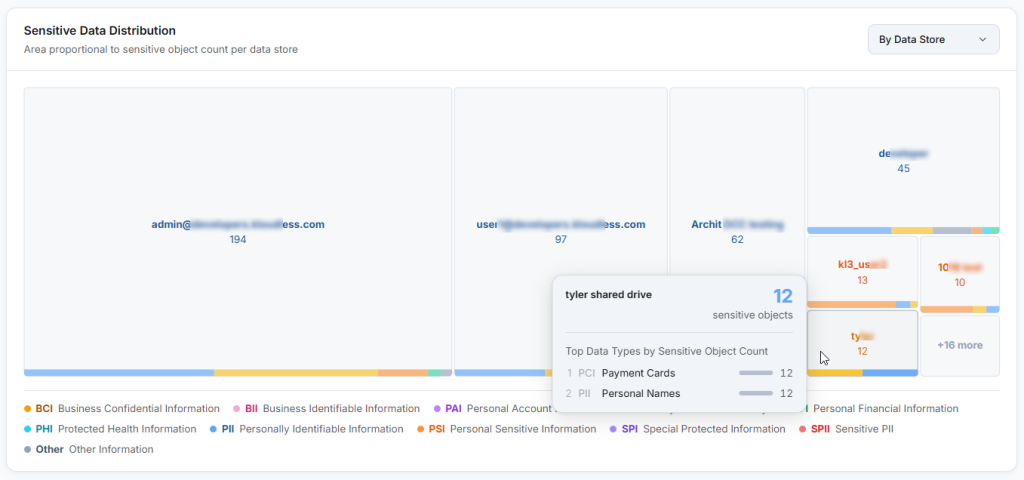
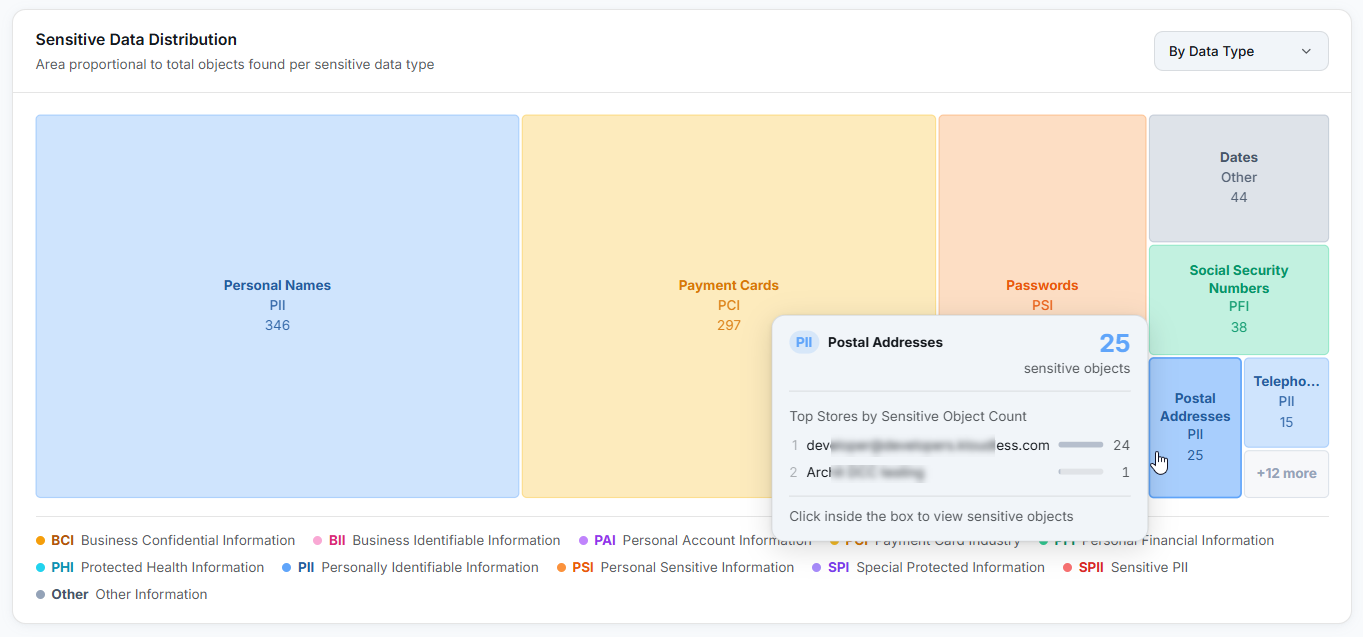
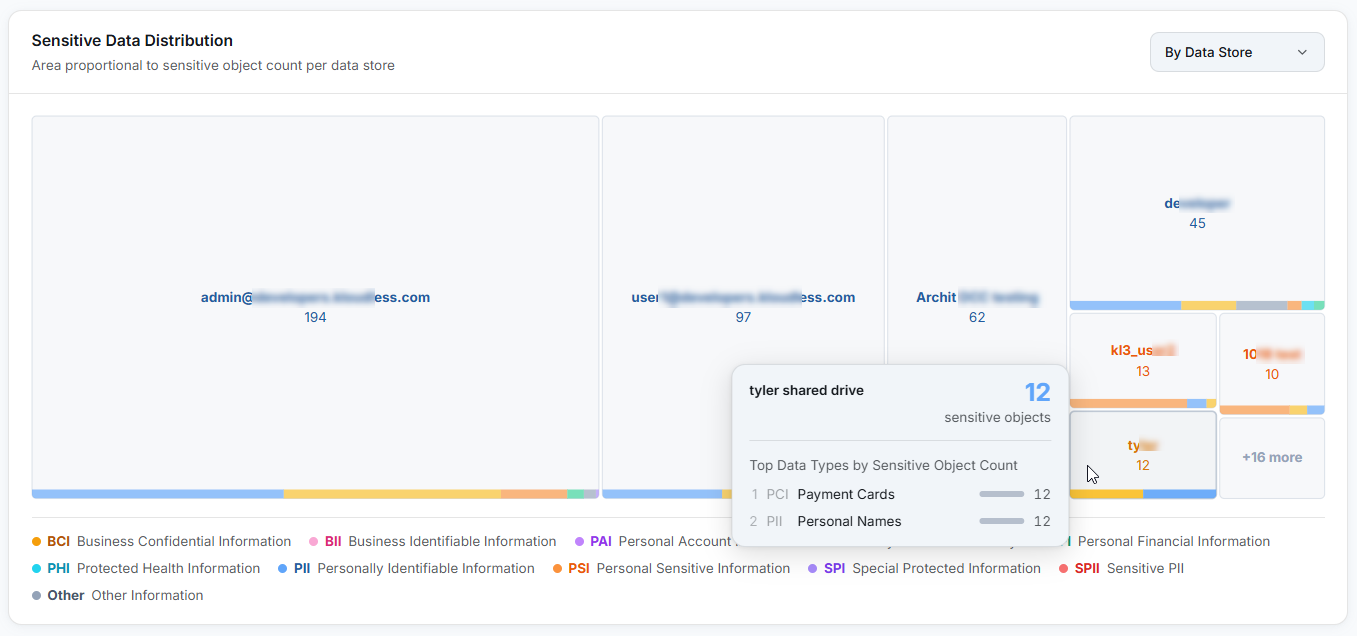
Sensitive Data Distribution: A treemap visualization displays the distribution of sensitive data. You can toggle between two views:
-
Filter By “Data type“: Each segment represents a data type. Hover over a segment to see a breakdown of the top data stores containing that data type.
-
Filter By “Data Store”: Each segment represents a data store. Hover over a segment to see the data types found in that data store.
-
-
Identities with Access: A bar chart shows the count of identities with access to sensitive data, broken down by internal, external, and unlinked users.


Unconnected Data Stores
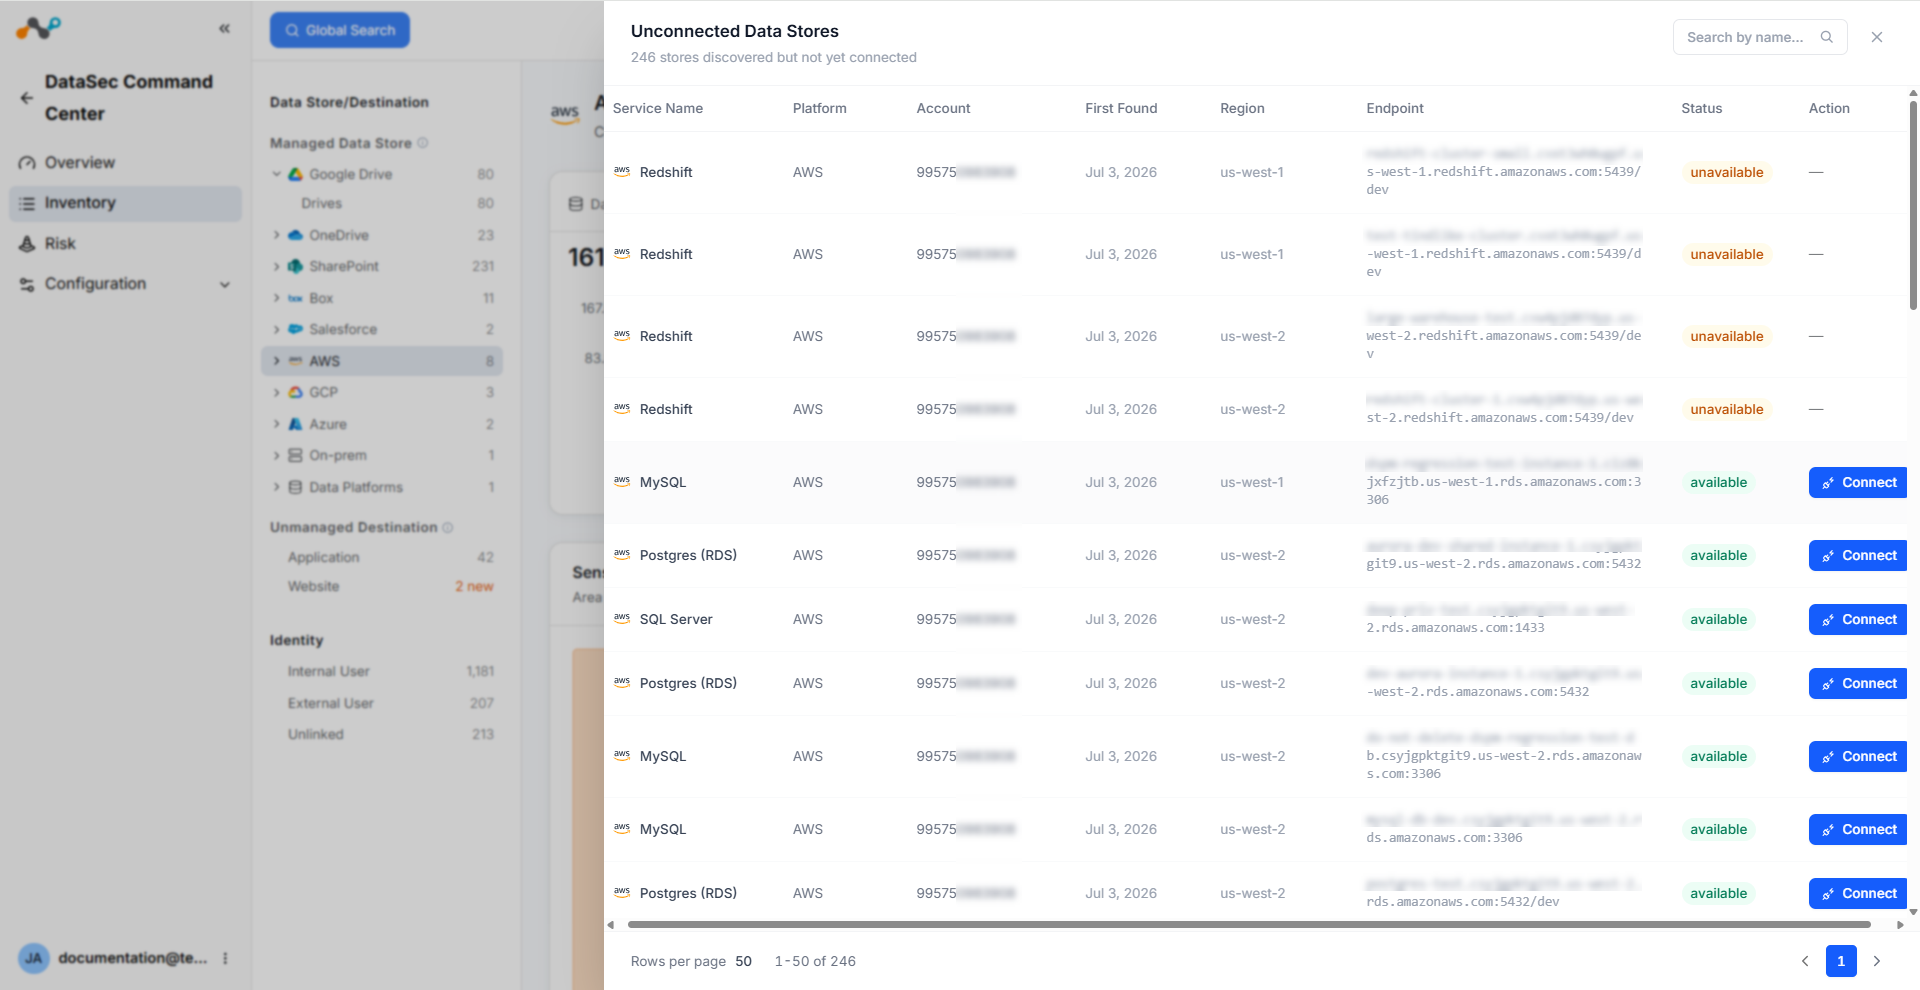
For IaaS data stores, click the “XX not connected” pill in the Data Store Summary section to open a side panel listing data stores that the system discovers but you have not yet connected. Click Connect next to any entry to open the Connecting Data Stores flow in a new tab.
Datastore Table
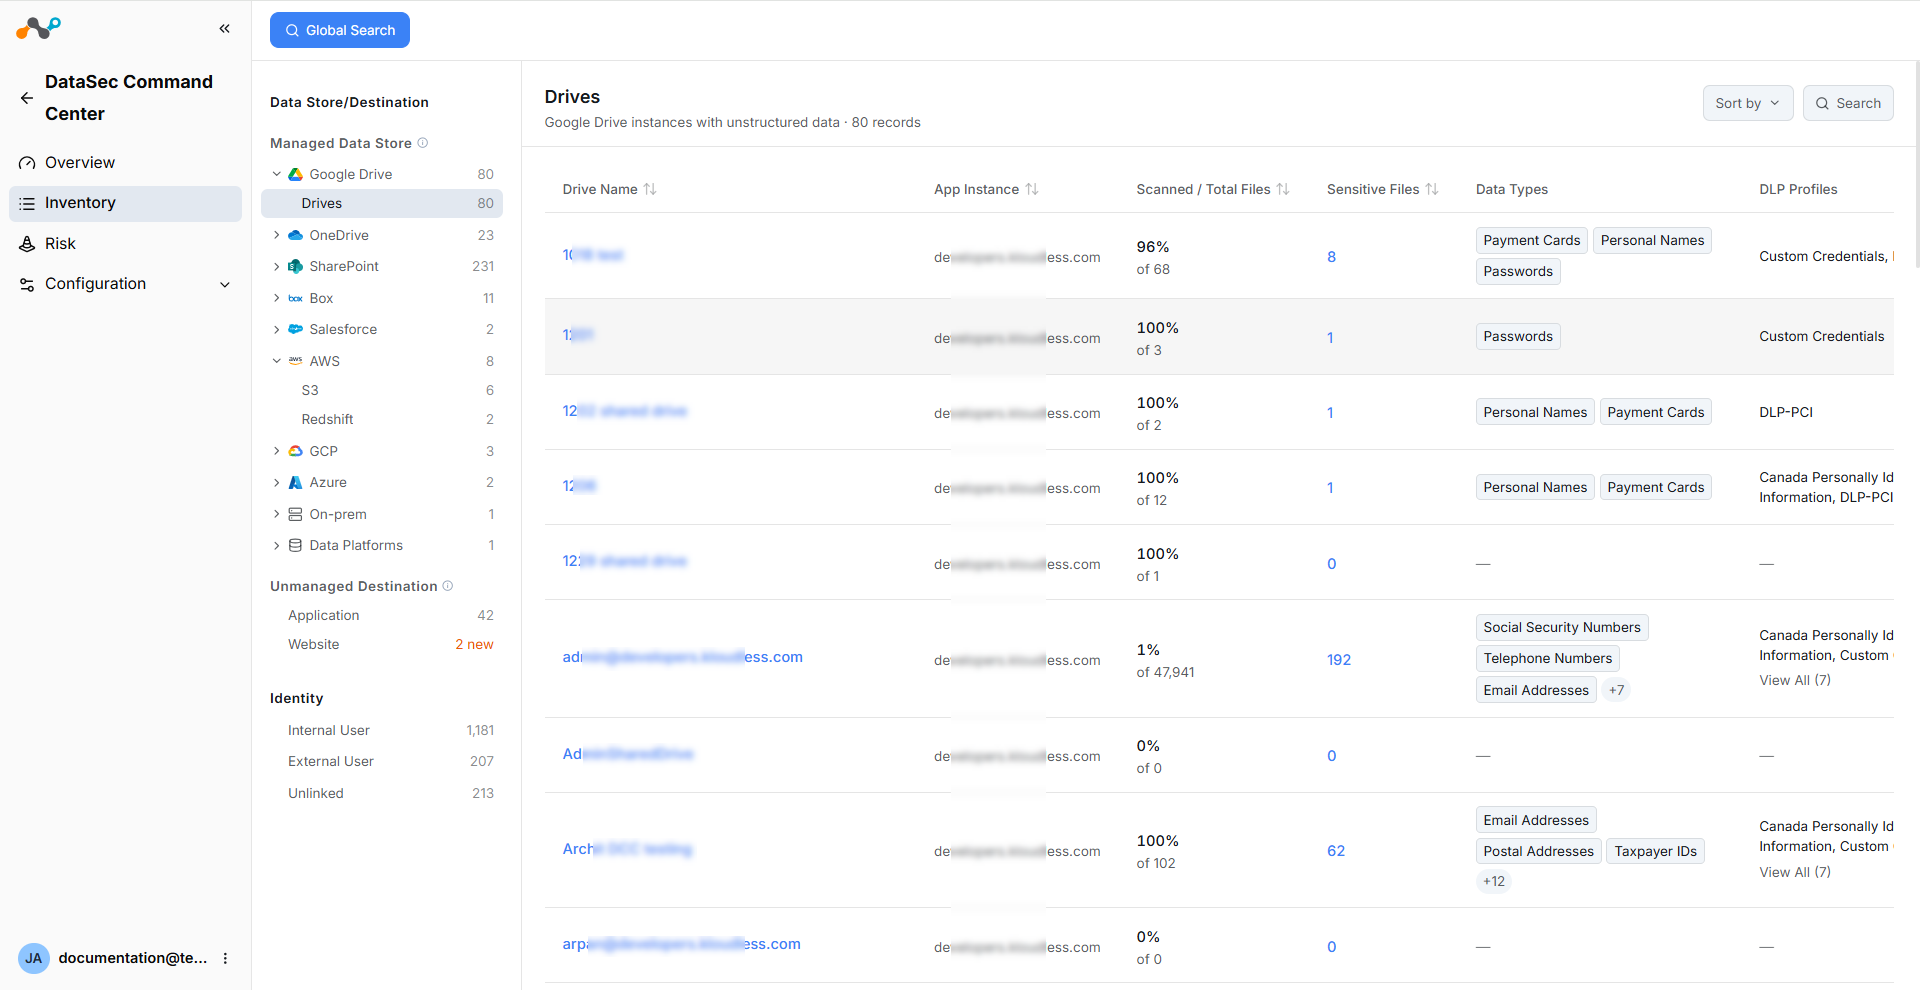
You can find a table lists with all individual data stores below the each data store type/platform:
| Column | Description |
|---|---|
| Drive Name | The name of the individual data store. |
| App Instance | The application instance the data store belongs to. Note: Available for SaaS data stores only. For IaaS data stores, this column displays Account and Org instead. On-premises data stores don’t display an additional column. |
| Scanned / Total Files | The percentage of total files inspected by DLP (Scanned Files / Total Files). Note: This value may not reach 100%… This column reflects discovery scan results only. |
| Sensitive Files | The number of sensitive files detected, shown as a percentage of scanned files. Note: For structured data stores, this column displays sensitive columns instead of sensitive files. |
| Data Types | The number of data type classifications matched. |
| Identities with Access | The number of identities with access to the data store. |
| Total Uploaded (7d) | The volume of sensitive data uploaded out of the total upload volume in the last seven days. A dash indicates no inline data is available. Note: only visible in Unmanaged Destination. |
| Total Downloaded (7d) | The volume of sensitive data downloaded out of the total download volume in the last seven days. A dash indicates no inline data is available. Note: only visible in Unmanaged Destination. |
Data Store Details
Click a data store in the table to open a detailed drill-down view. The drill-down contains three tabs: Overview, Sensitive Files, and Identities with Access.
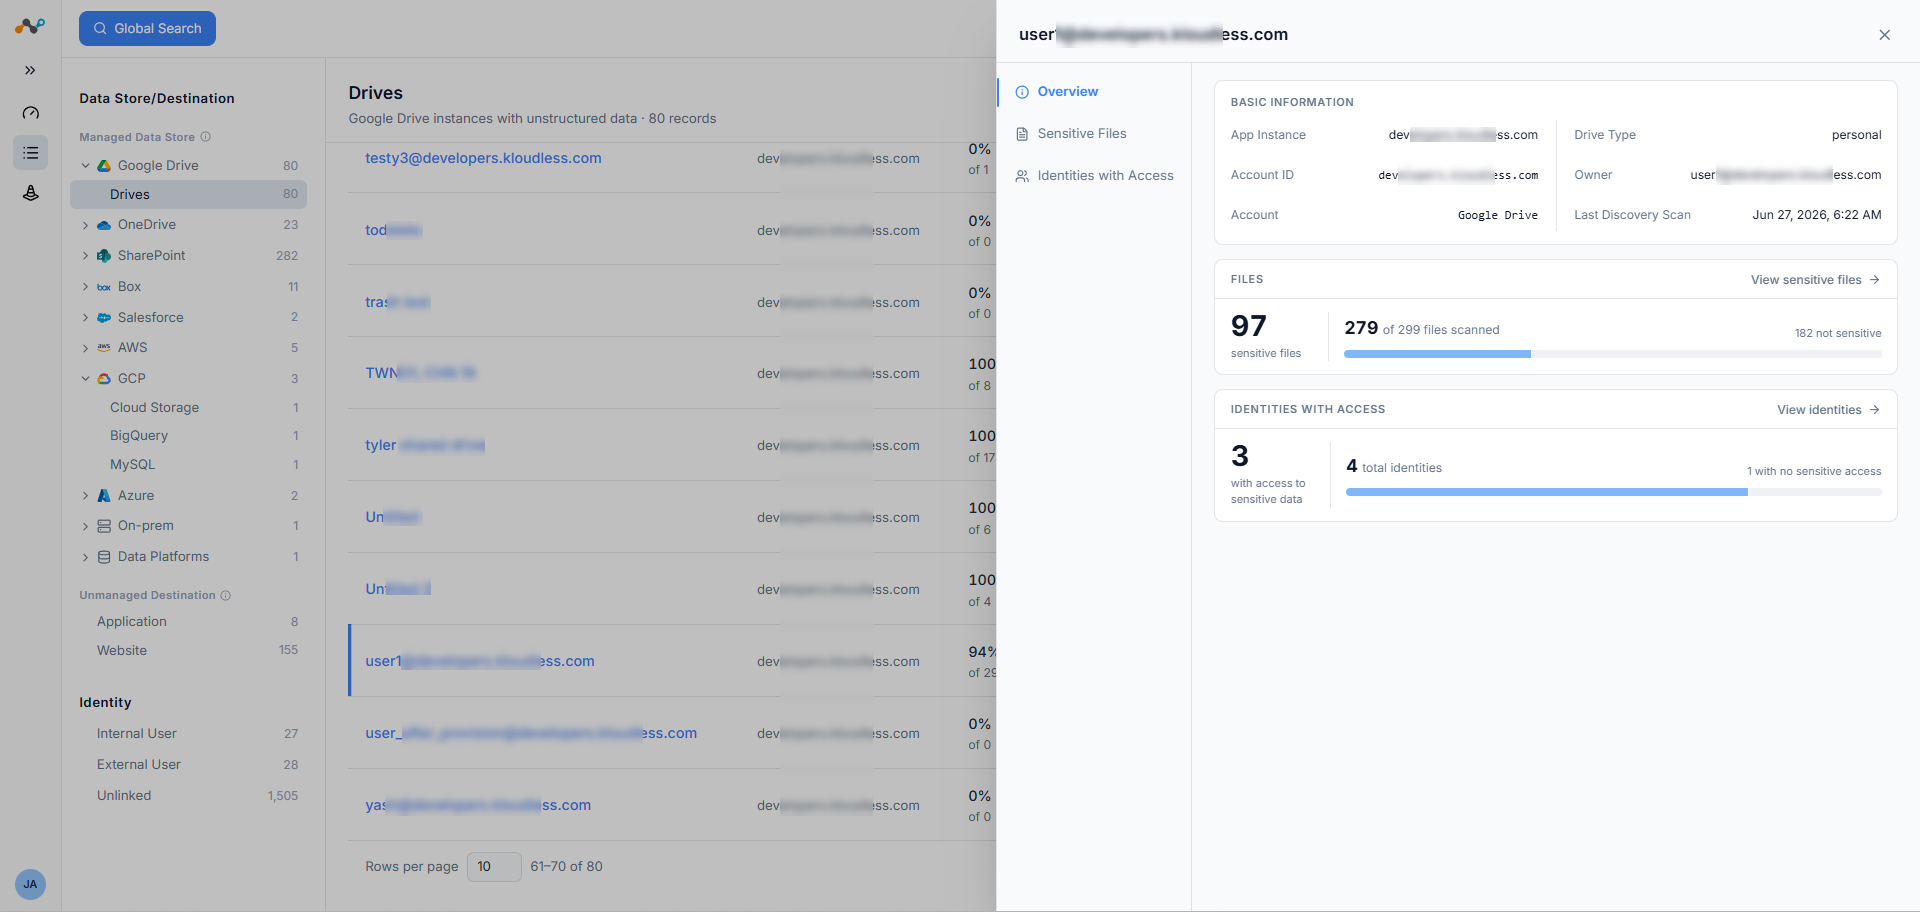
Overview Tab
The Overview tab displays basic information about the data store, including the organization, account, and creation date. It also includes:
- Files widget: A bar chart comparing scanned files versus sensitive files.
- Identity widget: A bar chart comparing identities with sensitive data access versus identities without sensitive data access.
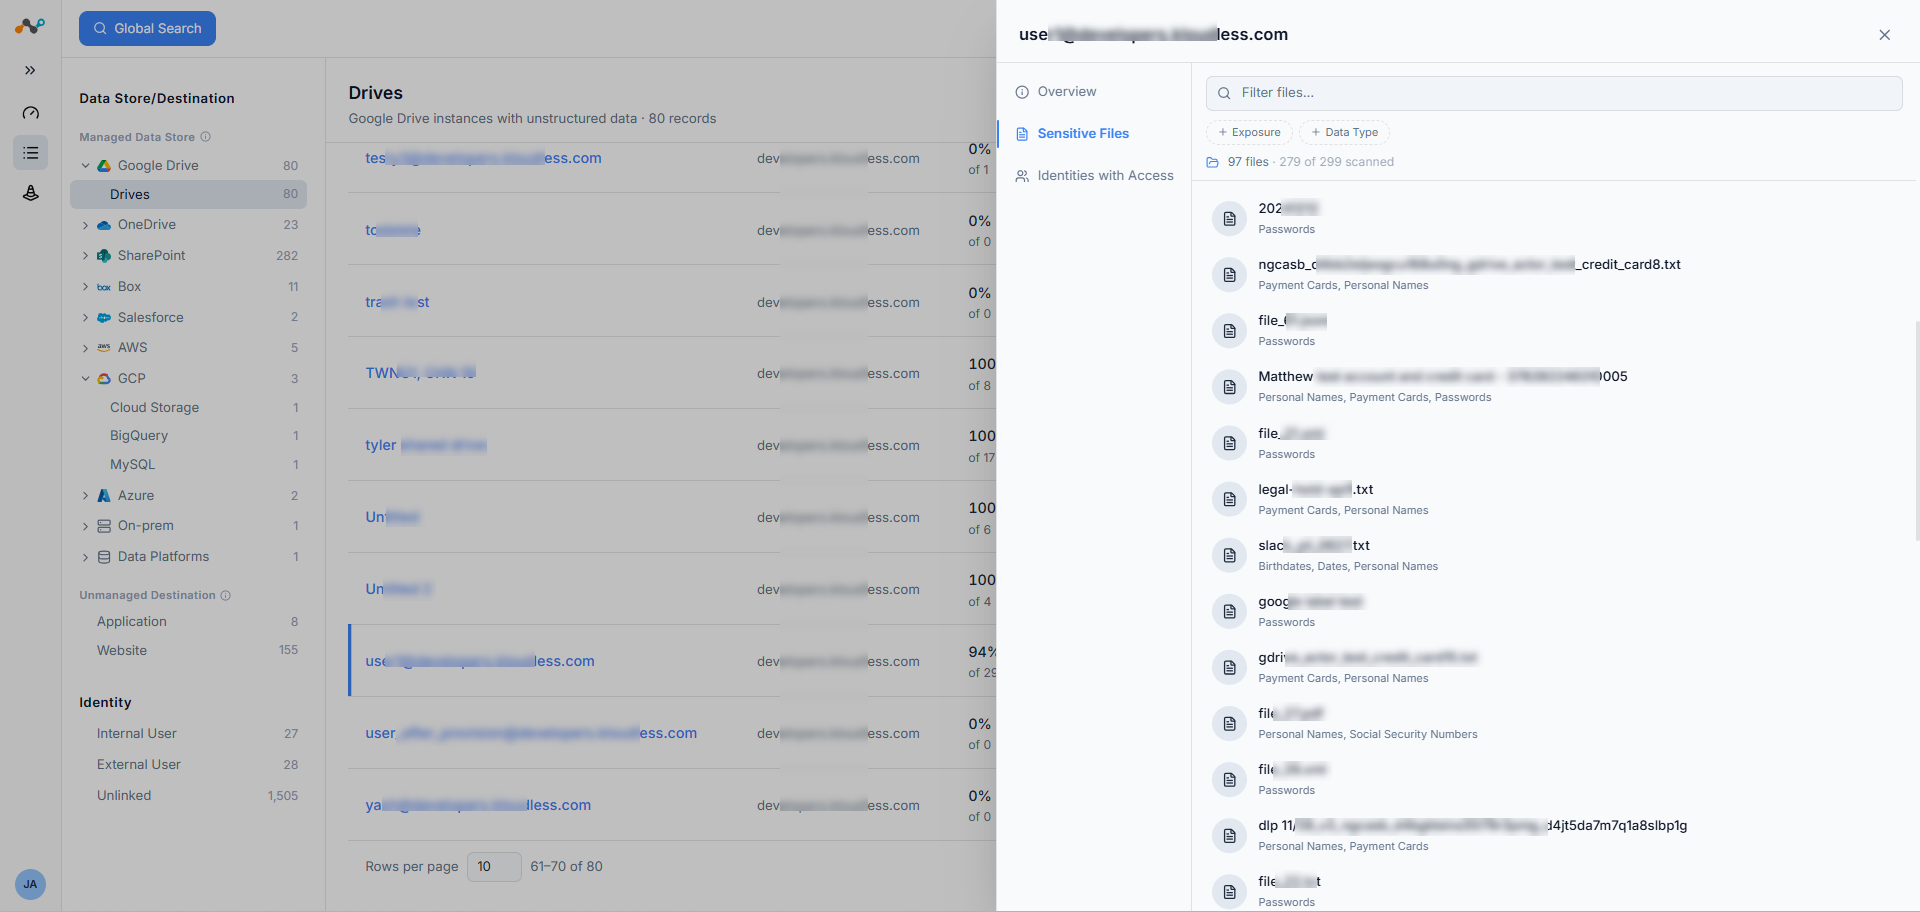
Sensitive Files Tab
The Sensitive Files tab provides detailed visibility into the sensitive files within the data store.
- File Exposure: A bar chart displays the file count by exposure level. The top three exposure levels display by default (e.g., external, worldwide). Click Show All to reveal the remaining levels (e.g., internal, private). Select an exposure level to filter the data type distribution and file list below.
- Data Type Distribution: Displays the distribution of data types for the selected exposure level.
- File List: A filterable list of all sensitive files in the data store. Click a file to open a file details side panel with the following information:
- Data types matched: The data type classifications detected in the file.
- Snippet fetch: Retrieves a content snippet showing the exact match (powered by DSPM).
- Sharing information: The current sharing and permission settings for the file (powered by CASB API).
- Remediation actions: Available for SaaS data stores only (powered by CASB API). Remediation actions update counts in real time; once you remediate a file, the finding count changes accordingly.
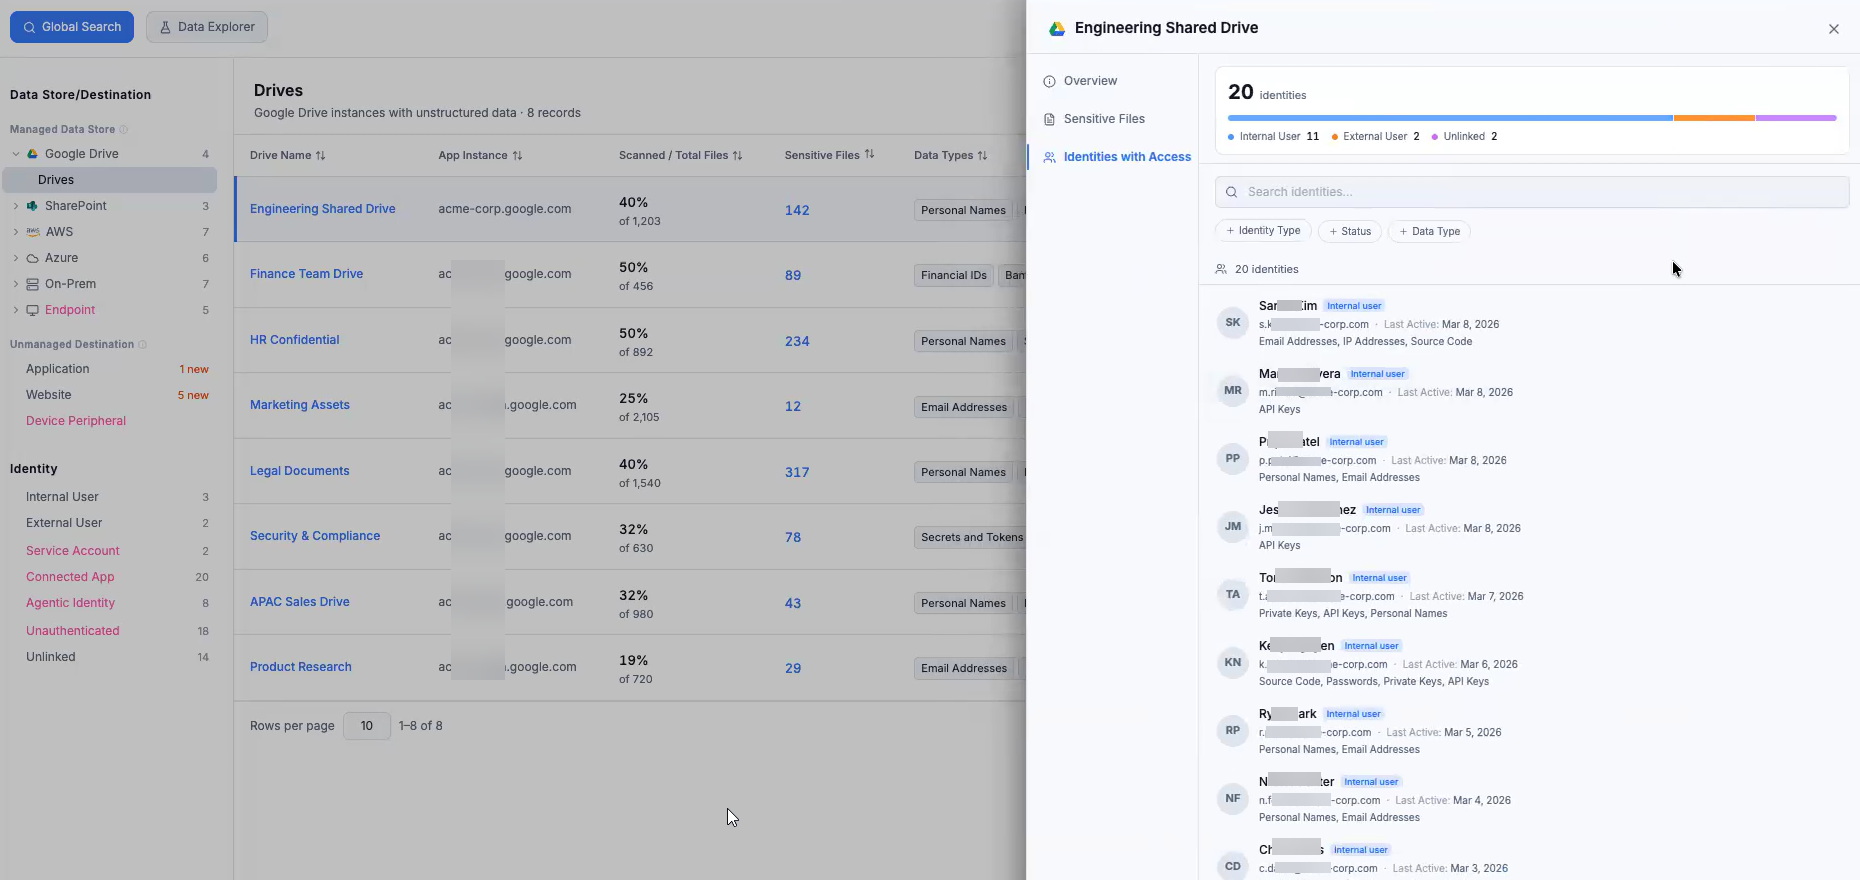
Identities with Access Tab
The Identities with Access tab lists all identities that have access to the data store, showing per-identity details within the context of that specific data store.
Unmanaged Destinations
Unmanaged destinations are applications and websites detected only through Real-Time Protection, without a configured API connection. DCC groups all instances of the same application under a single entry.
Application
This section includes two tabs: Applications and Instances. The Applications tab shows grouped entries by application. The Instances tab provides a breakdown of individual instances within each application.
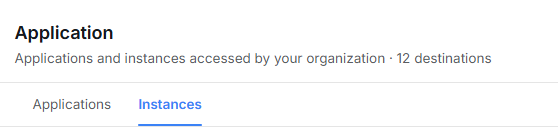
The Applications tab displays the following columns:
| Column | Description |
|---|---|
| Name | The application name and category. |
| Tags | The sanction status of the application (Sanctioned or Unsanctioned). |
| Sensitive Objects | The count of sensitive objects detected. |
| Data Types | The data type classifications matched, displayed as tags. When more than three data types exist, a +N indicator shows the remaining count. |
| Identities | The number of identities that have used the application. |
| First Seen | The date the application was first detected. |
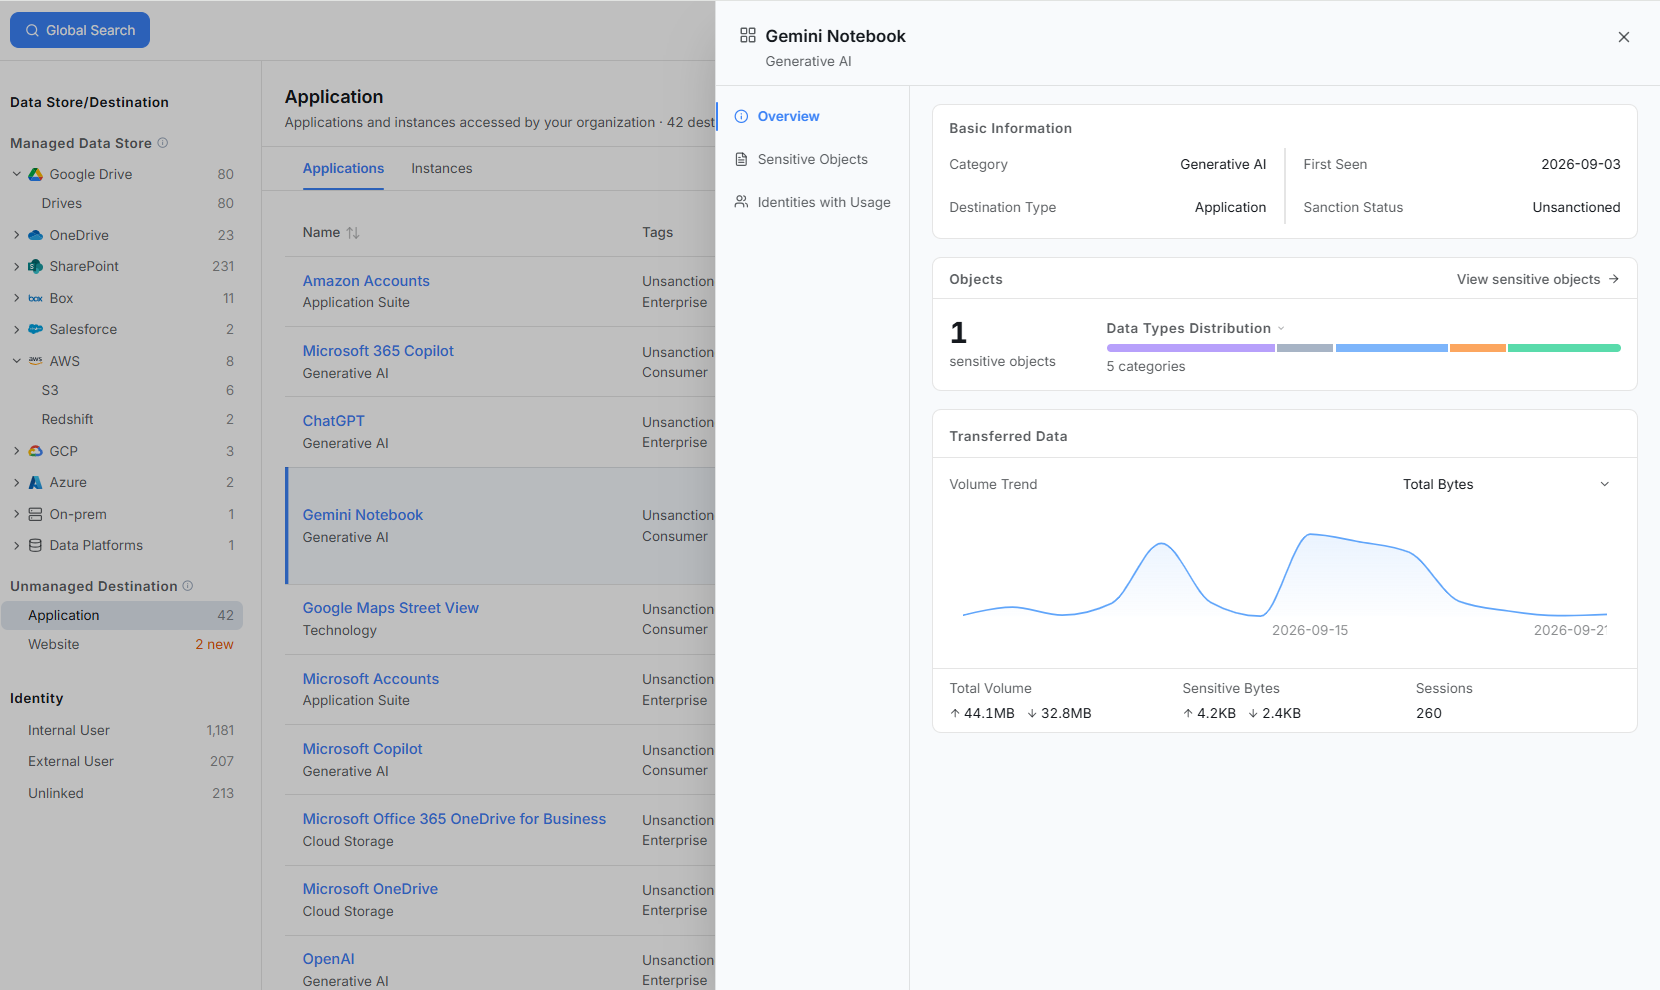
You can filter results by time range, sort order, and search by name. Click an application to open a side panel showing general application information, object breakdown by data type, file details, and identities with usage.
Websites
The Websites tab displays the following columns:
| Column | Description |
|---|---|
| Name | The website URL and category. |
| Sensitive Objects | The count of sensitive objects detected. |
| Data Types | The data type classifications matched, displayed as tags. When more than three data types exist, a +N indicator shows the remaining count. |
| Identities | The number of identities that have accessed the website. |
| Total Uploaded (24h) Total Uploaded (7d) | The volume of data uploaded in the last 24 hours or the last seven days. |
| Total Downloaded (24h) Total Downloaded (7d) | The volume of data downloaded in the last 24 hours or the last seven days. |
| First Seen | The date the website was first detected. |
Click a website to open a side panel with the same detail structure as applications.