

Both read and write access users can view the dashboards. The dashboards provide a high-level overview of each module and provide a view of overall user activity. The Home page has tabs for each of the enabled modules and provides system status information. The System Status dashboard appears by default as the home page after first logging into the Cloud Exchange.
System Status Dashboard
The System Status tab appears by default as the home page after first logging into the Cloud Exchange. The System Status Dashboard provides a comprehensive view of your Cloud Exchange environment with the following sections: 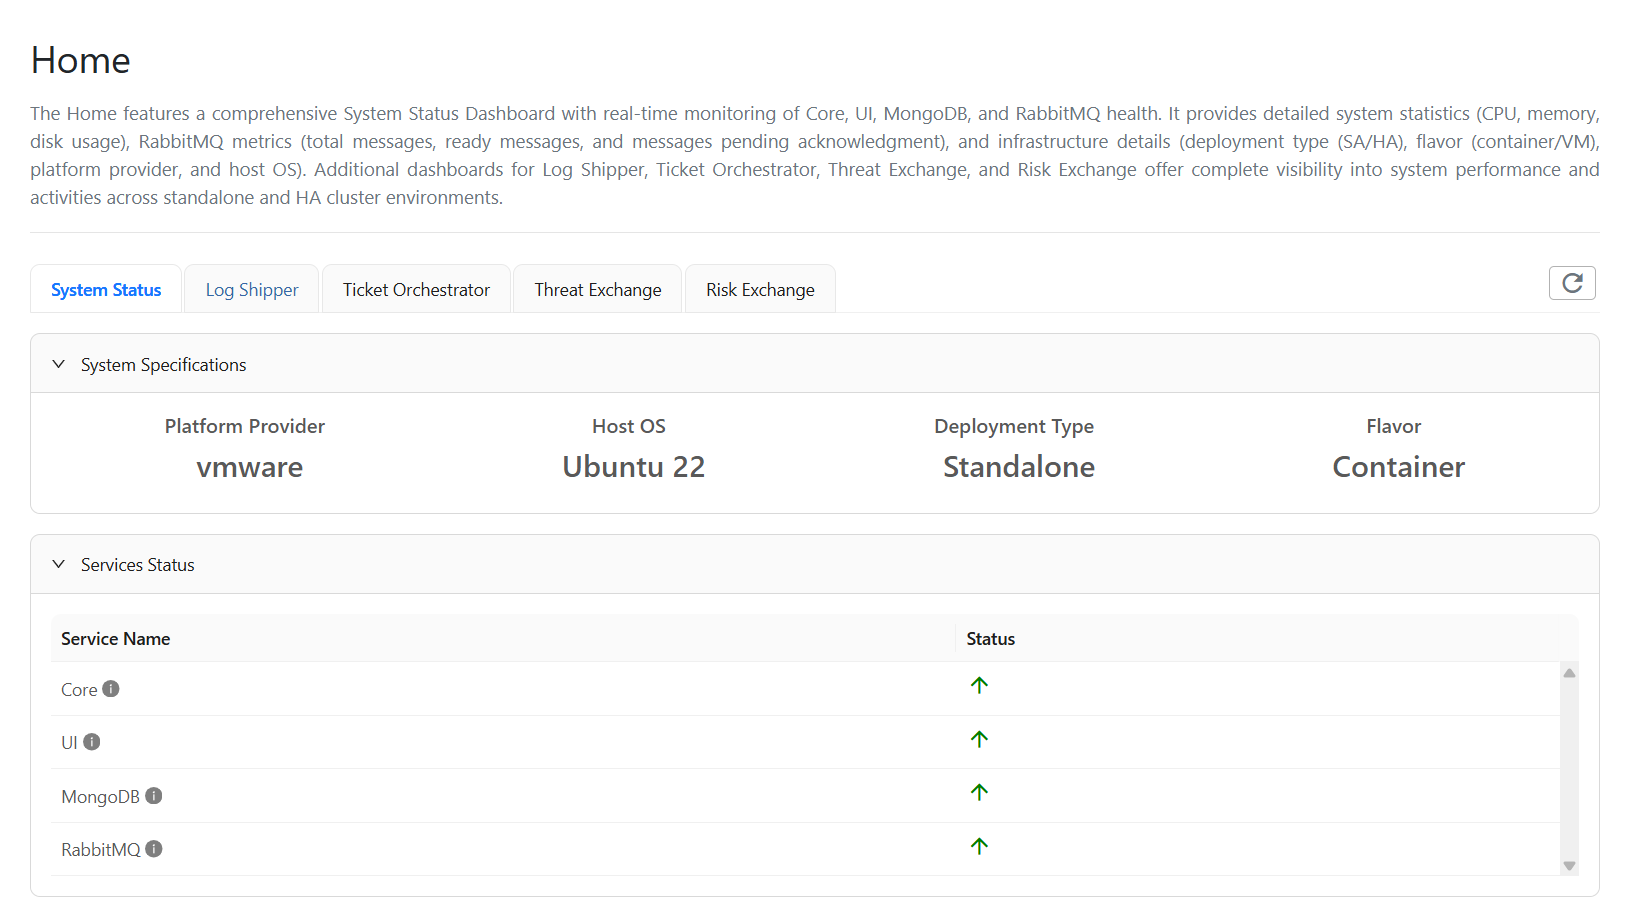
System Specifications
The System Specifications section displays key infrastructure details about your Cloud Exchange deployment:
- Platform Provider: Shows the virtualization platform (like VMware).
- Host OS: Displays the operating system and version (like Ubuntu 22)
- Deployment Type: Indicates whether the deployment is Standalone or part of an HA cluster.
- Flavor: Shows the deployment method (like Container or VM).
Services Status
The Services Status section shows all the services running on the system, with an appropriate Up and Down arrow based on active status. When the service is up, respective service status will have a green colored up arrow. When the service is down, respective service status will have a red colored down arrow.
System Stats
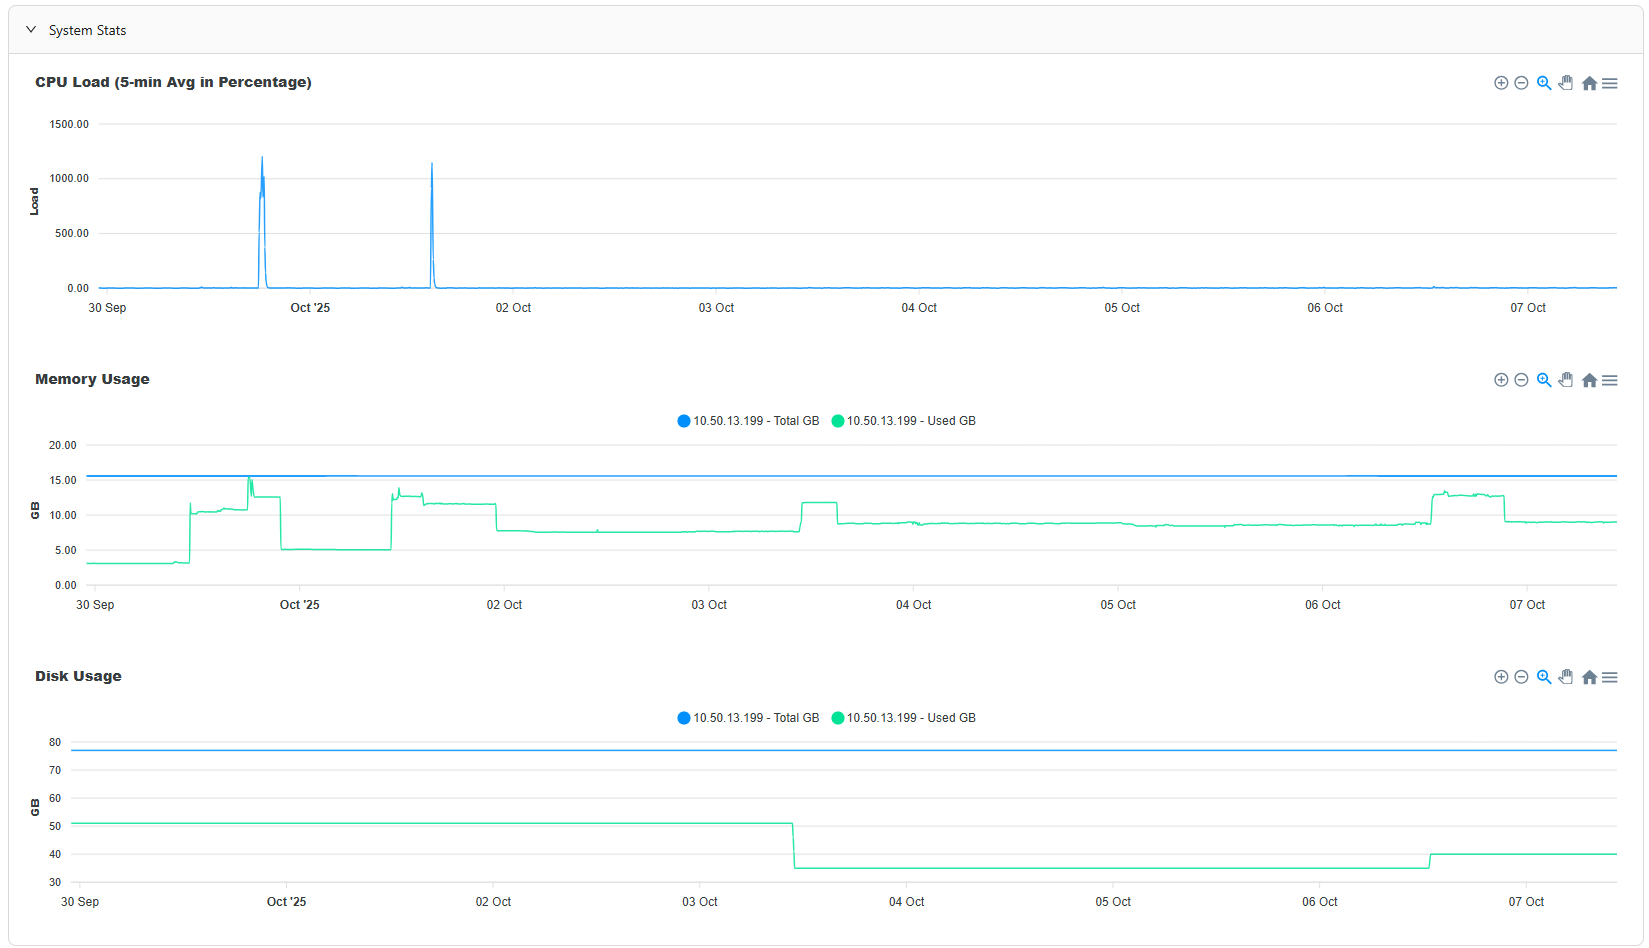
The System Stats section provides real-time performance metrics with 5-minute average line charts for:
- CPU Load: Shows CPU utilization percentage over time.
- Memory Usage: Displays both total and used memory in GB.
- Disk Usage: Shows both total and used disk space in GB.
Queues Details

The Queues Details section provides information about the RabbitMQ message queues:
- Queue Name: The name of the message queue.
- State: Current state of the queue (Running/Stopped).
- Messages: Shows message counts with three sub-columns:
- Total: Total number of messages in the queue.
- Ready: Number of messages ready to be delivered.
- Pending Ack: Number of messages waiting for acknowledgment.
Click Refresh in the top right corner to get the latest system and service status updates.
Log Shipper Dashboard
Click the Log Shipper tab.
The Log Shipper Dashboard is organized into the following sections:
Summary
The Summary section provides an overview of key metrics with clickable elements that navigate to their respective detailed views

- Total Configured Plugins: Shows the total number of configured plug-ins contributing ingestion of logs to CLS.
- Total Alerts/Events/WebTX Sent to External Receiver: Based on the filter it shows the total number of logs sent.
- All Time: Shows the total number of alerts/events/webtx sent.
- Last 10 Minutes: Shows total number of alerts/events/webtx sent in the last 10 minutes.
- Last 30 Minutes: Shows total number of alerts/events/webtx sent in the last 30 minutes.
- Last 60 Minutes: Shows total number of alerts/events/webtx sent in the last 60 minutes.
- Total WebTx Sent to External Receiver: Based on the filter it shows the WebTx bytes counts sent to sent to External receiver
- All Time: Shows total number of webtx data sent in bytes.Last 10 Minutes: Shows total number of webtx bytes count sent in the last 10 minutes.Last 30 Minutes: Shows total number of webtx bytes count sent in the last 30 minutes.Last 60 Minutes: Shows total number of webtx bytes count sent in the last 60 minutes.
Plugin Status
The Plugin Status section displays a table with information about all configured plugins:
- Name: The name of the configuration.
- Plugin: The Name of plugin/product.
- Status: Current status of the plugin (Enabled or Disabled).
Alert/Event/WebTx Sent
This section provides a configurable bar chart visualization of data transmission metrics with the following filter options:
- Destination Type: Toggle between External Receiver and Storage Buckets.
- Type: Select the type of data (Alerts, Events, Logs, WebTx).
- Destination: Select specific plugin destinations.
- Sub Types: Multi-select filter for data subtypes.
- Time Range: Filter by time period (All Time, Last 10 Minutes, Last 30 Minutes, Last 60 Minutes, or Custom)
The chart displays color-coded bars representing different data categories:
- Sent (data successfully transmitted).
- Pulled & Filtered (data processed but filtered).
- Mismatch (data that didn’t match expected format)

Ticket Orchestrator Dashboard
Click the Ticket Orchestrator tab to view overall user activity and ticket management information.
The Ticket Orchestrator Dashboard is organized into the following sections:
Summary
The Summary section provides an overview of key metrics with clickable elements that navigate to their respective detailed views:
- Total Configured Plugins: Shows the total number of configured plugins for ticket orchestration.
- Total Alerts Stored: Displays the total number of alerts stored in the system.
- Total Events Stored: Shows the total number of events stored in the system.
- Total Tickets Created: Shows the total number of tickets created across all connected ticketing systems.
- Total Duplicate Tickets: Shows the number of duplicate tickets that have been automatically identified.

Plugin Status
The Plugin Status section displays a table with information about all configured ticketing plugins:
- Name: The name of the configuration.
- Plugin: The name of plugin/product.
- Status: Current status of the plugin (Enabled or Disabled).
Ticket Status Overview
This section shows a bar chart visualization of ticket metrics with the following filter options:
- Type: Select the type of data (Alerts, Events).
- Destination: Select specific plugin destinations (like Jira).
- Sub Types: Multi-select filter for alert/event subtypes (e.g., anomaly, c2, Compromised, Content, CRE).
- Time Range: Filter by time period (All Time or custom ranges)
The chart displays the count of tickets based on the selected filters.

Recent Alerts Panel: Lists the 10 most recent alerts reported by the Netskope tenant and other sources, with their IDs, names, types (such as DLP or c2), and associated application categories.
Recent Events Panel: Lists the 10 most recent events with event IDs, types (like incident), and associated users.
Recently Created Tickets Panel: Lists the 10 most recent tickets with the ITSM ticket ID, associated alert/event IDs, alert names, current status, and external links to view tickets in their respective ticketing systems. Only alerts that match a ticket flow will create a ticket.
Overall Status of Tickets Created Panel: Shows a pie chart with the distribution of tickets by status categories, giving a quick visual overview of the current ticket status breakdown.

Threat Exchange Dashboard
Threat Exchange is a rules-based engine for collecting and sharing indicators related to file hashes of malicious software (malware), file hashes of files used in Netskope DLP policy for absolute matching, or URLs used by plugged in systems for policy enforcement of restricted or allowed access.
Click the Threat Exchange tab to view the dashboard.
The Threat Exchange Dashboard is organized into the following sections:
Summary
The Summary section provides an overview of key metrics with clickable elements:
- Total Configured Plugins: Shows the total number of configured plugins contributing data to Threat Exchange.
- Total Active IoCs: Shows the number of total active (not disabled) indicators in the Threat Exchange database.
- IoCs Reported In Last 7 Days: Shows the number of active indicators delivered to Threat Exchange in the previous seven days.
Note
Although an indicator could have been recently obtained by Threat Exchange, no event will contribute to the count if the metadata timestamp delivered with the IoC entry is from a period earlier than seven days.
Plugin Status
The Plugin Status section shows a table of all configured threat intelligence plugins with their configuration names, names, and current status (Enabled or Disabled).
IoCs Overview
This section provides a configurable bar chart visualization of Indicators of Compromise (IoCs) with the following filter options:
- View Selection: Toggle between Pulled IoCs and Shared IoCs.
- IoC Type: Multi-select filter for IoC types (MD5, SHA2, IPv4, IPv6, Hostname, Domain, FQDN, URL).
- Plugin Source Configuration: Filter IoCs by specific plugin sources or view all.
- Retraction: Filter to include or exclude retracted IoCs.
The chart displays a stacked bar representation of IoCs by type and source, with color-coding to distinguish between different plugin sources.

Top 10 Active IoCs by External Hits
This section displays a table showing the top 10 indicators that all plugins have matched against, sorted by the number of external hits. The table includes:
- Value: The actual IoC value.
- Type: The type of IoC (md5, sha256, url, etc.).
- Hits: The number of times this IoC has been seen by non-Netskope connectors.

Top 10 Active IoCs by Reputation
This section shows a table of the top 10 active indicators sorted by reputation score. The table includes:
- Value: The actual IoC value.
- Type: The type of IoC (md5, sha256, domain, etc.).
- Reputation: The reputation score assigned to the IoC.

Note
If the Indicators are getting migrated, you will see this message in UI, Migration procedure is currently under progress, there won’t be any functionality issues as a result. This message will be removed from the UI after the migration of indicators is completed.
Risk Exchange Dashboard
Click the Risk Exchange tab to view overall user activity.
The Risk Exchange Dashboard contains the following information:
Summary
The Summary section provides an overview of key metrics:
- Total Record Sources: How many vendor plugins have been configured and connected.
- Total Records Fetched: For each entity (Entity Name), shows how many records have been fetched for each table.
- Total Actions Performed: The total number of actions performed on hosts, applications and users.

Plugin Status
The Plugin Status section shows a table of all configured risk exchange plugins with their names, types, and current status.
- Name: The name of the configuration.
- Plugin: The Name of plugin/platform.
- Status: Current status of the plugin (Enabled or Disabled).

CRE Analytics Overview
The CRE Analytics Overview section provides detailed visualizations of pulled records and action logs through two interactive tabs.
Pulled Records Tab
This tab displays a bar chart showing the number of records pulled for each entity with the following features:
Filters:
- Entity: Multi-select filter to view records for specific entities. All entities are selected by default.
- Time Range: Filter by time period (All Time, Last 10 Minutes, Last 30 Minutes, Last 60 Minutes, or Custom Range)
- Custom Range: When “Custom Range” is selected, specify exact start and end dates with time.
Chart Details:
- Each bar represents an entity, and the height of the bar indicates the total number of records pulled for that entity.
- Click on any bar to navigate to the Records page with the selected entity and time range filters applied.
- Data labels show the exact record count above each bar.
Action Logs Tab
This tab displays a stacked bar chart showing action counts broken down by status with the following features:
Filters:
- Business Rule: Select a specific business rule to filter action records.
- Destination Plugin: Select a destination plugin to filter actions.
- Actions: Multi-select filter to view specific action types. All actions are selected by default.
- Time Range: Filter by time period (All Time, Last 10 Minutes, Last 30 Minutes, Last 60 Minutes, or Custom Range)
- Custom Range: When “Custom Range” is selected, specify exact start and end dates with time.
Chart Details:
- Each bar represents an action name, with bars stacked by status with color coding:
- Green: Success
- Red: Failed
- Orange: Pending Approval
- Blue: Scheduled
- Purple: Declined
- Click on any bar segment to navigate to the Action Logs page with the selected filters applied.
- Total count is displayed above each bar.
- Legend allows toggling visibility of specific status categories.
Exact Data Match Dashboard
Click the Exact Data Match tab to view overall user activity.
The Exact Data Match dashboard contains the following information.
Summary
The Summary section provides an overview of key metrics:
- Total Configured Plugins: How many vendor plugins have been configured.
- Total EDM Hash Sources: Total Number of sources for EDM hashes.
- Total EDM Hashes Shared: The total number of EDM hashes shared.
- Total EDM Hashes Received: Total number of EDM hashes received.

Plugin Status
The Plugin Status section shows a table of all configured CFC plugins with their names, types, and current status.
- Name: The name of the configuration.
- Plugin: The Name of plugin/platform.
- Status: Current status of the plugin (Enabled or Disabled).
Recent Plugin Updates
The Recent Plugin Updates section shows a table of all recent updated plugins with plugin name.
- Plugin: The Name of the plugin.
- Last Updated By: Displays the user who last updated the plugin.
- Last Updated At: Displays the time when the plugin was last updated.
Hashes Upload Distribution by Netskope CE/Tenant
The Hashes Upload Distribution by Netskope CE/Tenant shows the pie chart for hashes upload distribution by Netskope CE/Tenant.
Manual CSV Hashing and Upload Status
The Manual CSV Hashing and Upload Status shows the file name, target and upload status.
- Name: Name of the CSV hashing file.
- Target: Specifies the target plugin with which the user shared the file.
- Status: Status shows whether upload is Completed or Failed.
Hashes Shared to Another Netskope CE/Tenant
The Hashes Shared to Another Netskope CE/Tenant shows a table of all the hashes shared to another Netskope CE.
- File Name: Hashing File Name.
- Configuration Name: Configuration Name with which the hashes shared.
- Last Shared At: Indicates the time when the hashes were shared.
Hashes Received from Another Netskope CE
The Hashes Received from Another Netskope CE shows a table for the hashes received from another Netskope CE.
- File Name: The name of the file hashing file.
- Configuration Name: Configuration Name from which hashes received.
- Last Received At: Indicated the time when the hashes were received.
Custom File Classification Dashboard
Click the Custom File Classification tab to view overall user activity.
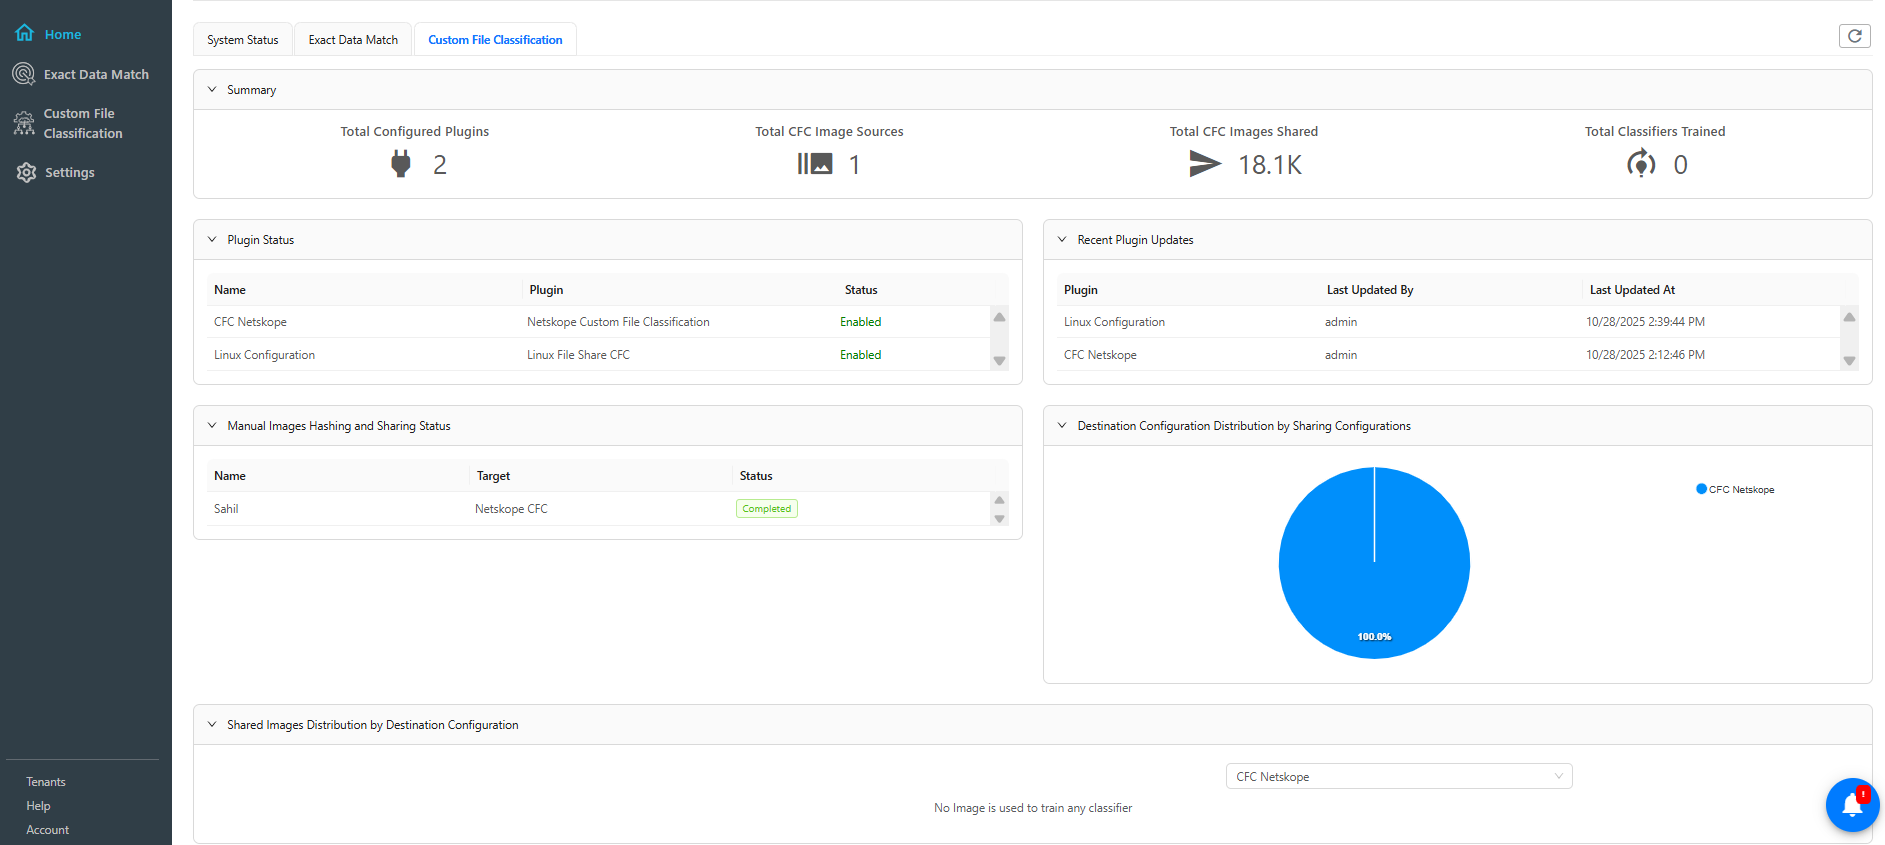
The Custom File Classification dashboard contains the following information.
Summary
The Summary section provides an overview of key metrics:
- Total Configured Plugins: How many vendor plugins have been configured.
- Total CFC Image Sources: Total Configured Image Sources.
- Total CFC images Shared: The total number of images shared.
- Total Classifiers Trained: Total number of classifier trained.
Plugin Status
The Plugin Status section shows a table of all configured CFC plugins with their names, types, and current status.
- Name: The name of the configuration.
- Plugin: The Name of plugin/platform.
- Status: Current status of the plugin (Enabled or Disabled).
Recent Plugin Updates
The Recent Plugin Updates section shows a table of all recent updated plugins with plugin name.
- Plugin: The Name of the plugin.
- Last Updated By: Displays the user who last updated the plugin.
- Last Updated At: Displays the time when the plugin was last updated.
Manual Images Hashing and Sharing Status
The Manual Images Hashing and Sharing Status section shows a table of all the manual images hashing with their sharing status.
- Name: Name of the user who shared the file.
- Target :Specifies the target plugin with which the user shared the file.
- Status : Status shows whether sharing Completed or Failed.
Destination Configuration Distribution by Sharing Configurations
The Destination Configuration Distribution by Sharing Configurations shows the pie chart for destination configurations.
Shared Images Distribution by Destination Configuration
The Shared Images Distribution by Destination Configuration shows the number of images used to train any classifier and can select the plugin from the dropdown.
Warning Messages
- If available disk space will reach below 35% then it will show following warning message in the UI. “You’re running out of disk space on your host. The available disk space is {available_space}%. The new data pull from Netskope will be paused soon. Please free up your disk space or provide additional disk space to resume the pulling. Refer to the Netskope Cloud Exchange sizing recommendations..”

- If available disk space will reach below 20% then the UI will display red banner warning with following message: “You’re running out of disk space on your host. The available disk space ({available_space}%) is critically low. The new data pull from Netskope has been paused. You will have to free up the disk space or provision additional disk space to make the available disk space more than 35% of the total disk space to resume the pulling. Refer to the Netskope Cloud Exchange sizing recommendations.”

- If the V2 API token has expired for the Netskope tenant, a red banner will appear with the following message: “The Netskope tenant API token has expired for Alliances Netskope. generate the new token or re-issue the token and update the tenant configuration to resume communication between Netskope Tenant and Cloud Exchange.”

- If the V2 API token is revoked or deleted from the Netskope platform, or if the token does not have all the necessary privileges, the following error message will be displayed: “Netskope API token of <TENANT_NAME> has been revoked, deleted or has insufficient privileges to continue pulling alerts and events from Netskope. Please check the required privileges and ensure that your API token has the necessary permissions to access the required resources.”

- When Cloud Exchange is unable to establish a connection with Netskope Analytics (https://reporting.netskope.tech), a yellow warning banner message will appear on the Cloud Exchange Settings Page with following message: “Unable to establish a connection with https://reporting.netskope.tech. Verify the network connectivity, proxy settings or firewall configurations to address the connectivity issues for enhanced product deployment and administration experience.”
