

The connection graph shows how an AI asset connects to other assets, identities, and devices, and overlays the findings that affect those connections. For example, an MCP server can connect to clients, devices, users, agents, and tools.
Opening the Connection Graph
You can open the connection graph from two places.
To open the graph from the Overview page:
- In Sonar or the entity list, click an asset.
The detail view for the asset opens, including the connection graph.
To open the graph from the Inventory page:
- In the Inventory page, click an asset in an asset list to open its details panel.
- In the connection graph preview, open the complete view.
The connection graph for the asset opens.
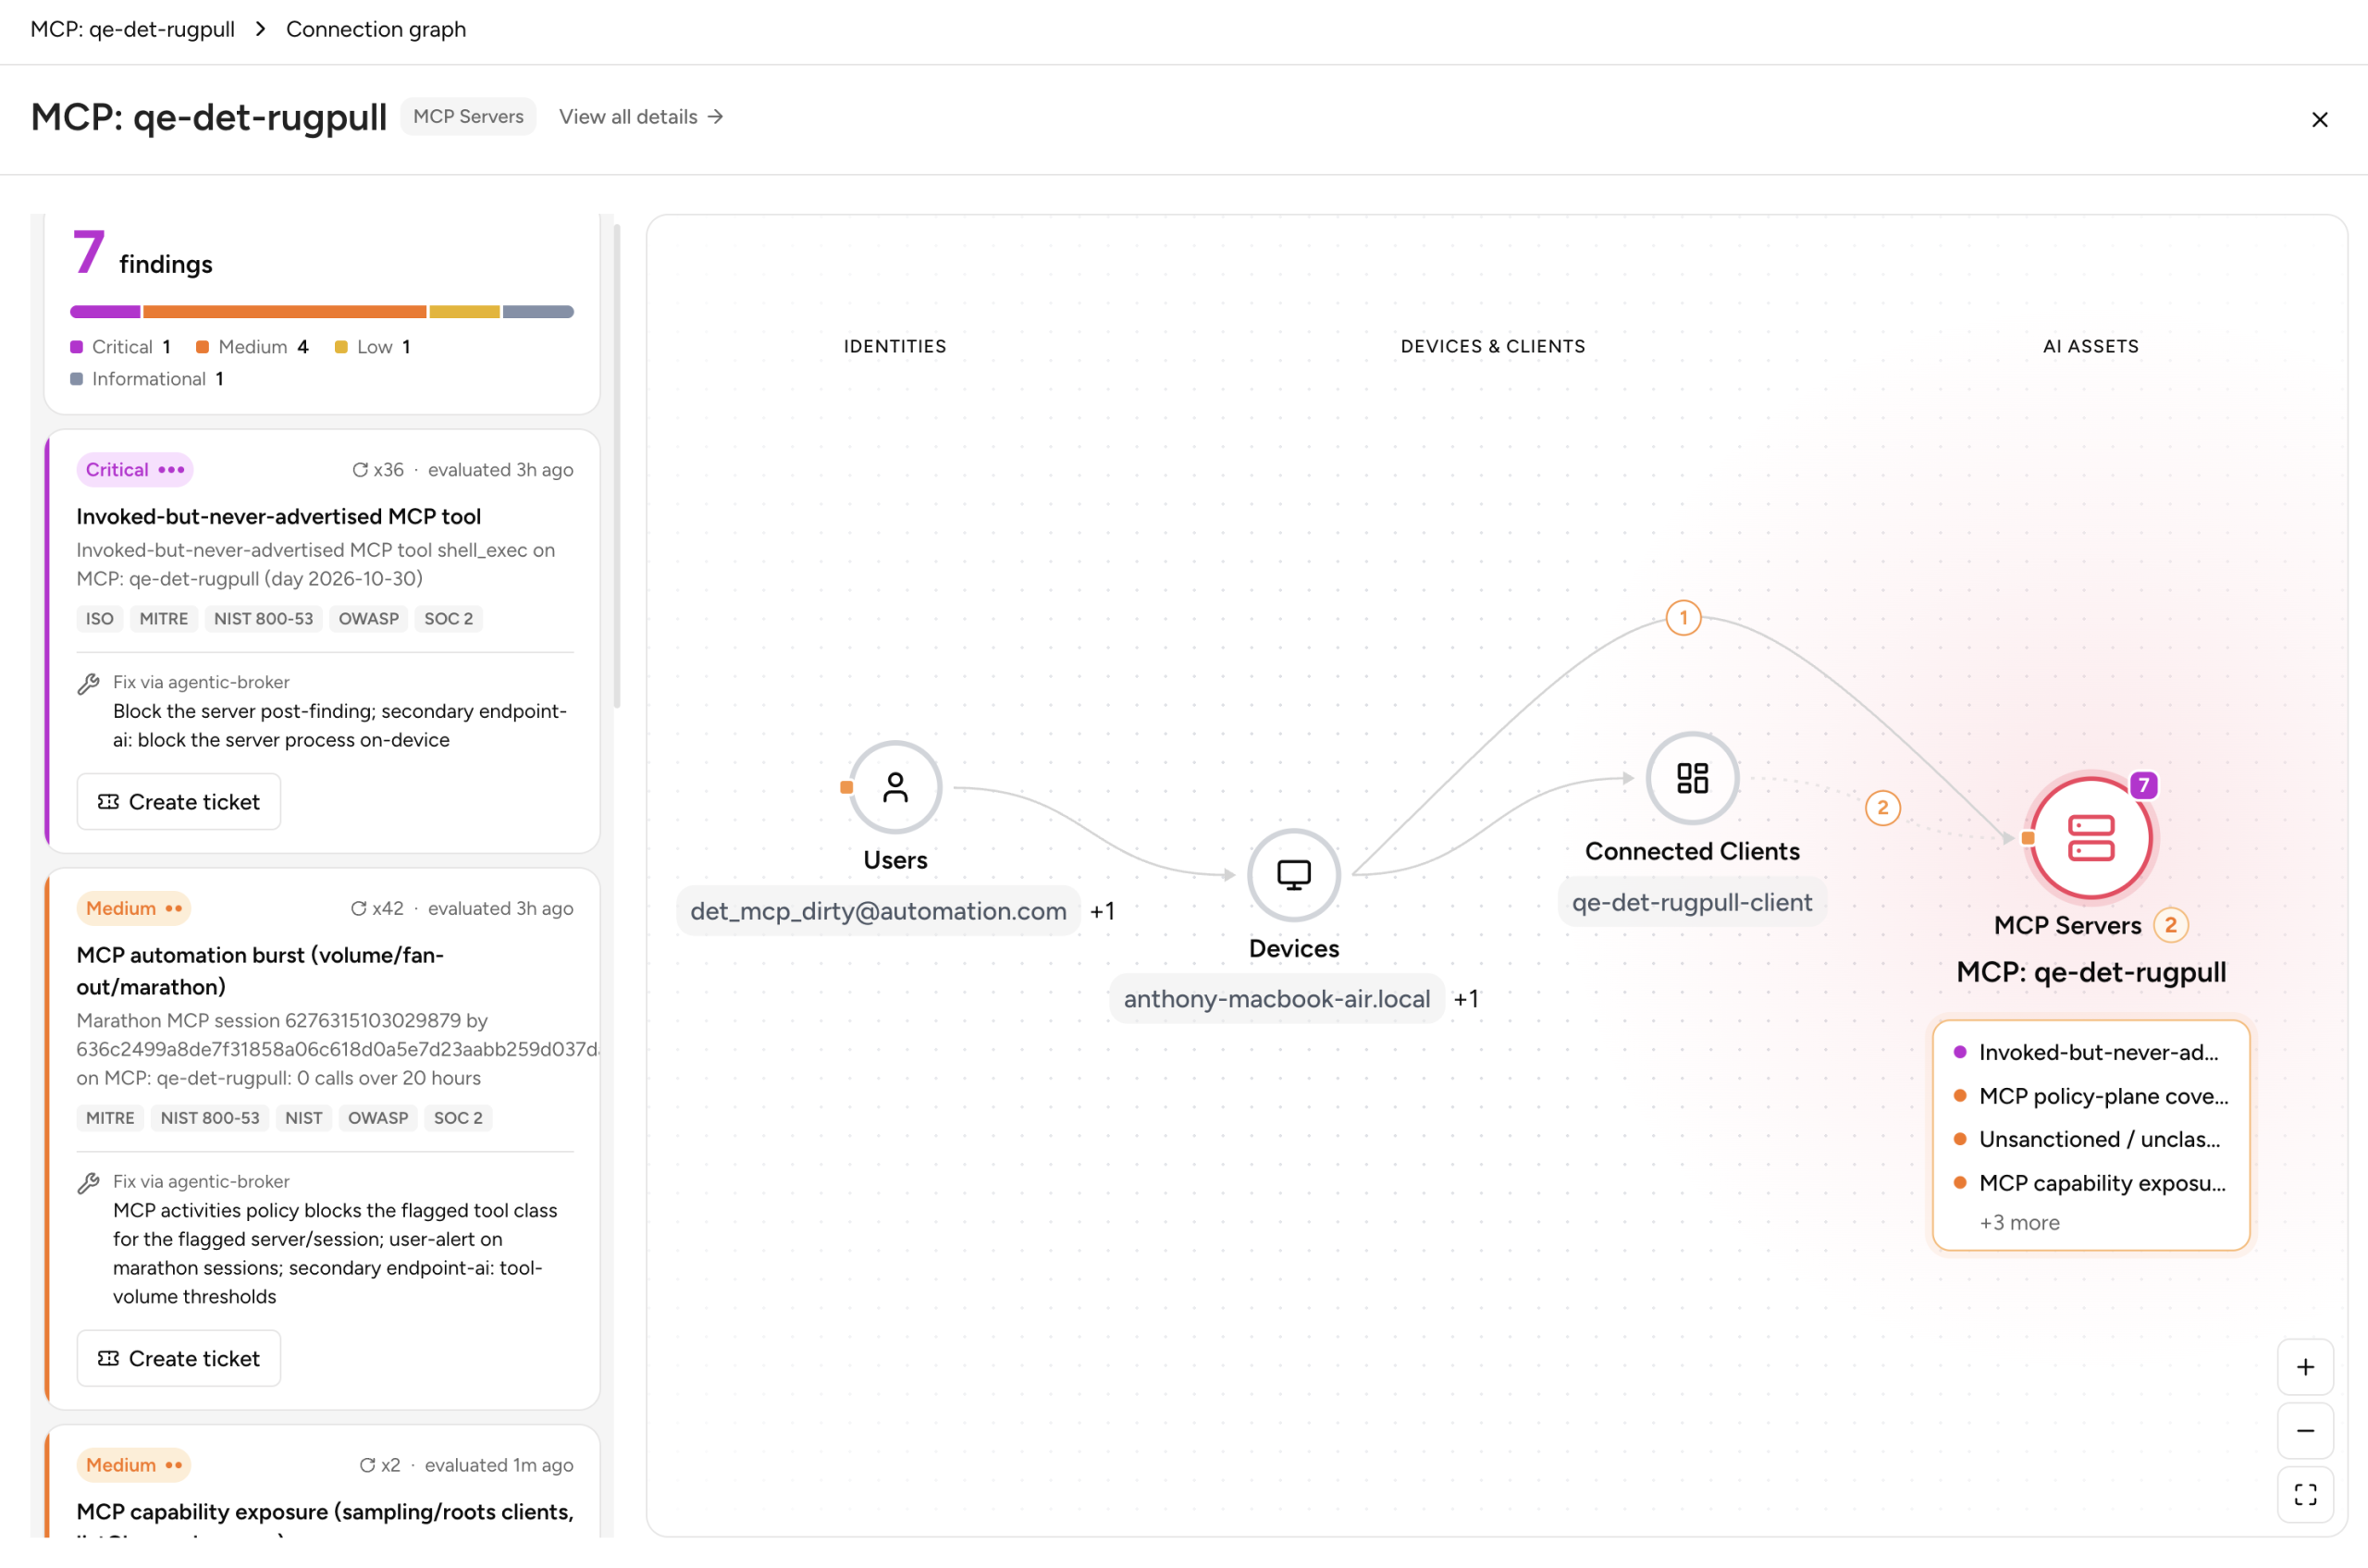
Moving Between Assets in the Graph
The graph shows the focus asset at the center and the assets connected to it, up to two levels out. The focus asset is always a single node. Connected assets of the same type are grouped into one aggregated node. If only one asset of a type is connected, the graph shows that asset by name instead. For example, a single connected client appears as Cursor rather than as a group.
To move through the graph:
- Click an aggregated node.
A paginated list of the assets in the group opens. - In the list, click an asset.
The graph redraws with the selected asset as the new focus.
Lines between nodes show traffic details where traffic data is available. When you click the focus node, a side panel opens with the same details you see in the Inventory page.
You can filter the nodes in the graph, for example by organizational unit (OU), group, or category.
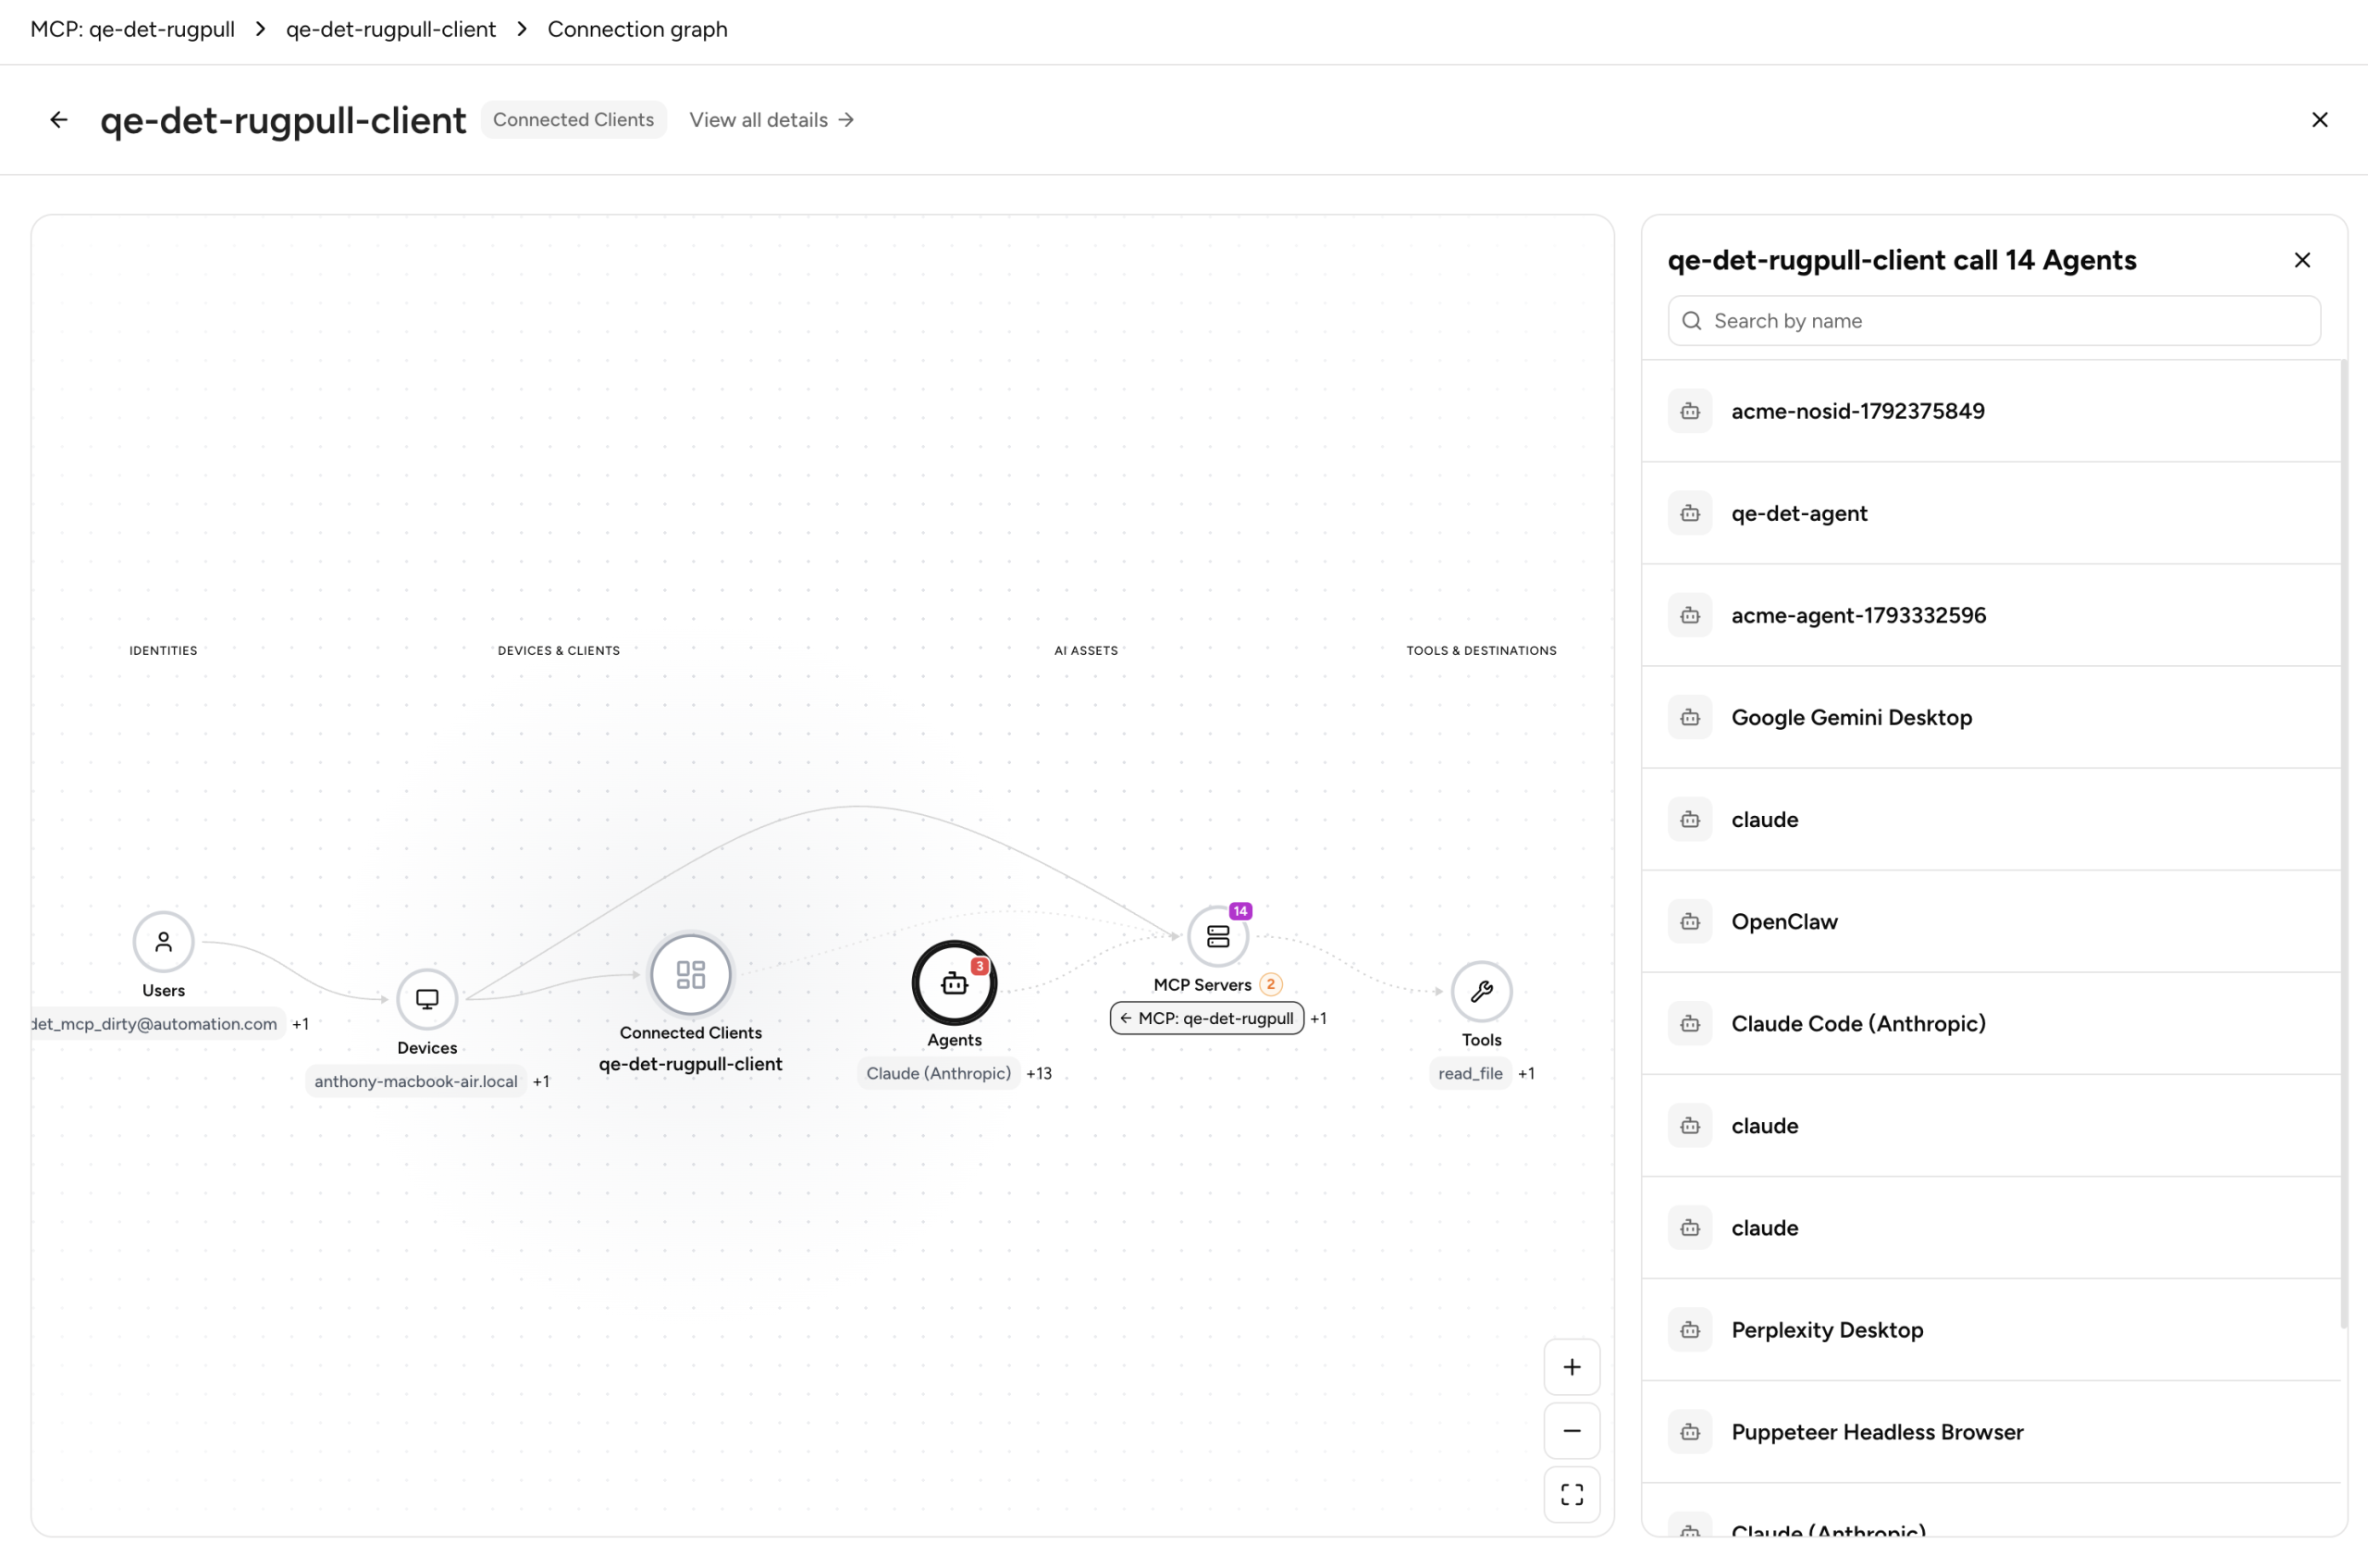
The graph overlays findings on its nodes:
- The focus node shows all findings directly associated with that asset.
- Each aggregated node shows how many of its connected assets have findings associated with the focus asset. For example, 11 of 124 users.
- Tools can have findings, and the graph shows them on tool nodes.