

This document explains how to configure the v3.0.3 Microsoft Sentinel plugin with the Log Shipper module of the Netskope Cloud Exchange platform. This plugin ingests Alerts (DLP, Malware, Policy, Compromised Credential, Malsite, Quarantine, Remediation, Security Assessment, Watchlist, CTEP, UBA), Events (Page, Application, Audit, Infrastructure, Network, Incident, Endpoint), and WebTx data (uncompressed) into the Microsoft Azure Sentinel platform. It only supports the ingestion of JSON-formatted logs. You need Log Analytics Workspace on the Microsoft Azure platform to access the plugin.
Prerequisites
To complete this configuration, you need:
- A Netskope tenant (or multiple, for example, production and development/test instances).
- A Netskope Cloud Exchange tenant with the Tenant plugin and Log Shipper plugin already configured.
- A Netskope Cloud Exchange tenant with AWS Netskope Log Streaming or Azure Netskope Log Streaming plugin already configured (for pulling WebTx from the Netskope Log Streaming plugins).
- Connectivity to the following hosts:
- https://portal.azure.com/
- Log Analytics Workspace on the Microsoft Azure platform
Microsoft Sentinel Plugin Support
The Microsoft Sentinel plugin is used to ingest Netskope Events, Netskope Alerts data and WebTx data in JSON format to Microsoft Sentinel.
| Data Type | Support |
|---|---|
| Events | Yes: Page, Application, Audit, Infrastructure, Network, Incident, Endpoint |
| Alerts | Yes: DLP, Malware, Policy, Compromised Credential, Malsite, Quarantine, Remediation, Security Assessment, Watchlist, CTEP, UBA |
| CE Logs | Not supported |
| WebTx | Yes (uncompressed, via Netskope Log Streaming) |
Note:
- CLS WebTX based on Google Pub Sub Lite is deprecated. Please refer to Netskope Product EOL/EOS Announcements – Netskope Knowledge Portal
- For ingesting WebTX logs to your Log delivery destinations like SIEM, SOAR, XDR, Data Lake, use the AWS Netskope Log Streaming or Azure Netskope Log Streaming plugin.
Permissions
Requires a Microsoft Sentinel Account with Log Analytics workspace access.
API Details
List of APIs Used
| API Endpoint | Method | Use Case |
|---|---|---|
| /api/logs | POST | Send log data to Log Analytics with the HTTP Data Collector |
API Endpoint: https://{CustomerID}.<Azure_Analytics_Domain>/<Resource>?api-version=2016-04-01
Method: POST
Parameters:
api-version=2016-04-01
Headers:
Content-Type: application/json
Log-Type: Netskope_Alerts1
x-ms-date: Wed, 06 Dec 2023 06:46:41 GMT
Authorization: SharedKey <WorkspaceID>:<Signature>
Request Body
{
	  "key1": "value1",
	  "key2": "value2",
	  "key3": "value3",
	  "key4": "value4”
}
Sample API Response
200 OK
Performance Matrix
This performance reading is for a Large Cloud Exchange Stack tested with these VM specifications. The below readings are added with the consideration that it will ingest around 10K logs in 11 seconds for Alerts and Events.
| Description | Specification |
|---|---|
| Stack details | Size: Large RAM: 32 GB CPU: 16 Cores |
| Events, Alerts ingested to Microsoft Sentinel | 200K EPM |
User Agent
The user agent added in this plugin in the following format:
netskope-ce-<ce_version>-<module>-<plugin_name>-v<plugin_version>
For example:
Netskope-ce-5.1.0-cls-microsoft-azure-sentinel-v3.0.3
Workflow
- Get your Microsoft Sentinel Workspace ID and Primary Key.
- Configure the Microsoft Sentinel plugin.
- Configure a Log Shipper Business Rules.
- Configure the Log Shipper SIEM Mappings.
- Validate the plugin.
Click play to watch a video.
Get your Azure Sentinel Workspace ID and Primary Key
- Log in to the Entra ID portal .
- Click Microsoft Sentinel.

- Click Create on the Microsoft Sentinel page.

- Click Create a new workspace.

- Select a Resource Group, enter a Name, and select your Region. Click Review + Create.

- Click Create.

- The workspace will be created; it will take a few seconds to deploy. After deployment succeeds, click Refresh. Click on the Workspace that you created and click Add.

- It will take a few seconds to add the workspace.

- After successfully adding a workspace, go to Home > Log Analytics workspaces.

- Click on the workspace name that you created.

- Click Settings > Agents.

- Click Log Analytics agent instructions.

- Under Logs Analytics agent instruction, copy the Workspace ID and Primary Key. These are needed to configure the plugin.

Configure the Microsoft Sentinel Plugin
- In Cloud Exchange, go to Settings > Plugin Store.
- Search for and select the Microsoft Azure Sentinel v3.0.3 (CLS) plugin.
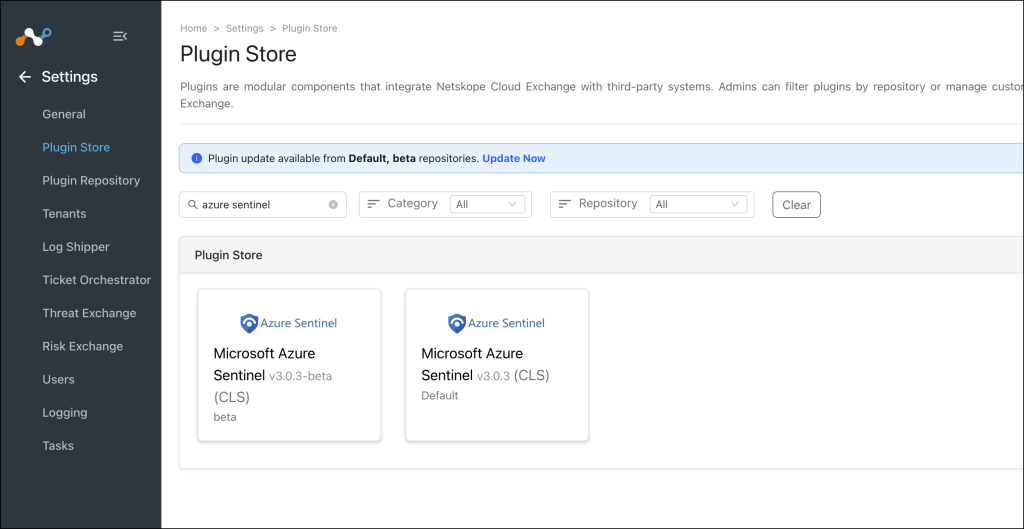
- Enter these parameters:
- Configuration Name: Create a unique name for the configuration.
- Mapping: Use the default mapping file.
- Transform the raw logs: Disable if you need to send Raw Data. (Default: It will be enabled and send Transformed data).
- Use System Proxy: Enable if the proxy is required for communication.

- Click Next and enter the Configuration Parameters:
- Azure Log Analytics Domain: Domain name for your Azure Log Analytics. For example, ods.opinsights.azure.com, ods.opinsights.azure.us, etc.
- Workspace ID: The unique identifier of your Microsoft Sentinel workspace.
- Primary Key: The authentication key for your Microsoft Sentinel workspace.
- Alerts Log Type Name: Custom Log Type name for alerts. Based on this name, a schema for alerts will be created in Log Analytics Workspace with suffix
_CL. Note that the valueNetskope_AlertsorNetskope_Alerts_CLfor this parameter matches the Netskope published playbooks in the Microsoft marketplace. In this log type,_CLwill automatically be appended from Microsoft. - <Events Log Type Name: Custom Log Type name for events. Based on this name, a schema for events will be created in Log Analytics Workspace with suffix
_CL. Note that the valueNetskope_EventsorNetskope_Events_CLfor this parameter matches the Netskope published playbooks in the Microsoft marketplace. In this log type,_CLwill automatically be appended from Microsoft. - WebTX Log Type Name: Custom Log Type name for web transactions. Based on this name, a schema for web transactions will be created in Log Analytics Workspace with suffix
_CL. Note that the valueNetskope_WebTxorNetskope_WebTX_CLfor this parameter matches the Netskope published playbooks in the Microsoft marketplace. In this log type,_CLwill automatically be appended from Microsoft.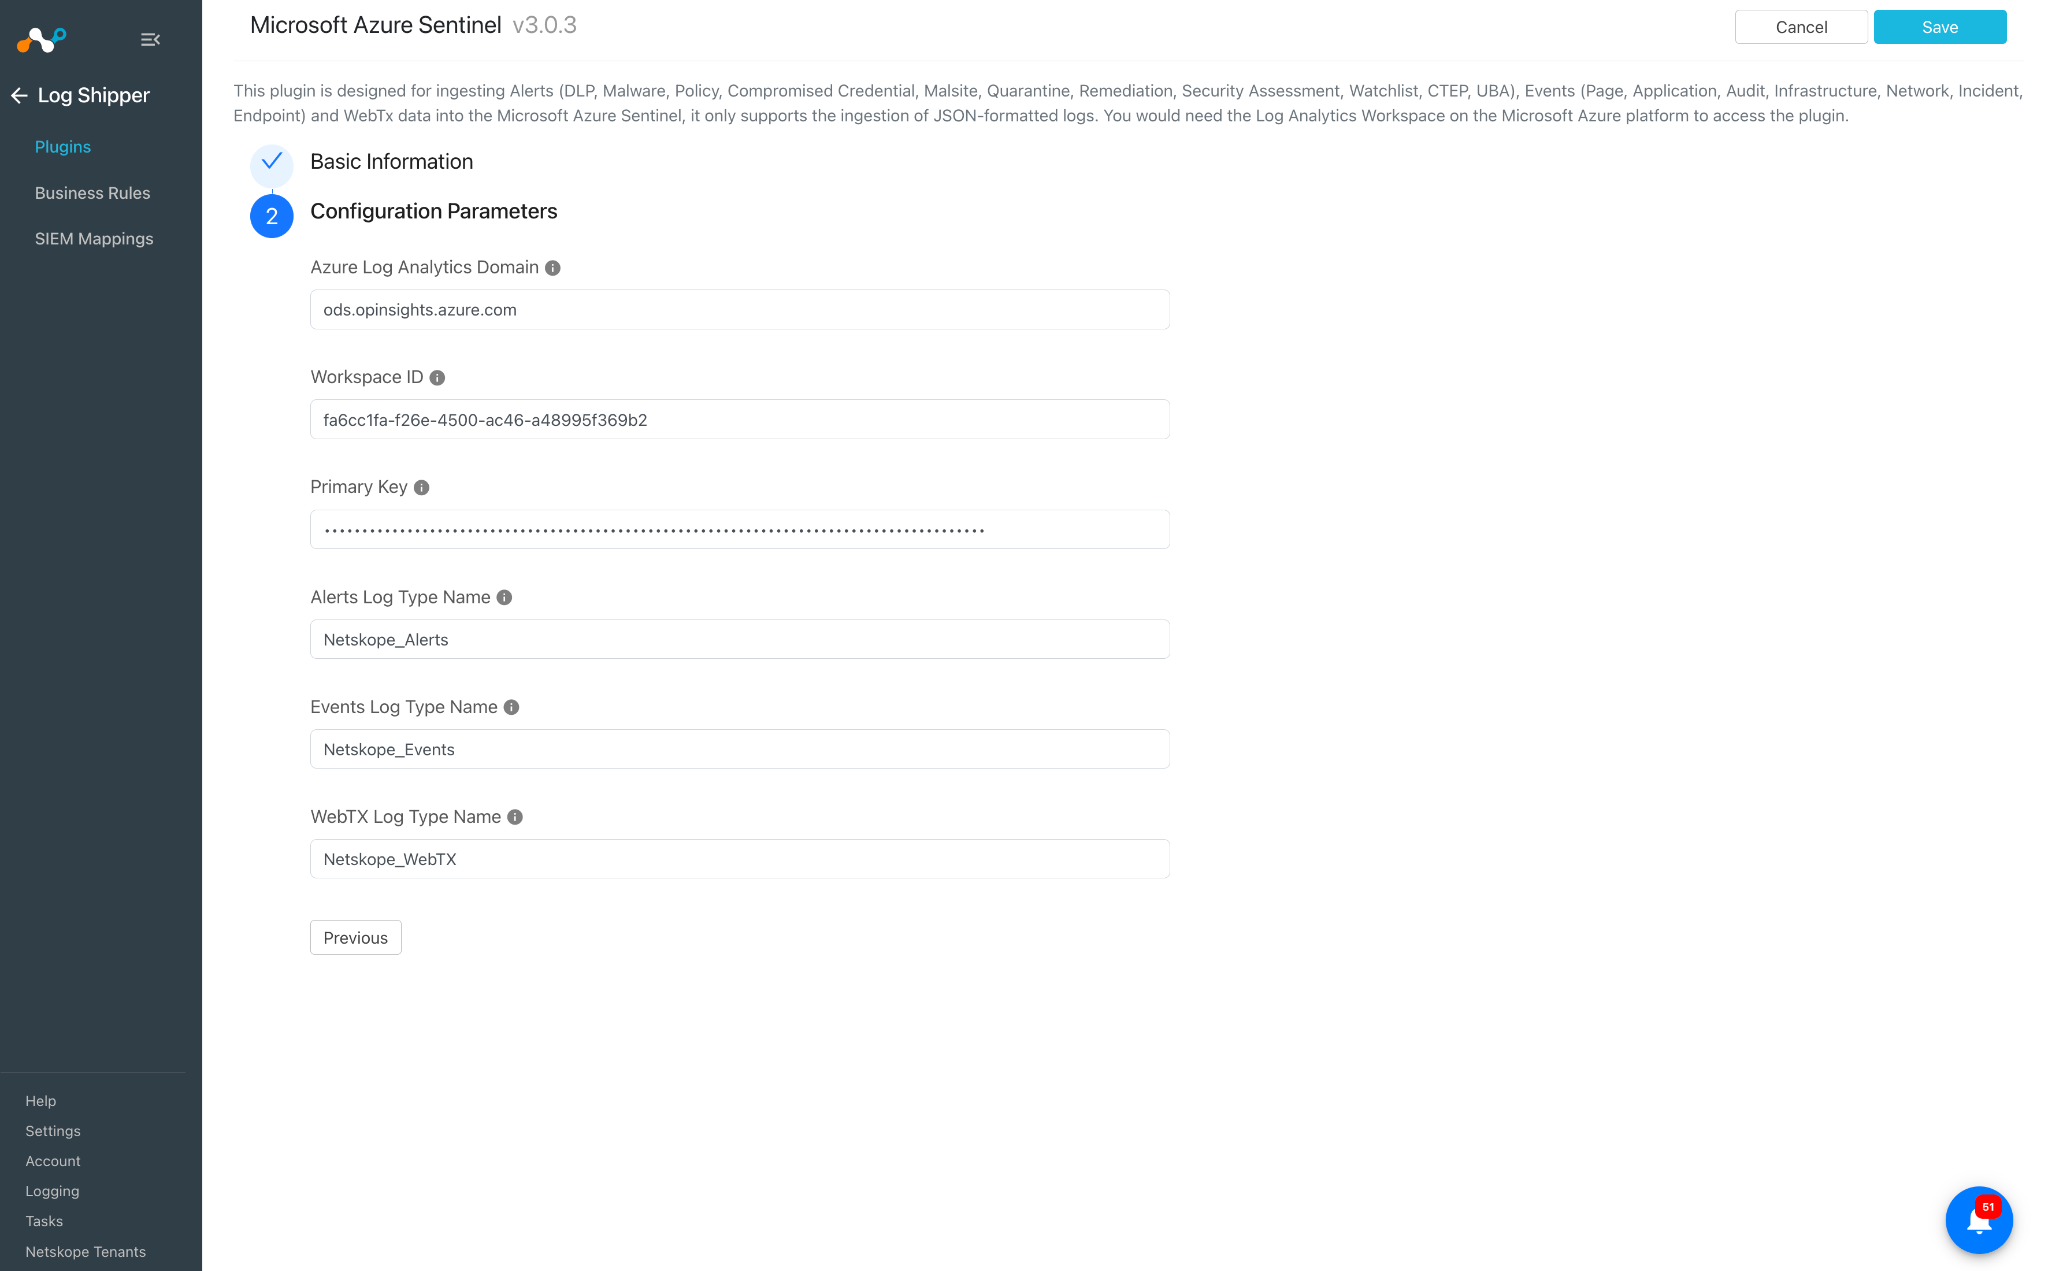
- Click Save.

Configure Log Shipper Business Rules for Microsoft Sentinel
Skip this step if you do not want to filter out alerts or events before ingestion.
- Go to Log Shipper > Business Rules.
- Click Create New Rule.
Note
By default, there’s a business rule that filters all alerts and events. If you want to filter out any specific type of alert or event, create a new Business Rule.

- If creating a new rule, enter a Rule Name and select the filters to use.
- Click Save.

Configure the Log Shipper Log Delivery for Microsoft Sentinel
- Go to Log Shipper > Log Delivery and click Add Log Delivery Configuration.
- For alerts and events, select the Source plugin (CLS Netskope), and Destination plugin (CLS Microsoft Azure Sentinel), select a business rule, and then click Save.
- For ingestion of WebTx, select the Source plugin (AWS Netskope Log Streaming or Azure Netskope Log Streaming), the Destination plugin (CLS Microsoft Azure Sentinel), and then click Save.
- After the Log Delivery configuration is added, the data will start to be pulled from the Netskope tenant and ingested into the Azure Sentinel platform.
Validate the Microsoft Sentinel Plugin
To validate the plugin workflow, you can check from Netskope Cloud Exchange and from the Microsoft Sentinel instance.
Validate the Pull
Go to Logging, and search for the message contains pulled logs.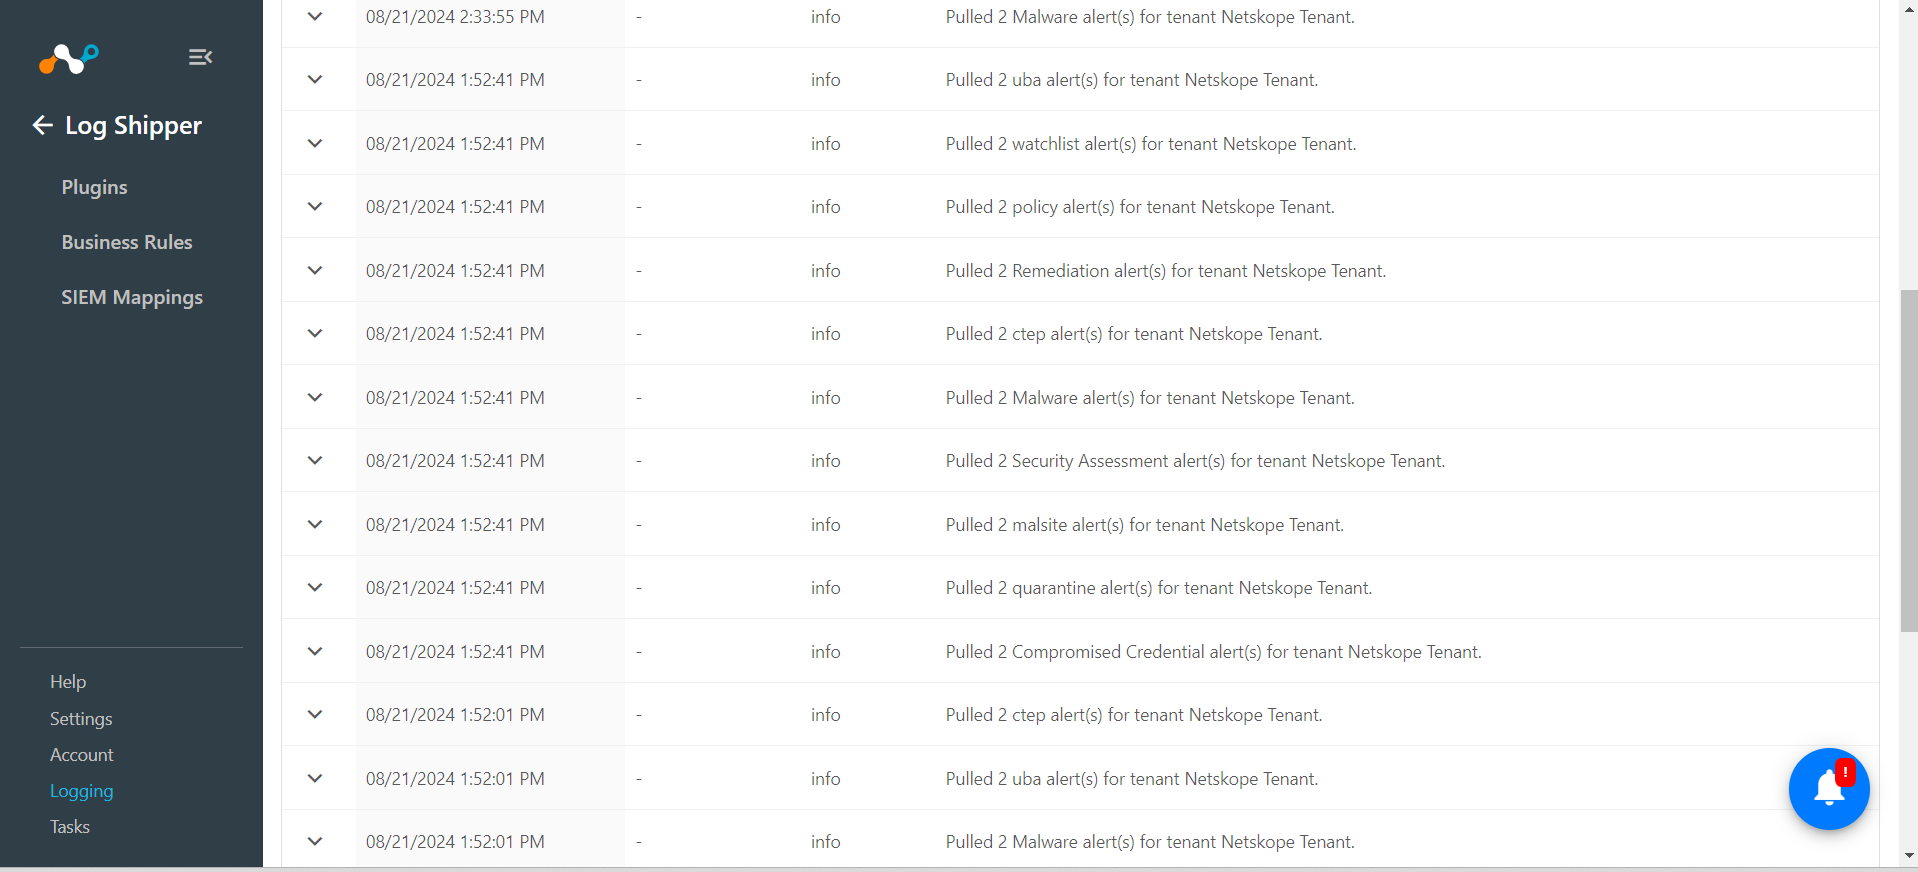
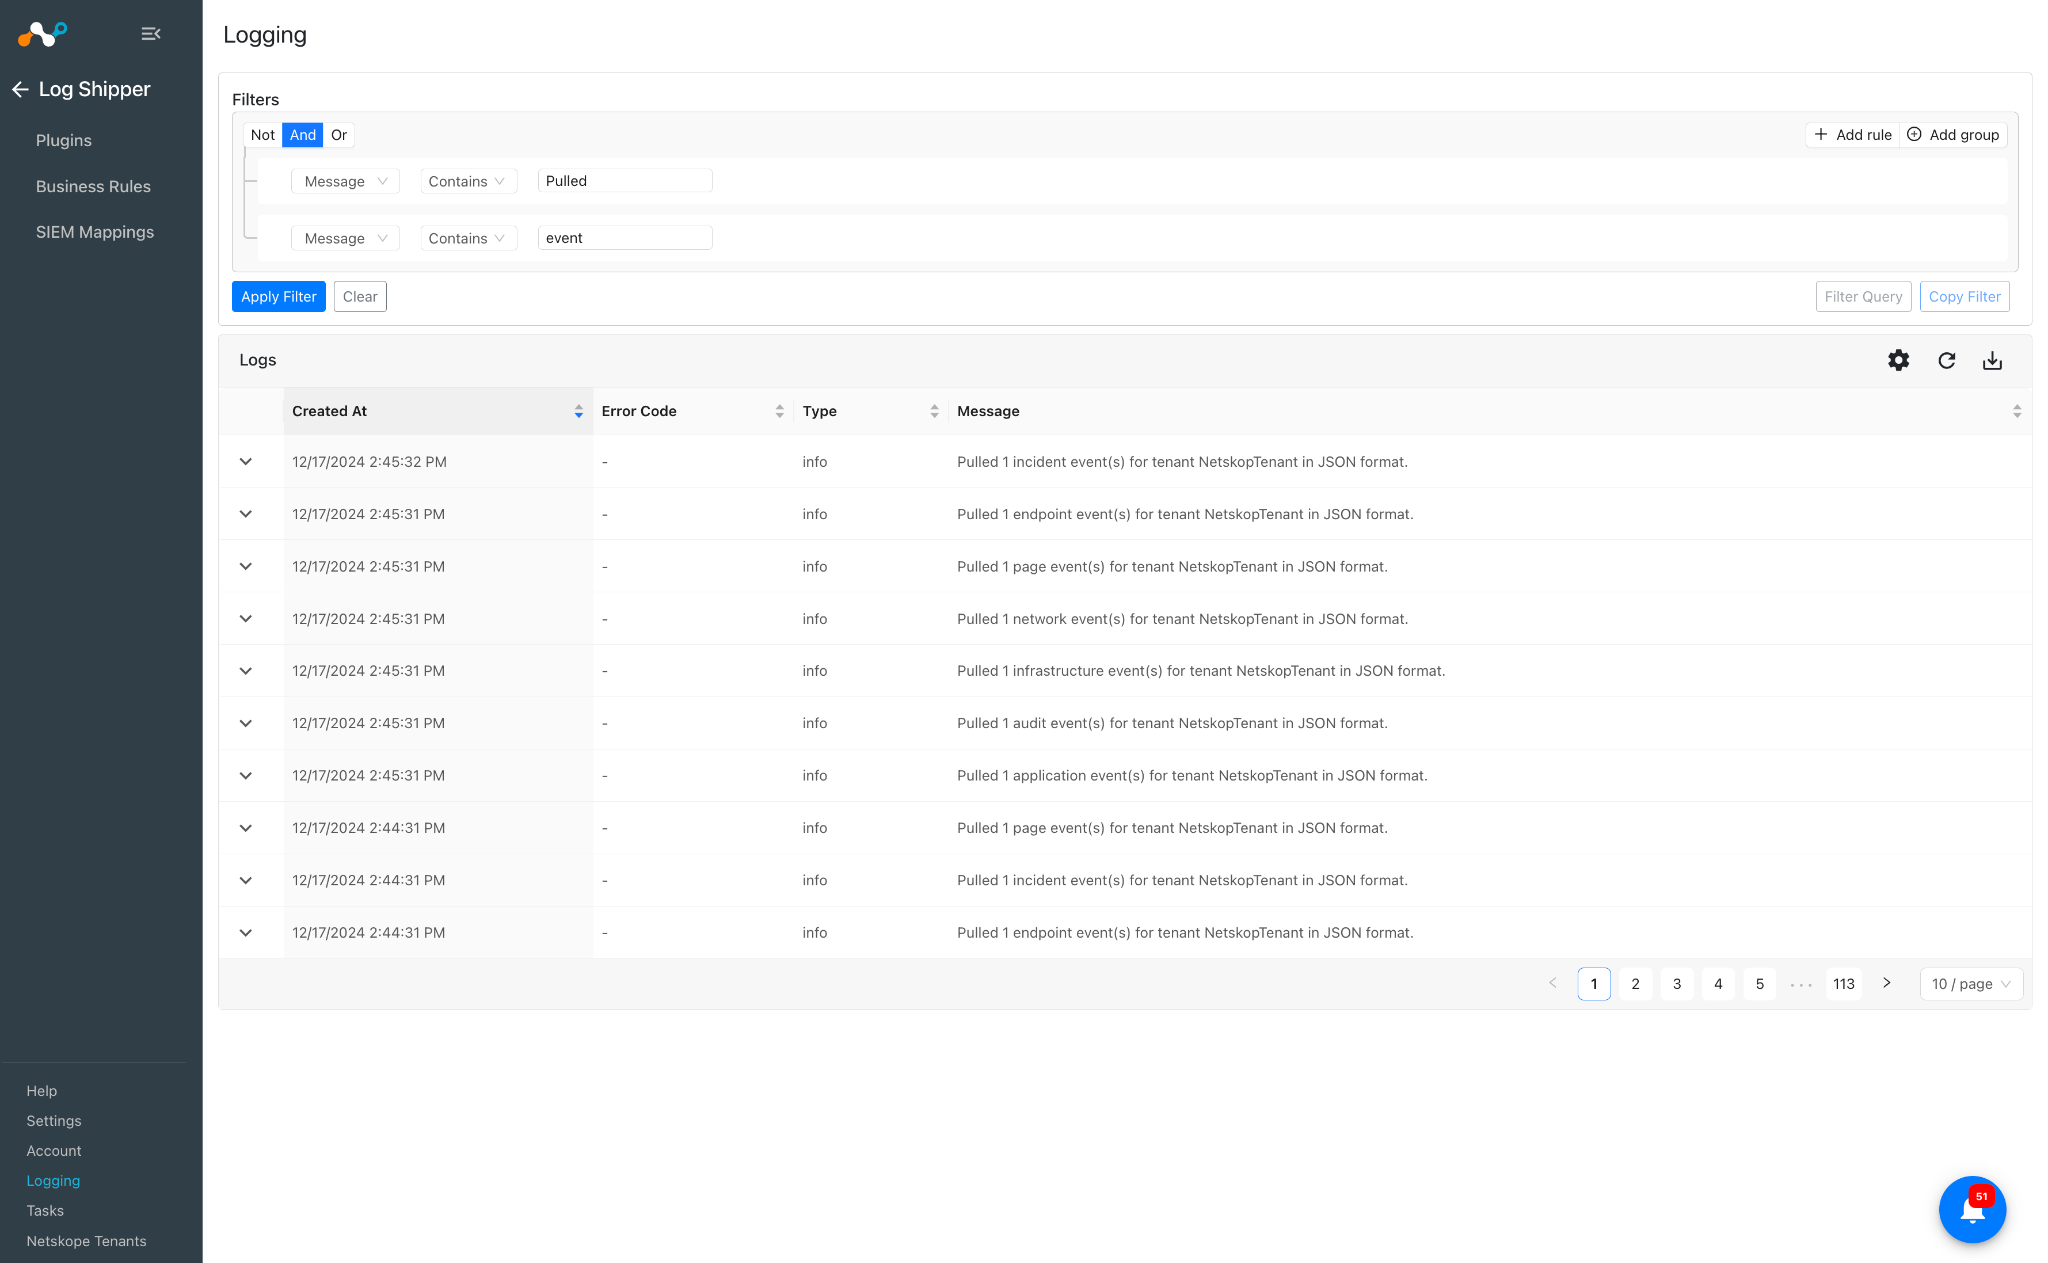
Validate the Push
To validate the plugin workflow in Netskope Cloud Exchange:
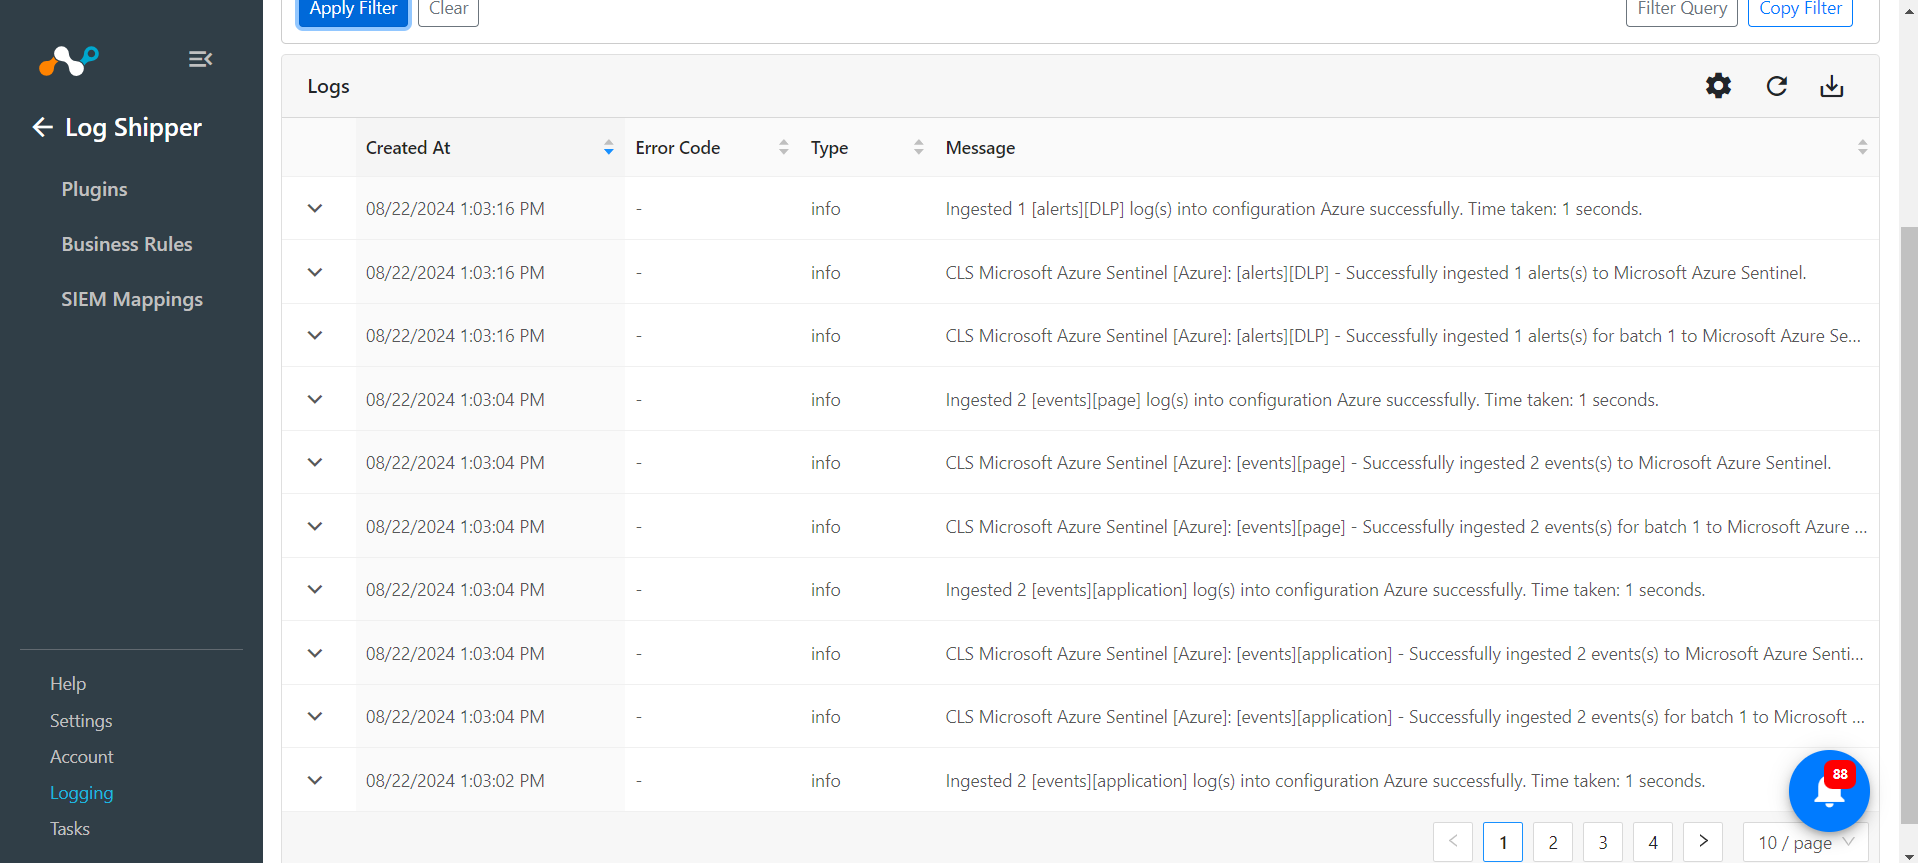
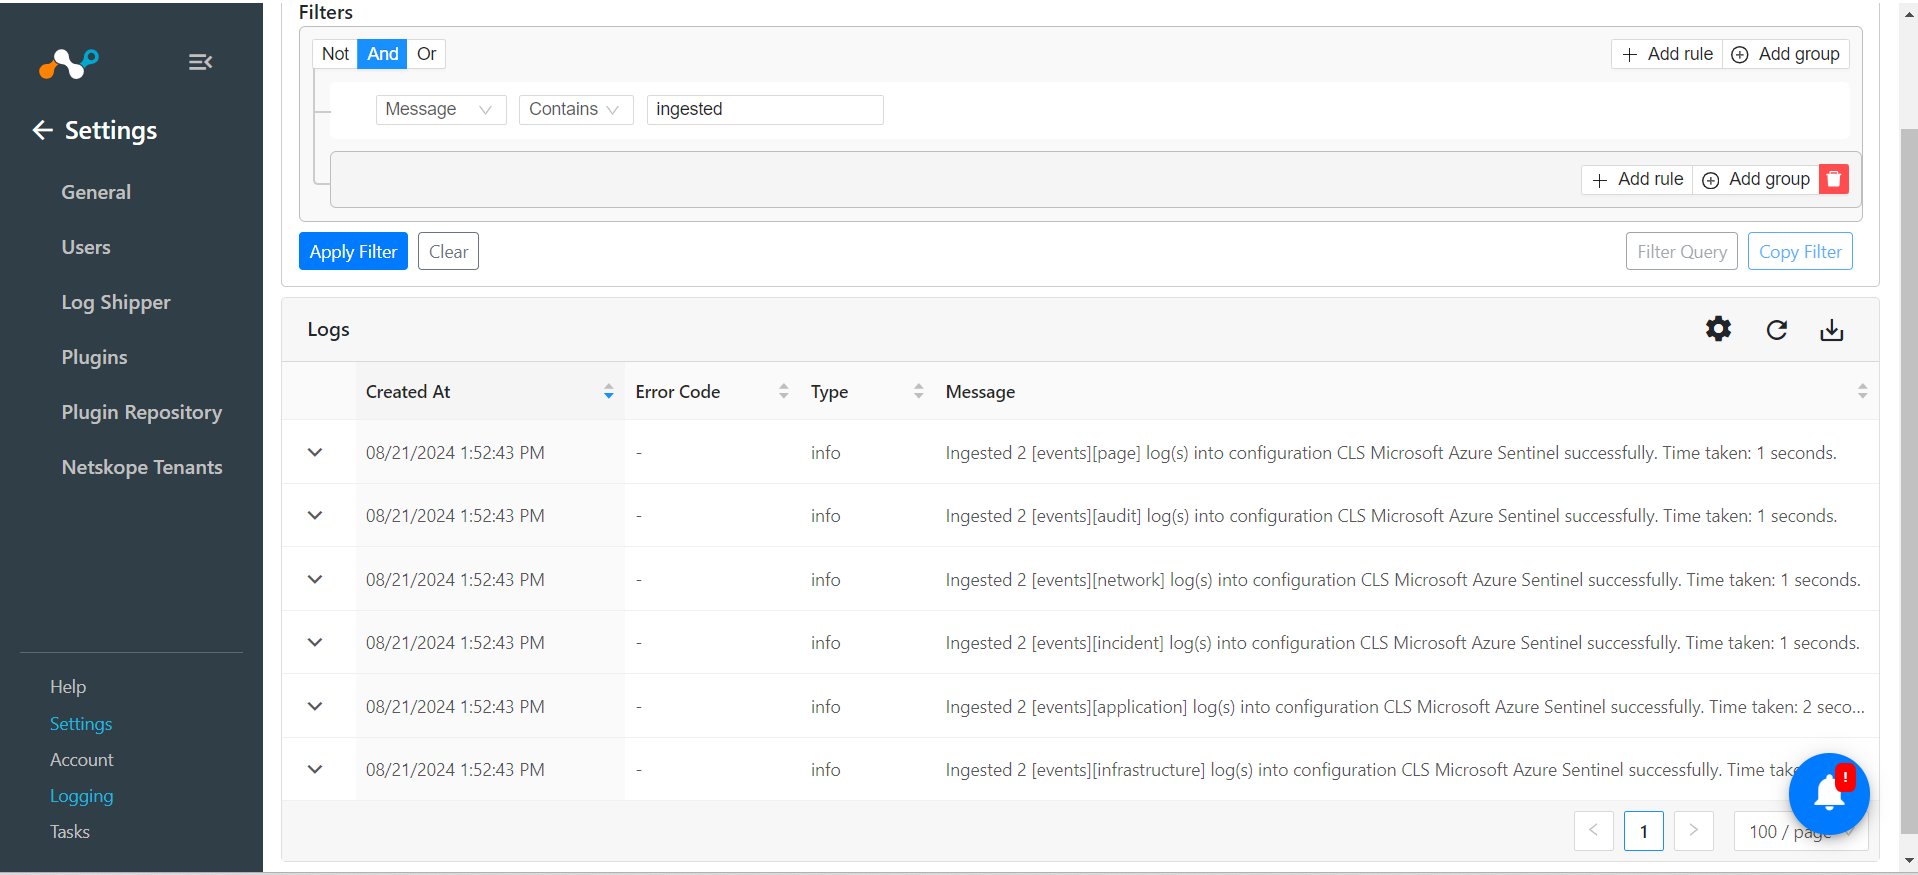
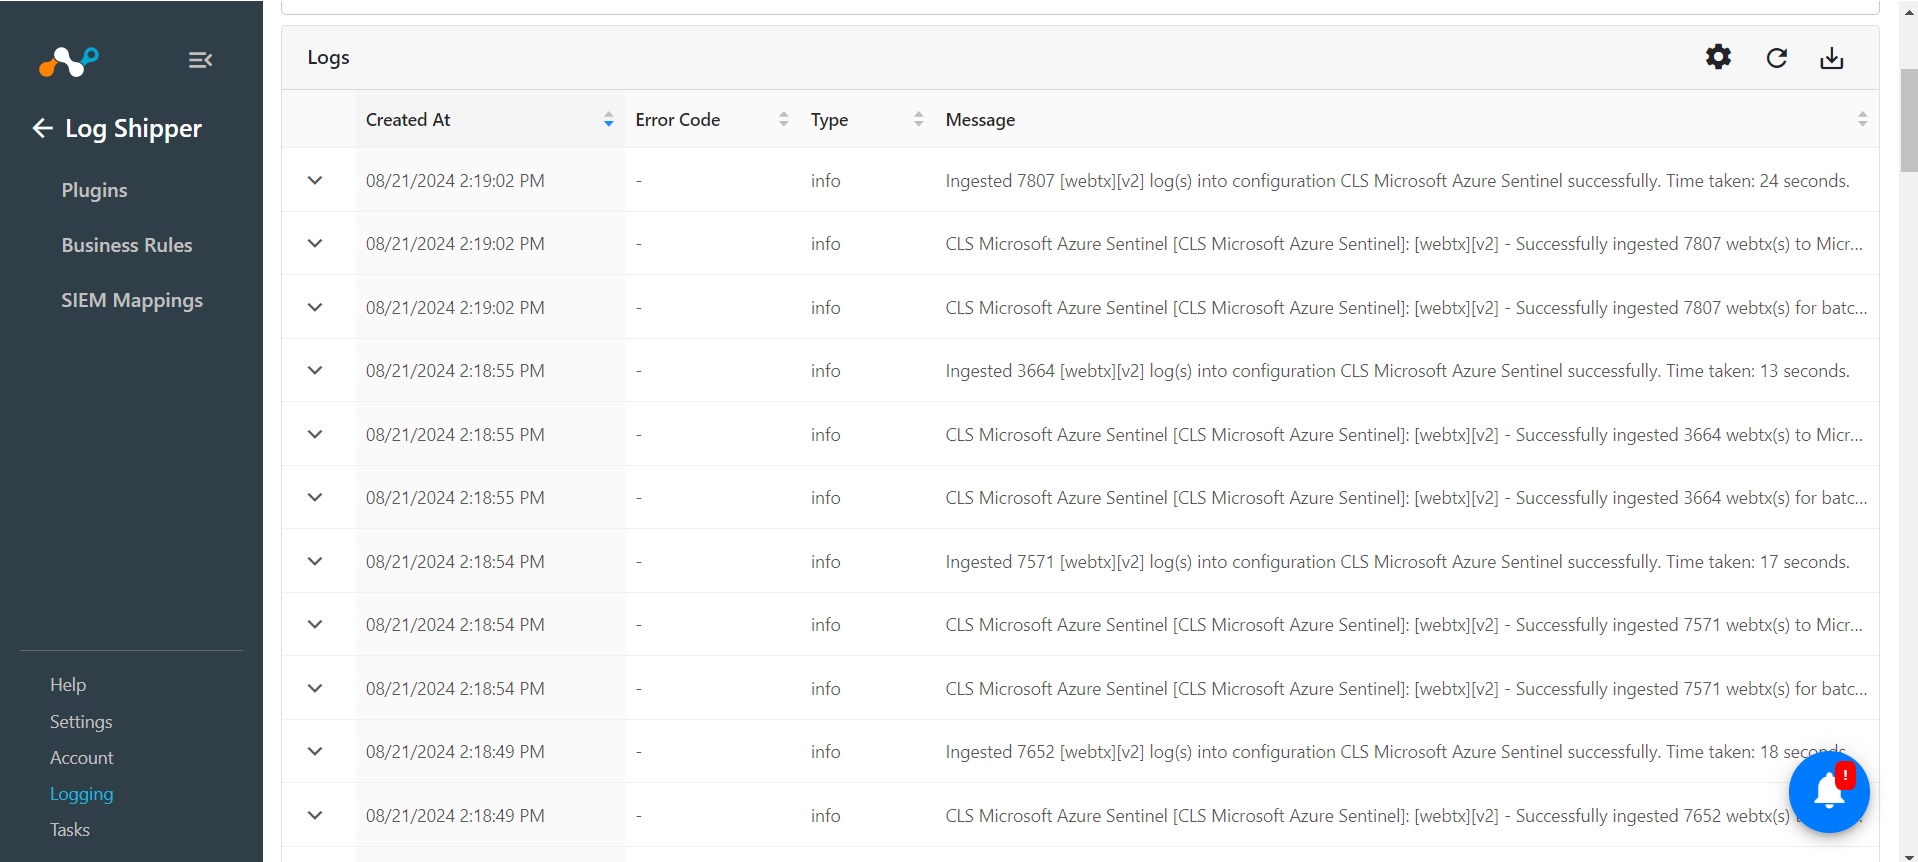
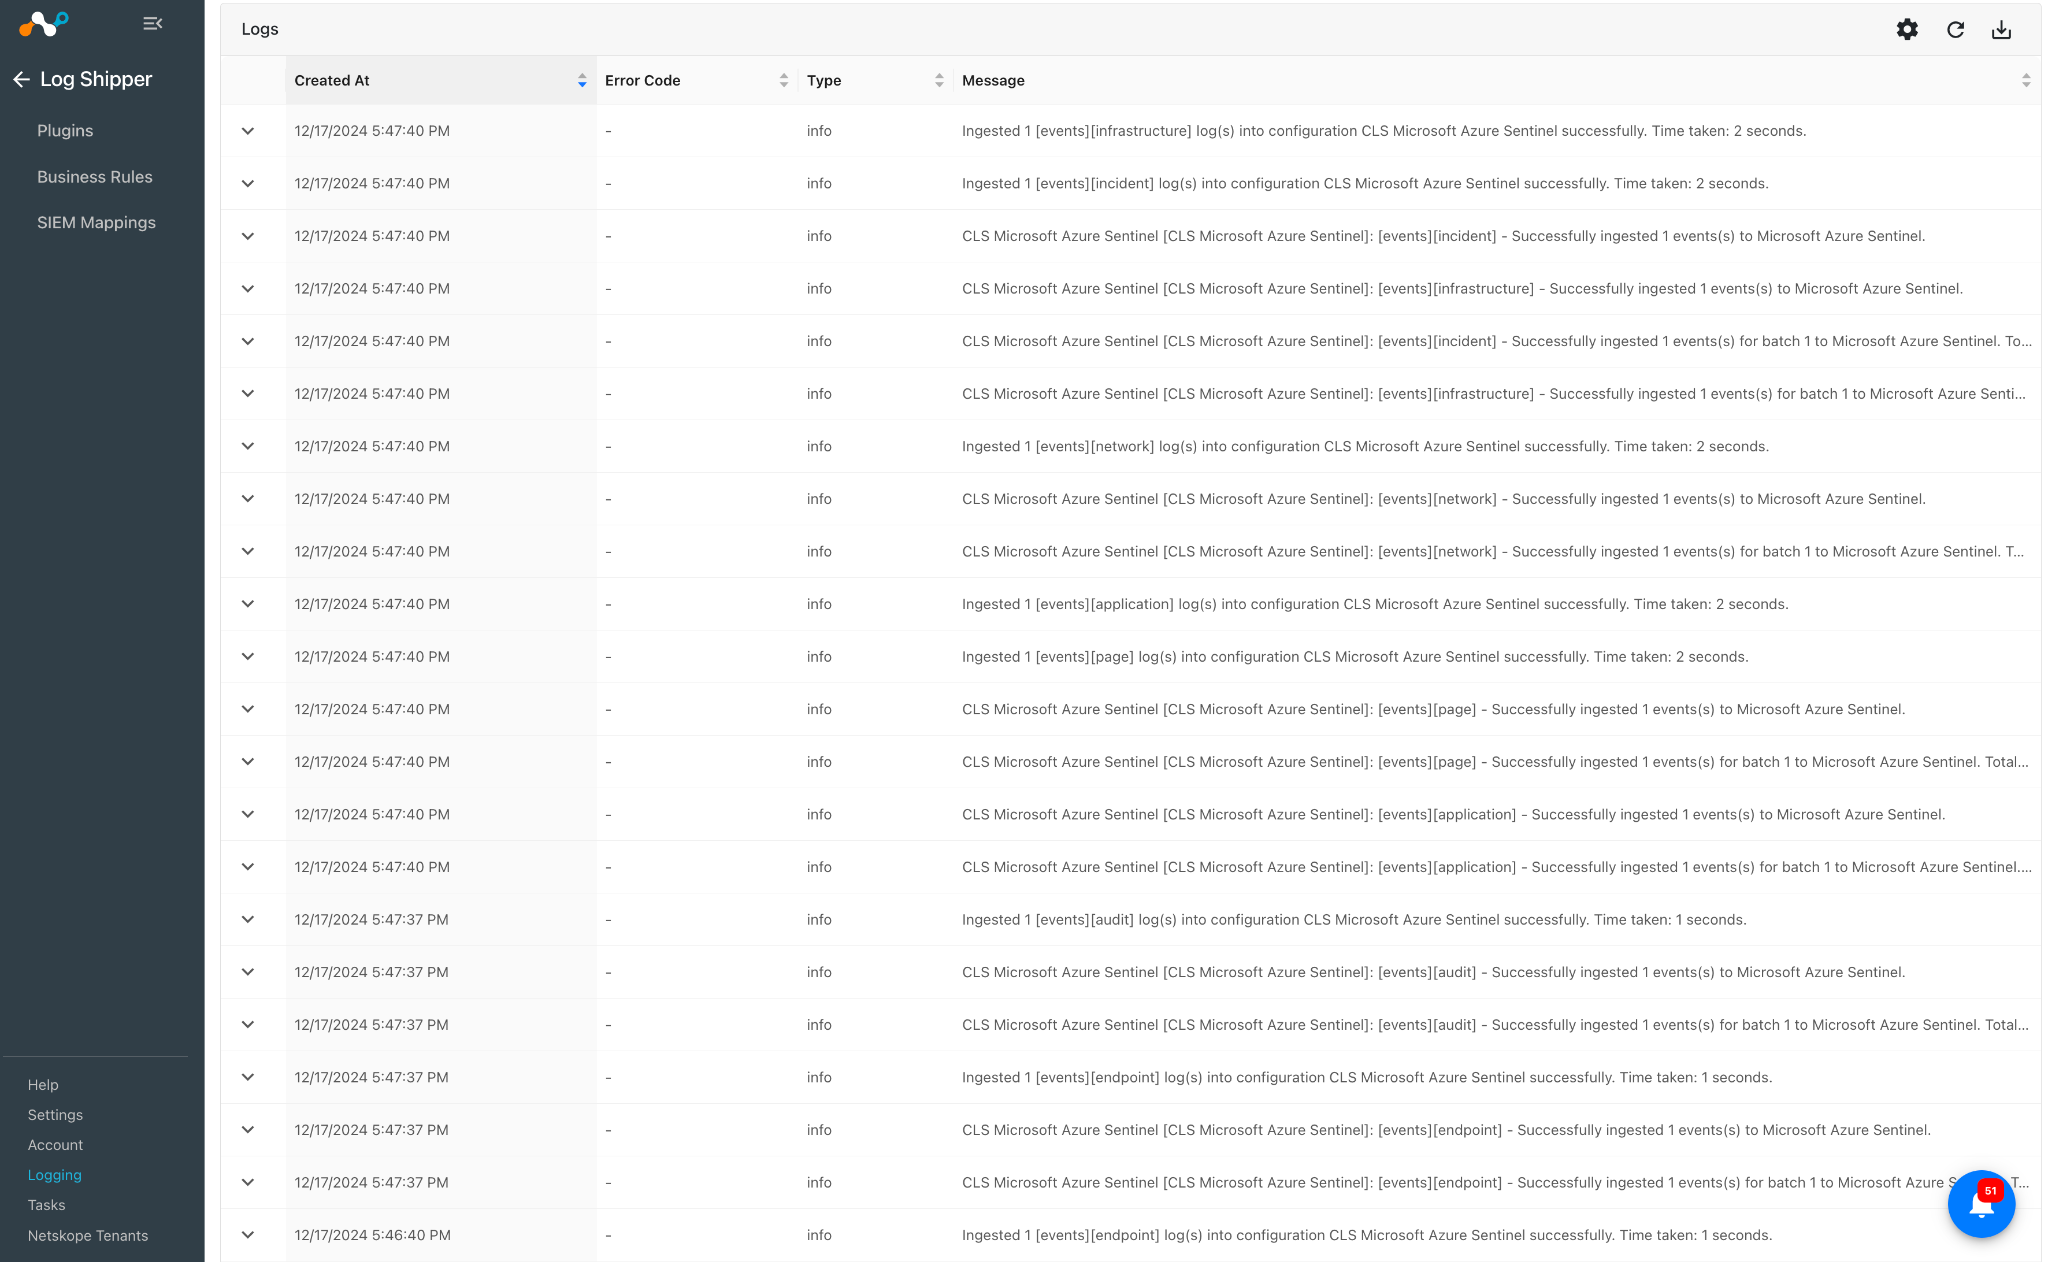
- Go to Logging and search for ingested events with the filter message contains ingested.
- The ingested logs will be filtered.

To validate the push in the Azure platform:
- Log in to the Entra ID portal.
- Go to the Log Analytics workspace, and click on the workspace that you have created.
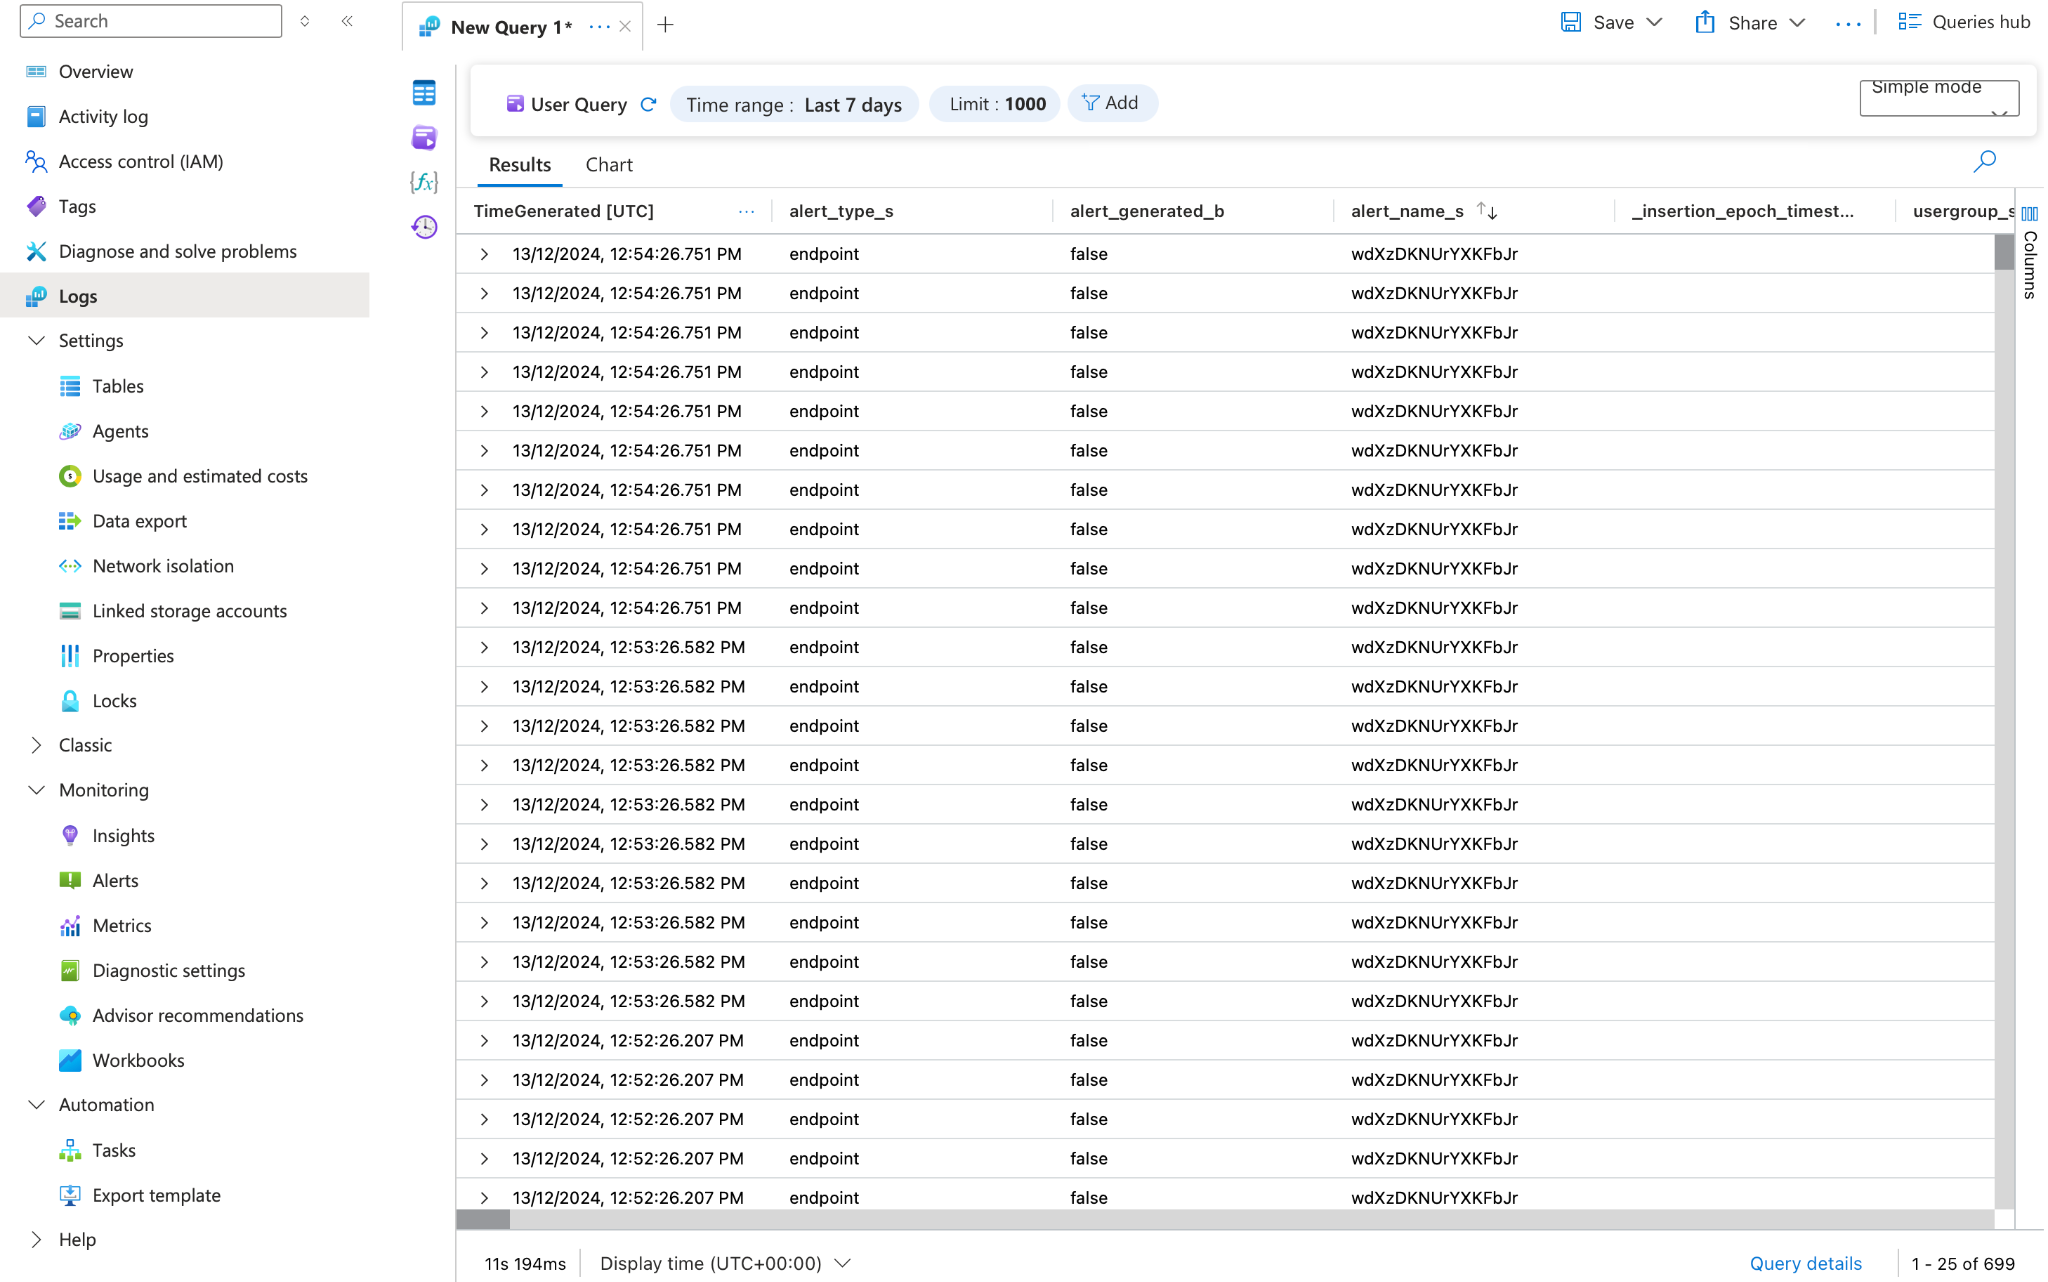
You can filter the logs using the schema name used in the plugin example:
Netskope_Alerts_CL | where alert_type_s contains “dlp”


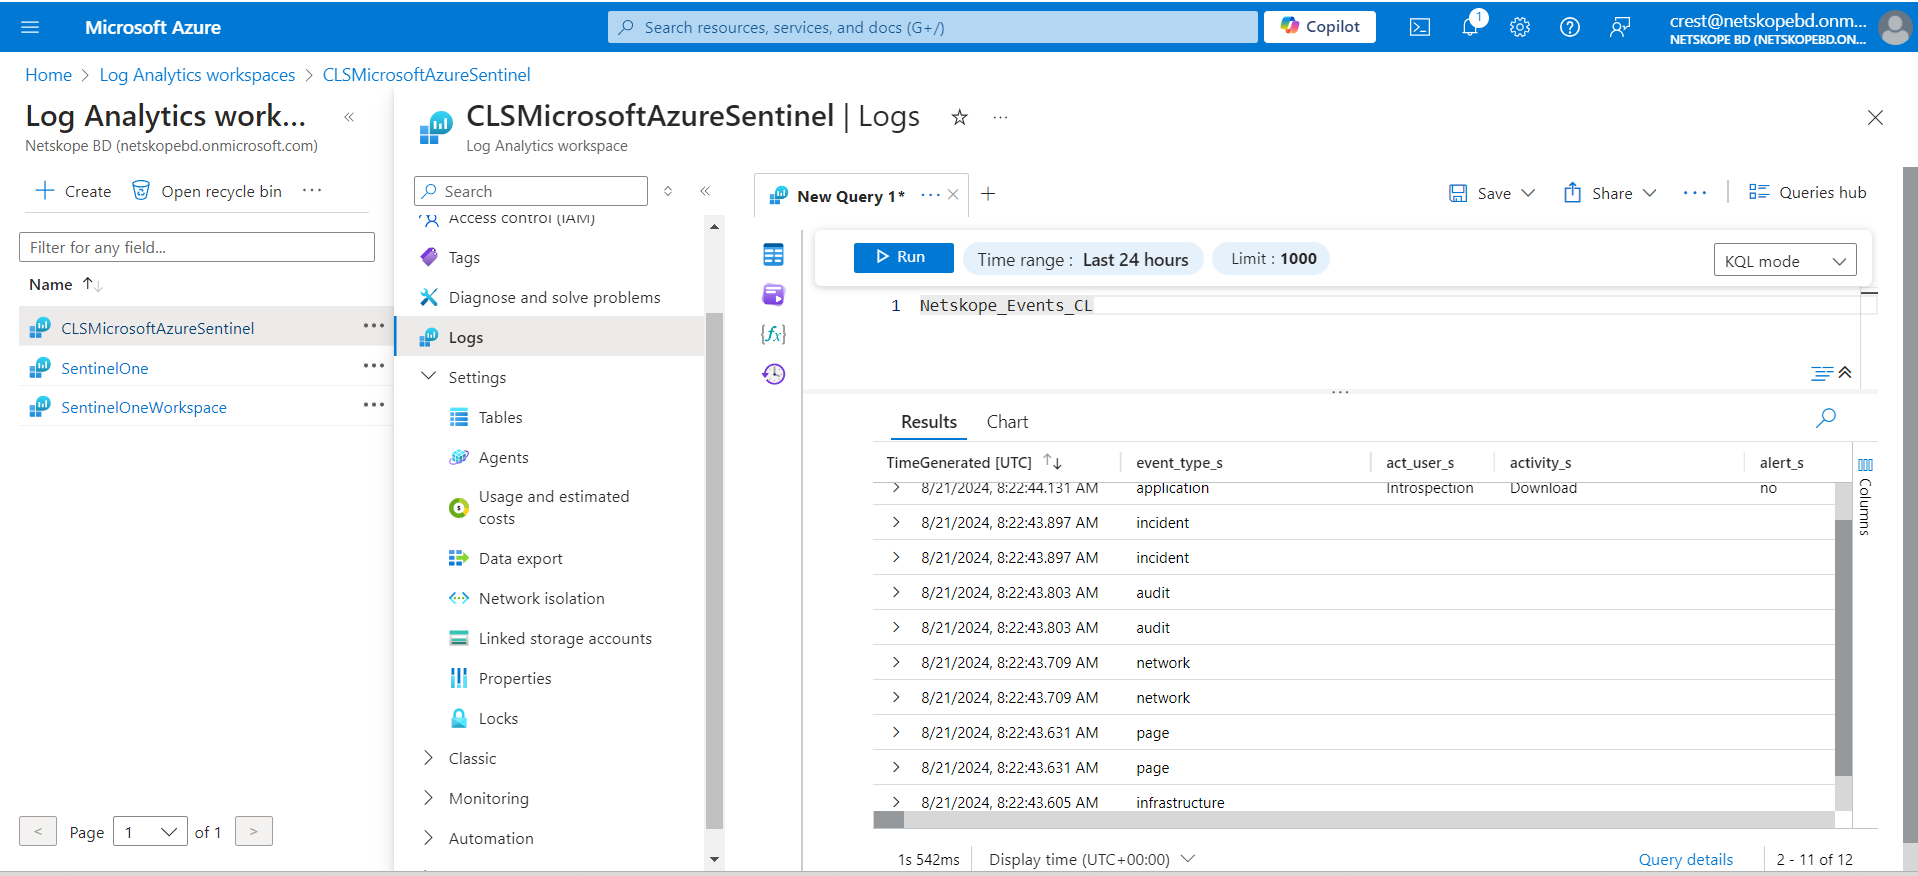
- To verify the Events data filter the logs using the schema name: Netskope_Events_CL.
- To verify the Webtx data filter the logs using the schema name: Netskope_WebTX_CL.

Troubleshooting the Microsoft Sentinel Plugin
If a user is not able to configure the Microsoft Sentinel plugin
If you are not able to configure the plugin it might be due to invalid plugin credentials provided.
What to do: Check the Workspace ID and Primary key added in the plugin configuration with the Workspace ID and Primary Key on the Sentinel Portal. Also make sure that the workspace is not deleted on Sentinel.
If data is not ingested from Cloud Exchange
Data is not ingested from Cloud Exchange to the platform. If this is the case it might be due to one of the following:
- Data is not pulled from the Source plugin.
- Data is not present on the Source plugin for the provided initial range.
What to do:
- If your data is not pulled from Cloud Exchange, go to the logging page and check the logs, there will be a log like mentioned below, related to readtimeout. Wait for the error to be resolved, and check the issue from the source plugin side.

- Check on the tenant from which date the data is present and provide that number while configuring the tenant in Cloud Exchange.
If ingested data is not reflected on the Microsoft Azure Sentinel plugin
Ingestion logs are received but the data is not reflected on the platform. If this is the case it might be due to one of the following:
- Workspace is newly created
- Logs are being checked in the wrong Workspace
- File name for ingested data is wrong while searching
What to do:
- If your data is not reflected check above options, If the workspace is newly created and data is ingested for the first time it might take a few minutes for the data to be reflected on the platform.
- Check the workspace in which you are ingesting the logs.
- If that is not the case then check the file name or search query that you are using for data verification. You can check the file name in the plugin configuration.

Make sure to add the _CL in the table name while filtering the data on Sentinel, as Sentinel adds the above suffix for all the file names when data is ingested, else you won’t be able to see any ingested logs.