

The Netskope Add-on for Splunk includes three Digital Experience Monitoring (DEM) dashboards that give you visibility into end-user experience, application performance, and network performance across your Netskope steered traffic:
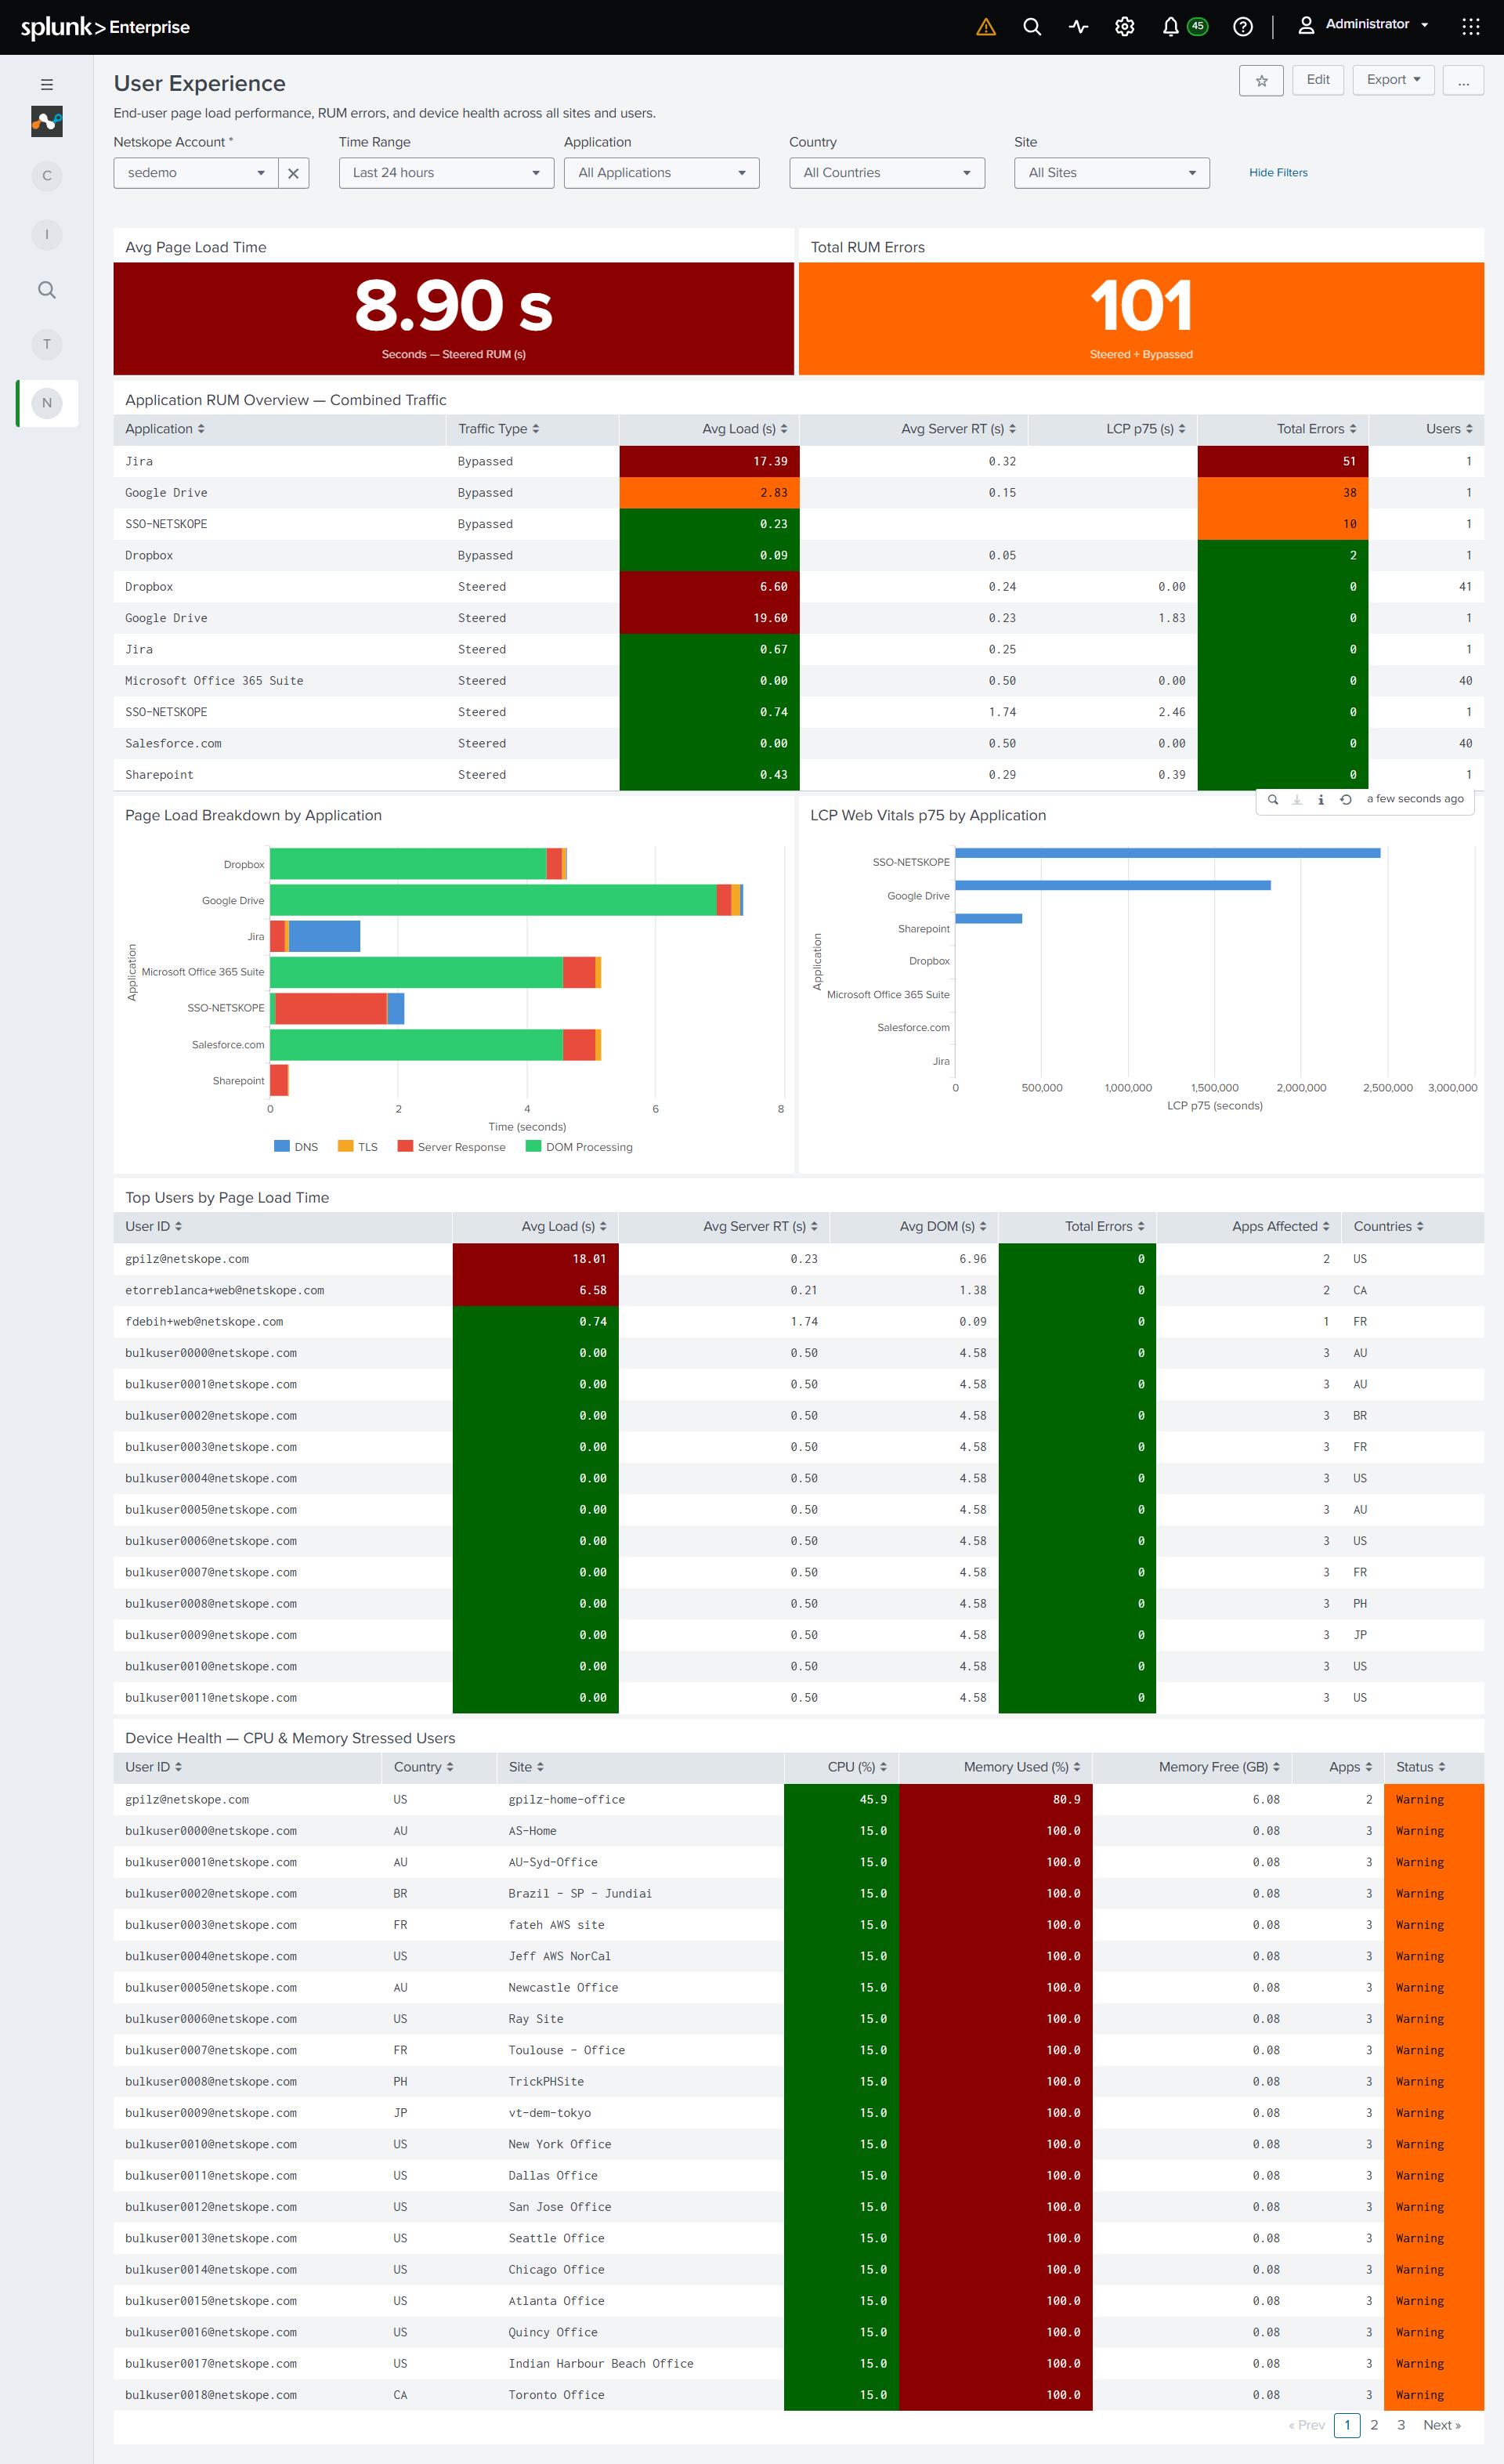
- User Experience: Page load times, RUM (Real User Monitoring) errors, and device health for end-users.
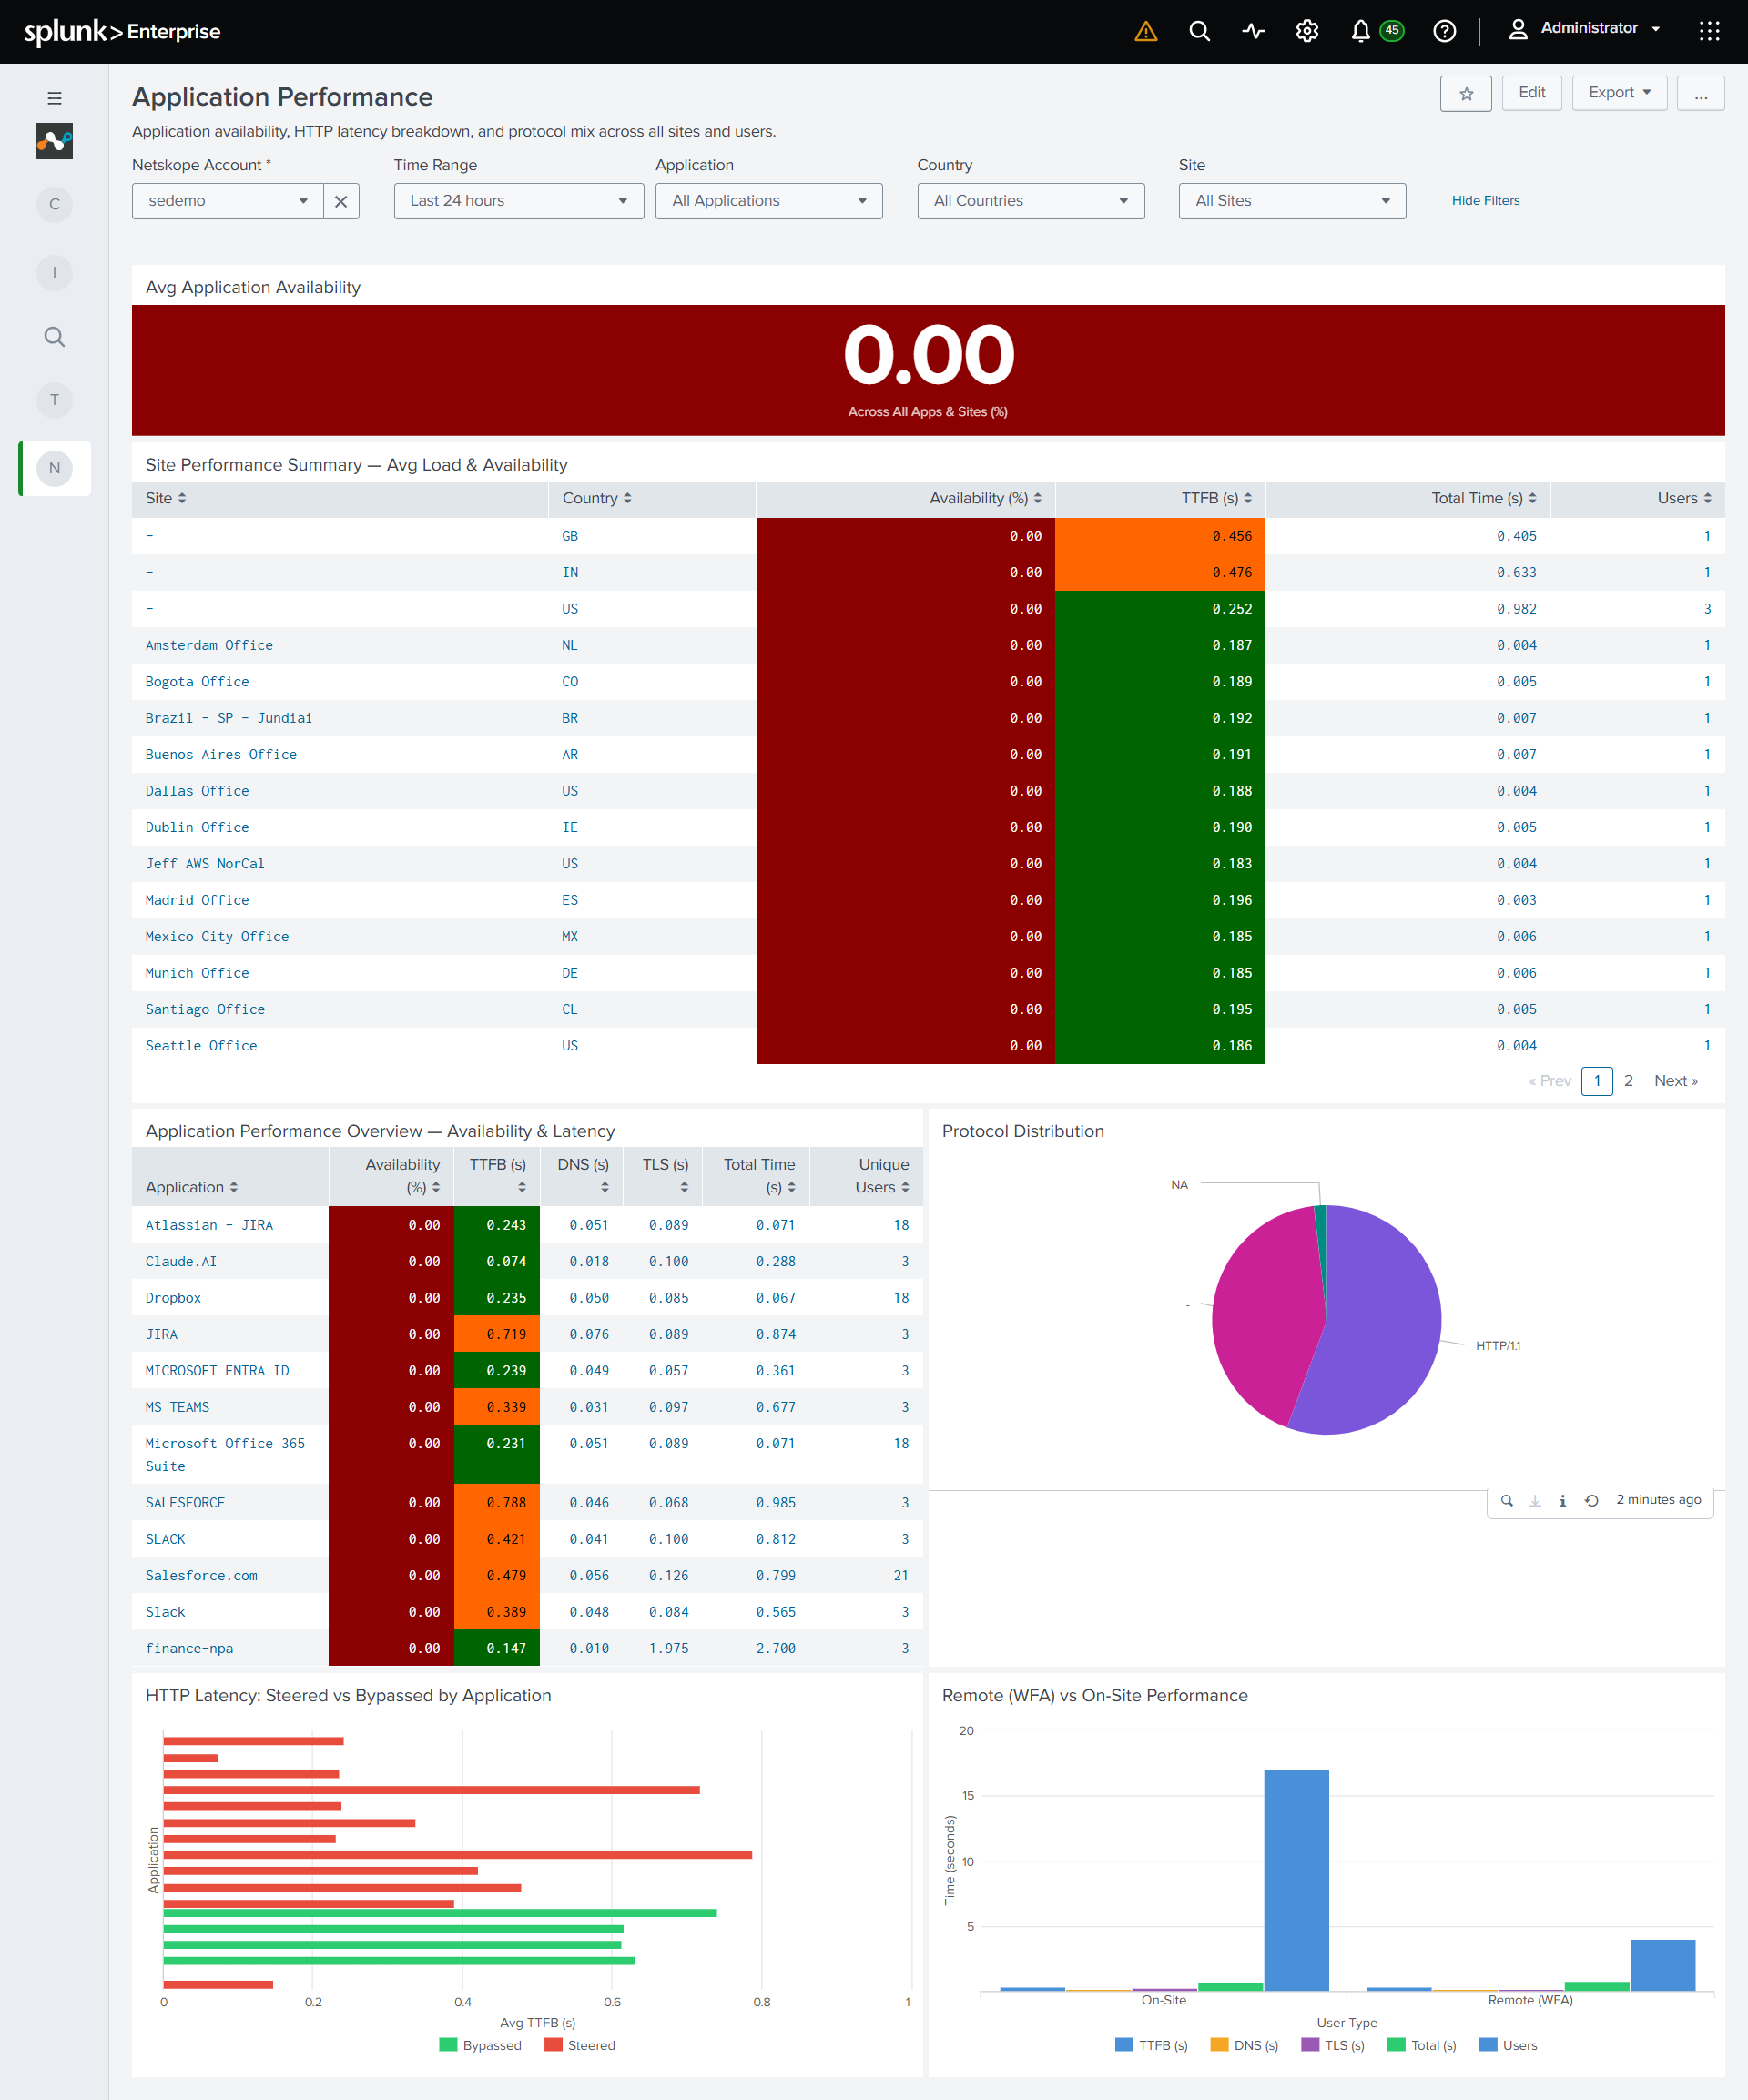
- Application Performance: Application availability, latency, and protocol distribution.
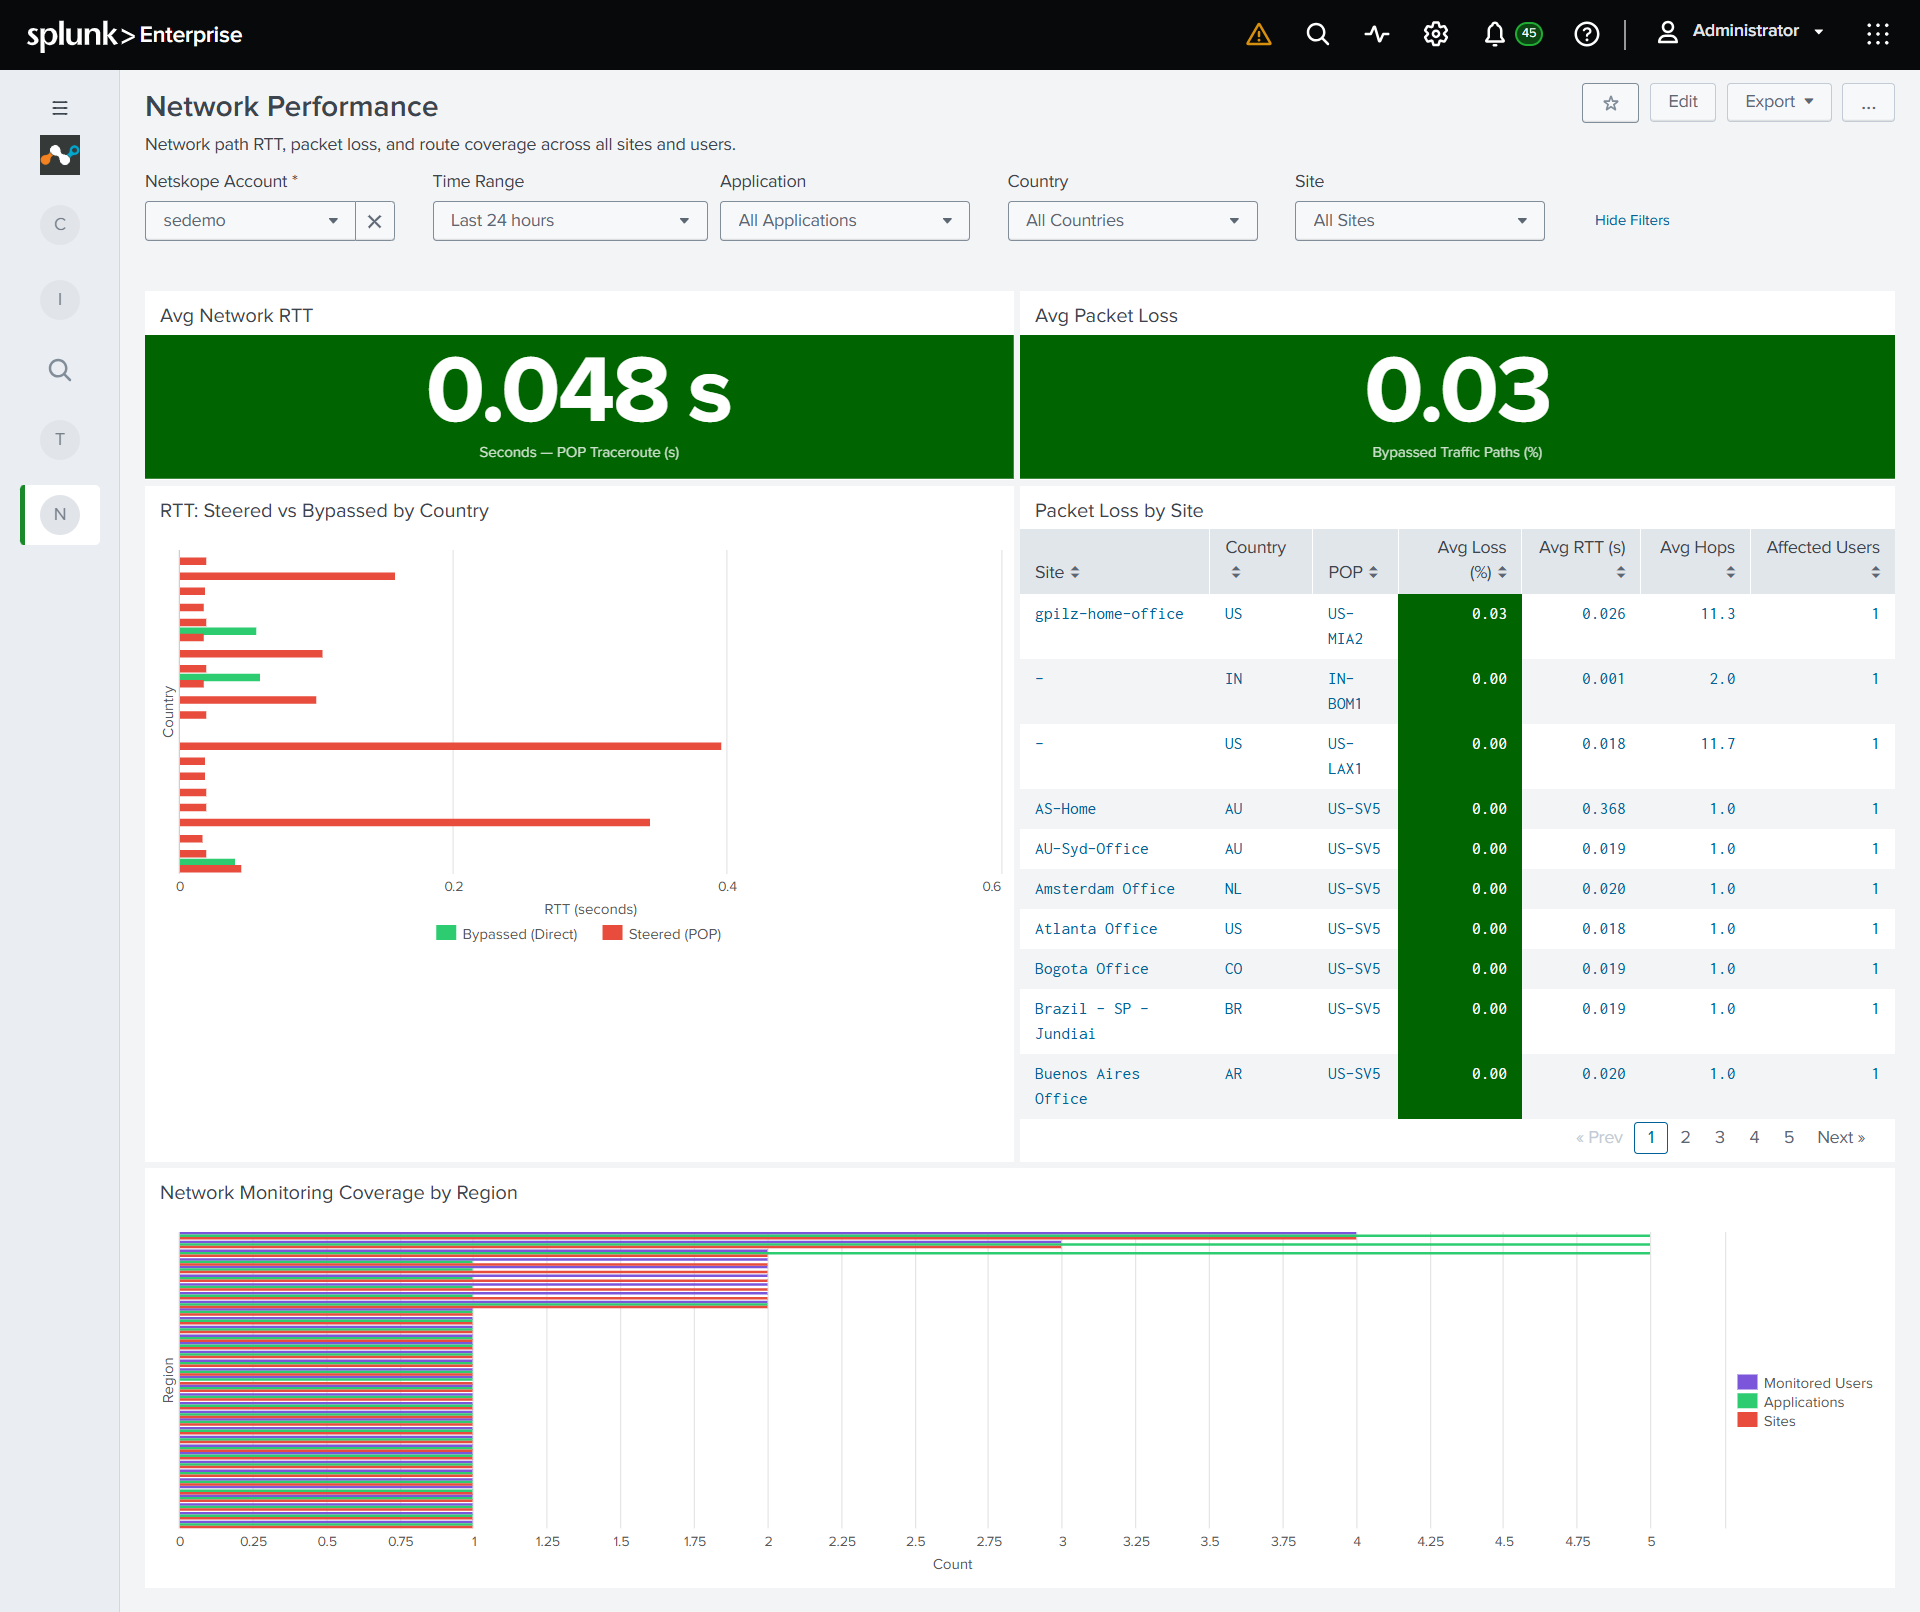
- Network Performance: Network round-trip time, packet loss, and monitoring coverage by region.
Unlike the rest of the Add-on, these dashboards do not rely on data that has been collected and indexed into Splunk. Each dashboard queries the Netskope DEM API directly, in real-time, whenever it is opened or refreshed. Because of this, populating these dashboards does not require creating or enabling any input, it only requires two things:
- A Netskope tenant with DEM enabled.
- A Netskope Account configured in the Add-on with an API token that has DEM permission.
The rest of this guide walks through getting both of those in place, including what’s different if you run Splunk in a distributed environment.
Step 1: Get a Netskope API Token with DEM Permission
The DEM dashboards require a Netskope API V2 token that includes the DEM Query permission:
- Endpoint permission:
/api/v2/dem/query/getdataset(Read, Write) - Equivalent Role permission: Administration > Advanced Diagnostics: View
In addition, the token’s Role must include at least one of the following, or the Splunk Add-on will not be able to save the Account (this is a baseline requirement for any V2 token, independent of DEM):
- Administration > Audit Log: View, or
- Events and Analytics > Skope IT > Page Events: View
If you’re reusing a Service Account that already collects Events or Alerts into Splunk, this permission is typically already present. If you’re creating a Service Account dedicated to DEM, make sure to add one of these two permissions alongside Advanced Diagnostics.
Follow Generate a Netskope API Token to create the Role and Service Account and generate the token, making sure the Role includes the permissions above. You can either create a new Role and Service Account dedicated to DEM, or add these permissions to the Role behind a Service Account you already use for other inputs (Events, Alerts, etc.).
Important
Editing a Role’s permissions regenerates the token for any Service Account assigned to it. If you add the DEM permission to an existing Role, you will get a new token value and must update it in Splunk. The previously configured token will stop working after the Role is saved.
Either way, you should now have a V2 token string in hand. Continue to Step 2 to configure it in Splunk.
Step 2: Create or Update the Netskope Account in the Add-on
The token from Step 1 is configured on a Netskope Account in the Add-on, under Splunk Home > Netskope Add-on for Splunk > Configuration > Account (tab). Follow Configure the Netskope Add-on Account to create a new Account or open an existing one for editing, and enter the token from Step 1 in the Token V2 field (not Token V1 — DEM does not work with a V1 token).
Note
Saving successfully only confirms that the token is valid and has the baseline permission described in Step 1 (Audit Log or Page Events) — it does not confirm that the DEM permission specifically is present. If the DEM permission is missing, the Account will still save without error, and the problem will only surface when you open a DEM dashboard. If a dashboard comes back empty or shows a permission error after following this guide, double-check the Role’s permissions from Step 1.
Step 3: Distributed Splunk Environments
If you run Splunk as a distributed deployment (Search Head, Indexer, and Heavy Forwarder as separate systems), there is one important difference for DEM compared to the rest of the Add-on:
- The DEM dashboards run entirely as live searches on the Search Head in the instance where you open and view them. They do not use any input, and they do not need anything configured on a Heavy Forwarder or Indexer.
- Because of this, the Netskope Account (with its DEM-scoped token) must be configured on the Search Head, even if you already have an Account configured on a Heavy Forwarder for data collection. If the Account only exists on the Heavy Forwarder, the Netskope Account dropdown on the DEM dashboards will appear empty on the Search Head.
- No additional input needs to be created anywhere for DEM, just the Account on the Search Head, following Step 2 above.
- If your Search Head is part of a Search Head Cluster, push the Account configuration to all cluster members using the deployer so every member can populate the dashboards.
Step 4: Open and Use the Dashboards
- From the Splunk Home page, go to Netskope Add-on for Splunk, then open the Netskope Digital Experience Monitoring navigation collection.
- Choose one of the three dashboards: User Experience, Application Performance, or Network Performance.
- Select a Netskope Account from the dropdown at the top of the dashboard. The dashboard remains blank until an account is selected.
- Select a Time Range. The default is the last 24 hours. Note that All Time is not a supported option for these dashboards; a specific time range is always required.
After an account and time range are selected, the dashboard populates automatically.
User Experience dashboard, populated view
Application Performance dashboard, populated view
Network Performance dashboard, populated view
Troubleshooting the Netskope Add-on for Splunk with DEM
Dashboard is blank, or the Netskope Account dropdown is empty
Make sure a Netskope Account is configured on the same Splunk instance you’re viewing the dashboard from. In a distributed environment, this means the Search Head, so see Step 3.
Account fails to save in the Add-on
The token’s Role is missing the baseline permission described in Step 1. Grant either Administration > Audit Log: View or Events and Analytics > Skope IT > Page Events: View, and try saving again. This is unrelated to the DEM permission itself.
Dashboard shows a permission or authorization error
The configured token likely doesn’t have the DEM permission, or has expired. Go back to Step 1, confirm the Role has Administration > Advanced Diagnostics: View, and if you regenerate the token, remember to update it on the Account (Step 2).
Dashboard loads but stays empty with no errors
Confirm your Netskope tenant has DEM enabled. Tenants without DEM data will return empty results even with a correctly configured token.