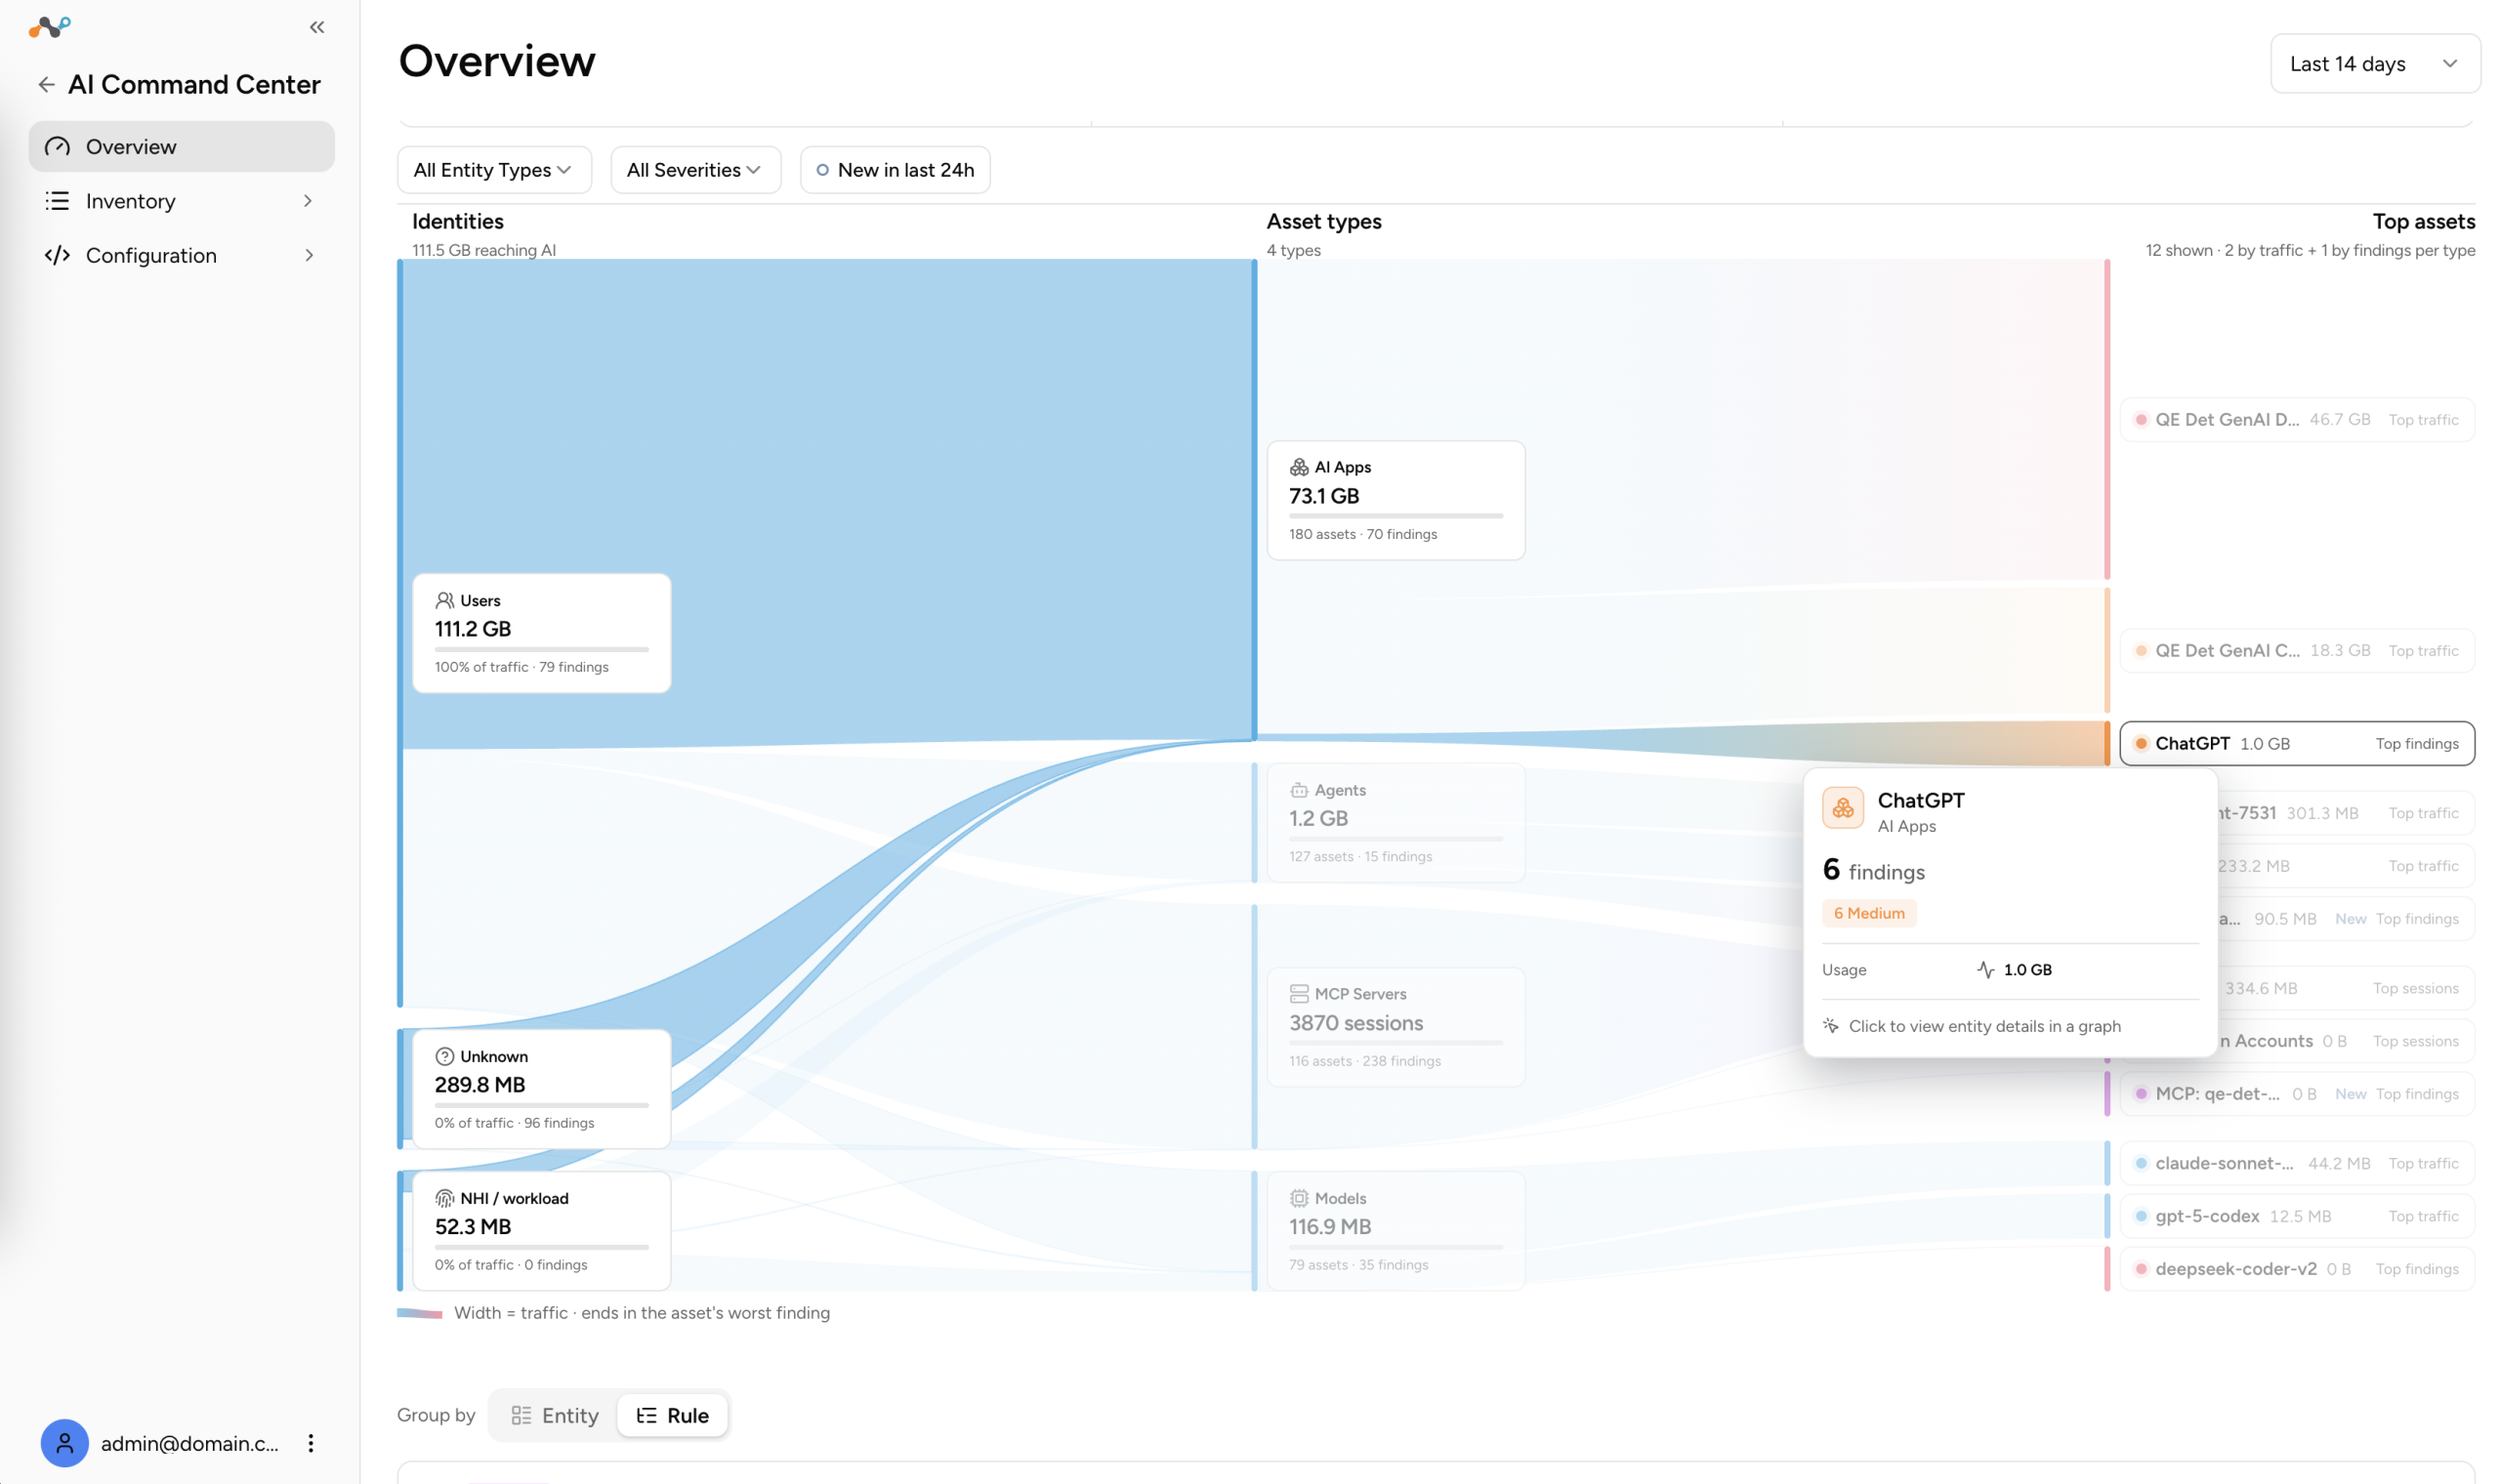
The Overview page combines a findings trend, two views of the assets that have findings, and lists you can use to drill into each asset. You can view findings in Sonar or in Flow.
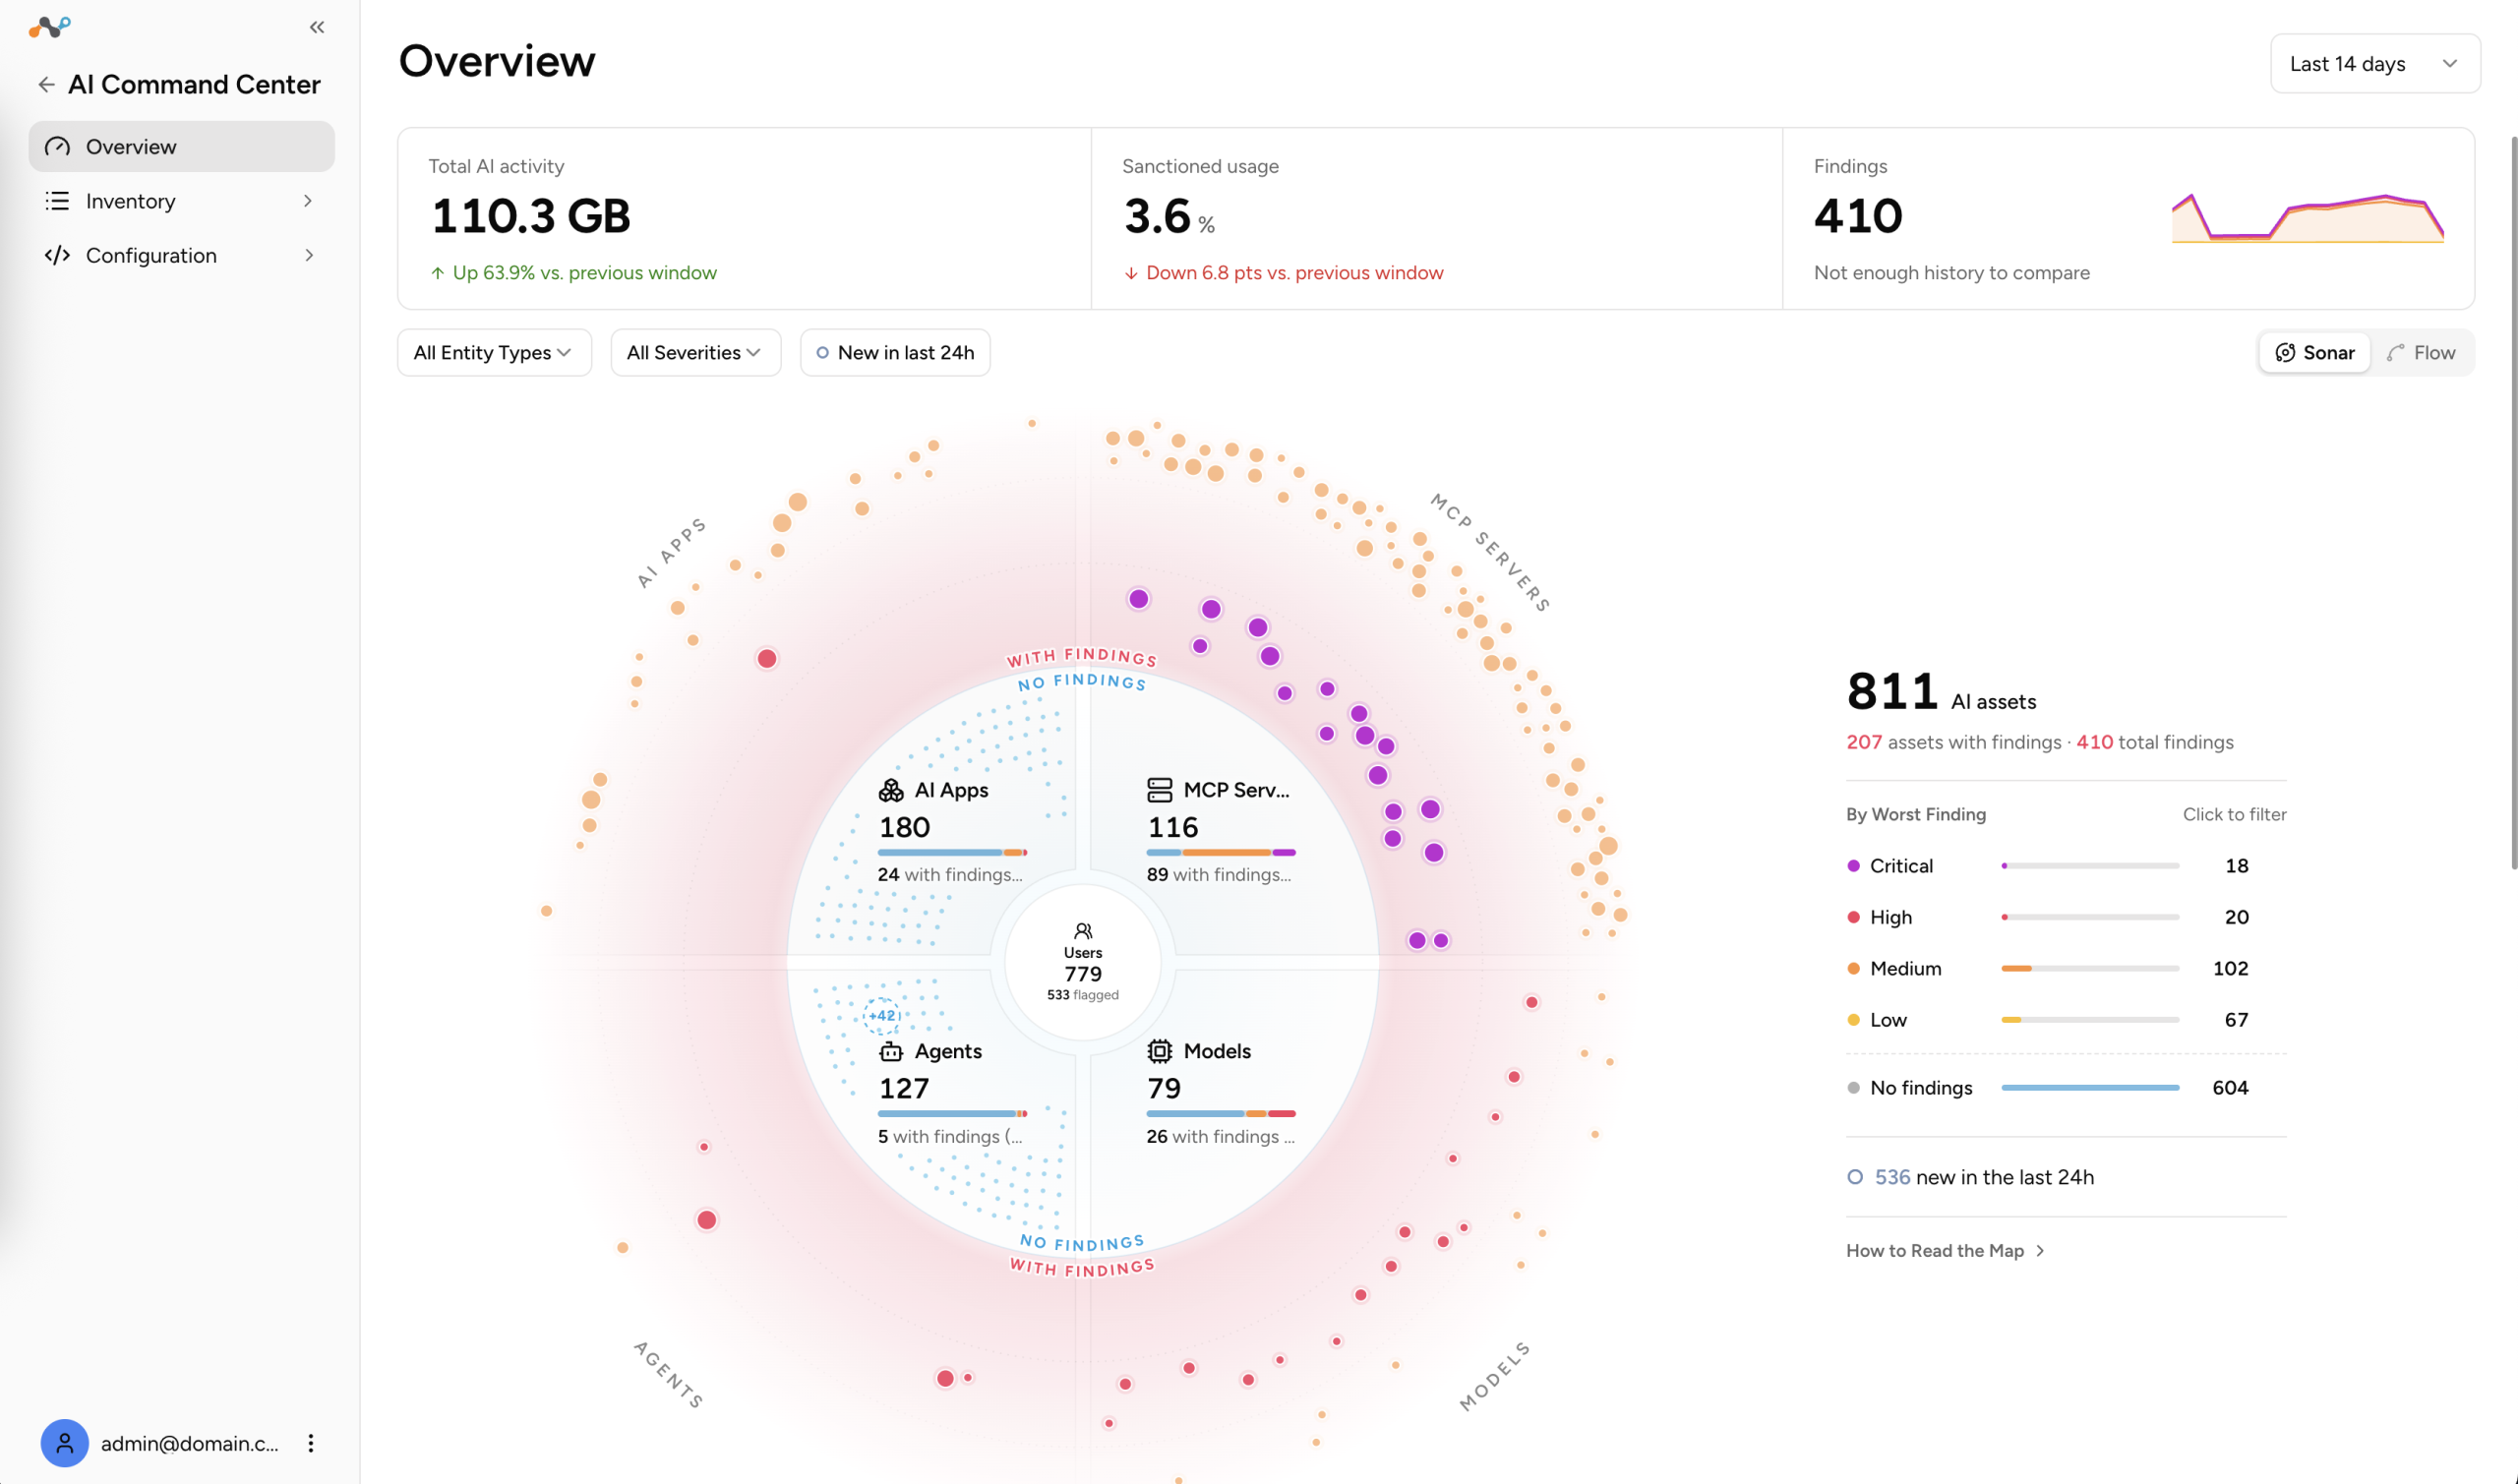
Exploring Findings in Sonar
Sonar plots all discovered AI assets. Each dot represents one asset. Assets with findings appear in color based on severity, and assets without findings appear in blue.
The appearance of each dot tells you about the findings on that asset:
- The size of the dot shows how many findings the asset has. A larger dot means more findings.
- The color of the dot shows the highest severity among its findings. Purple is critical, red is high, orange is medium and yellow is low. Blue means the asset has no findings.
- Assets with critical findings appear closest to the center, and assets with lower severity appear farther out.
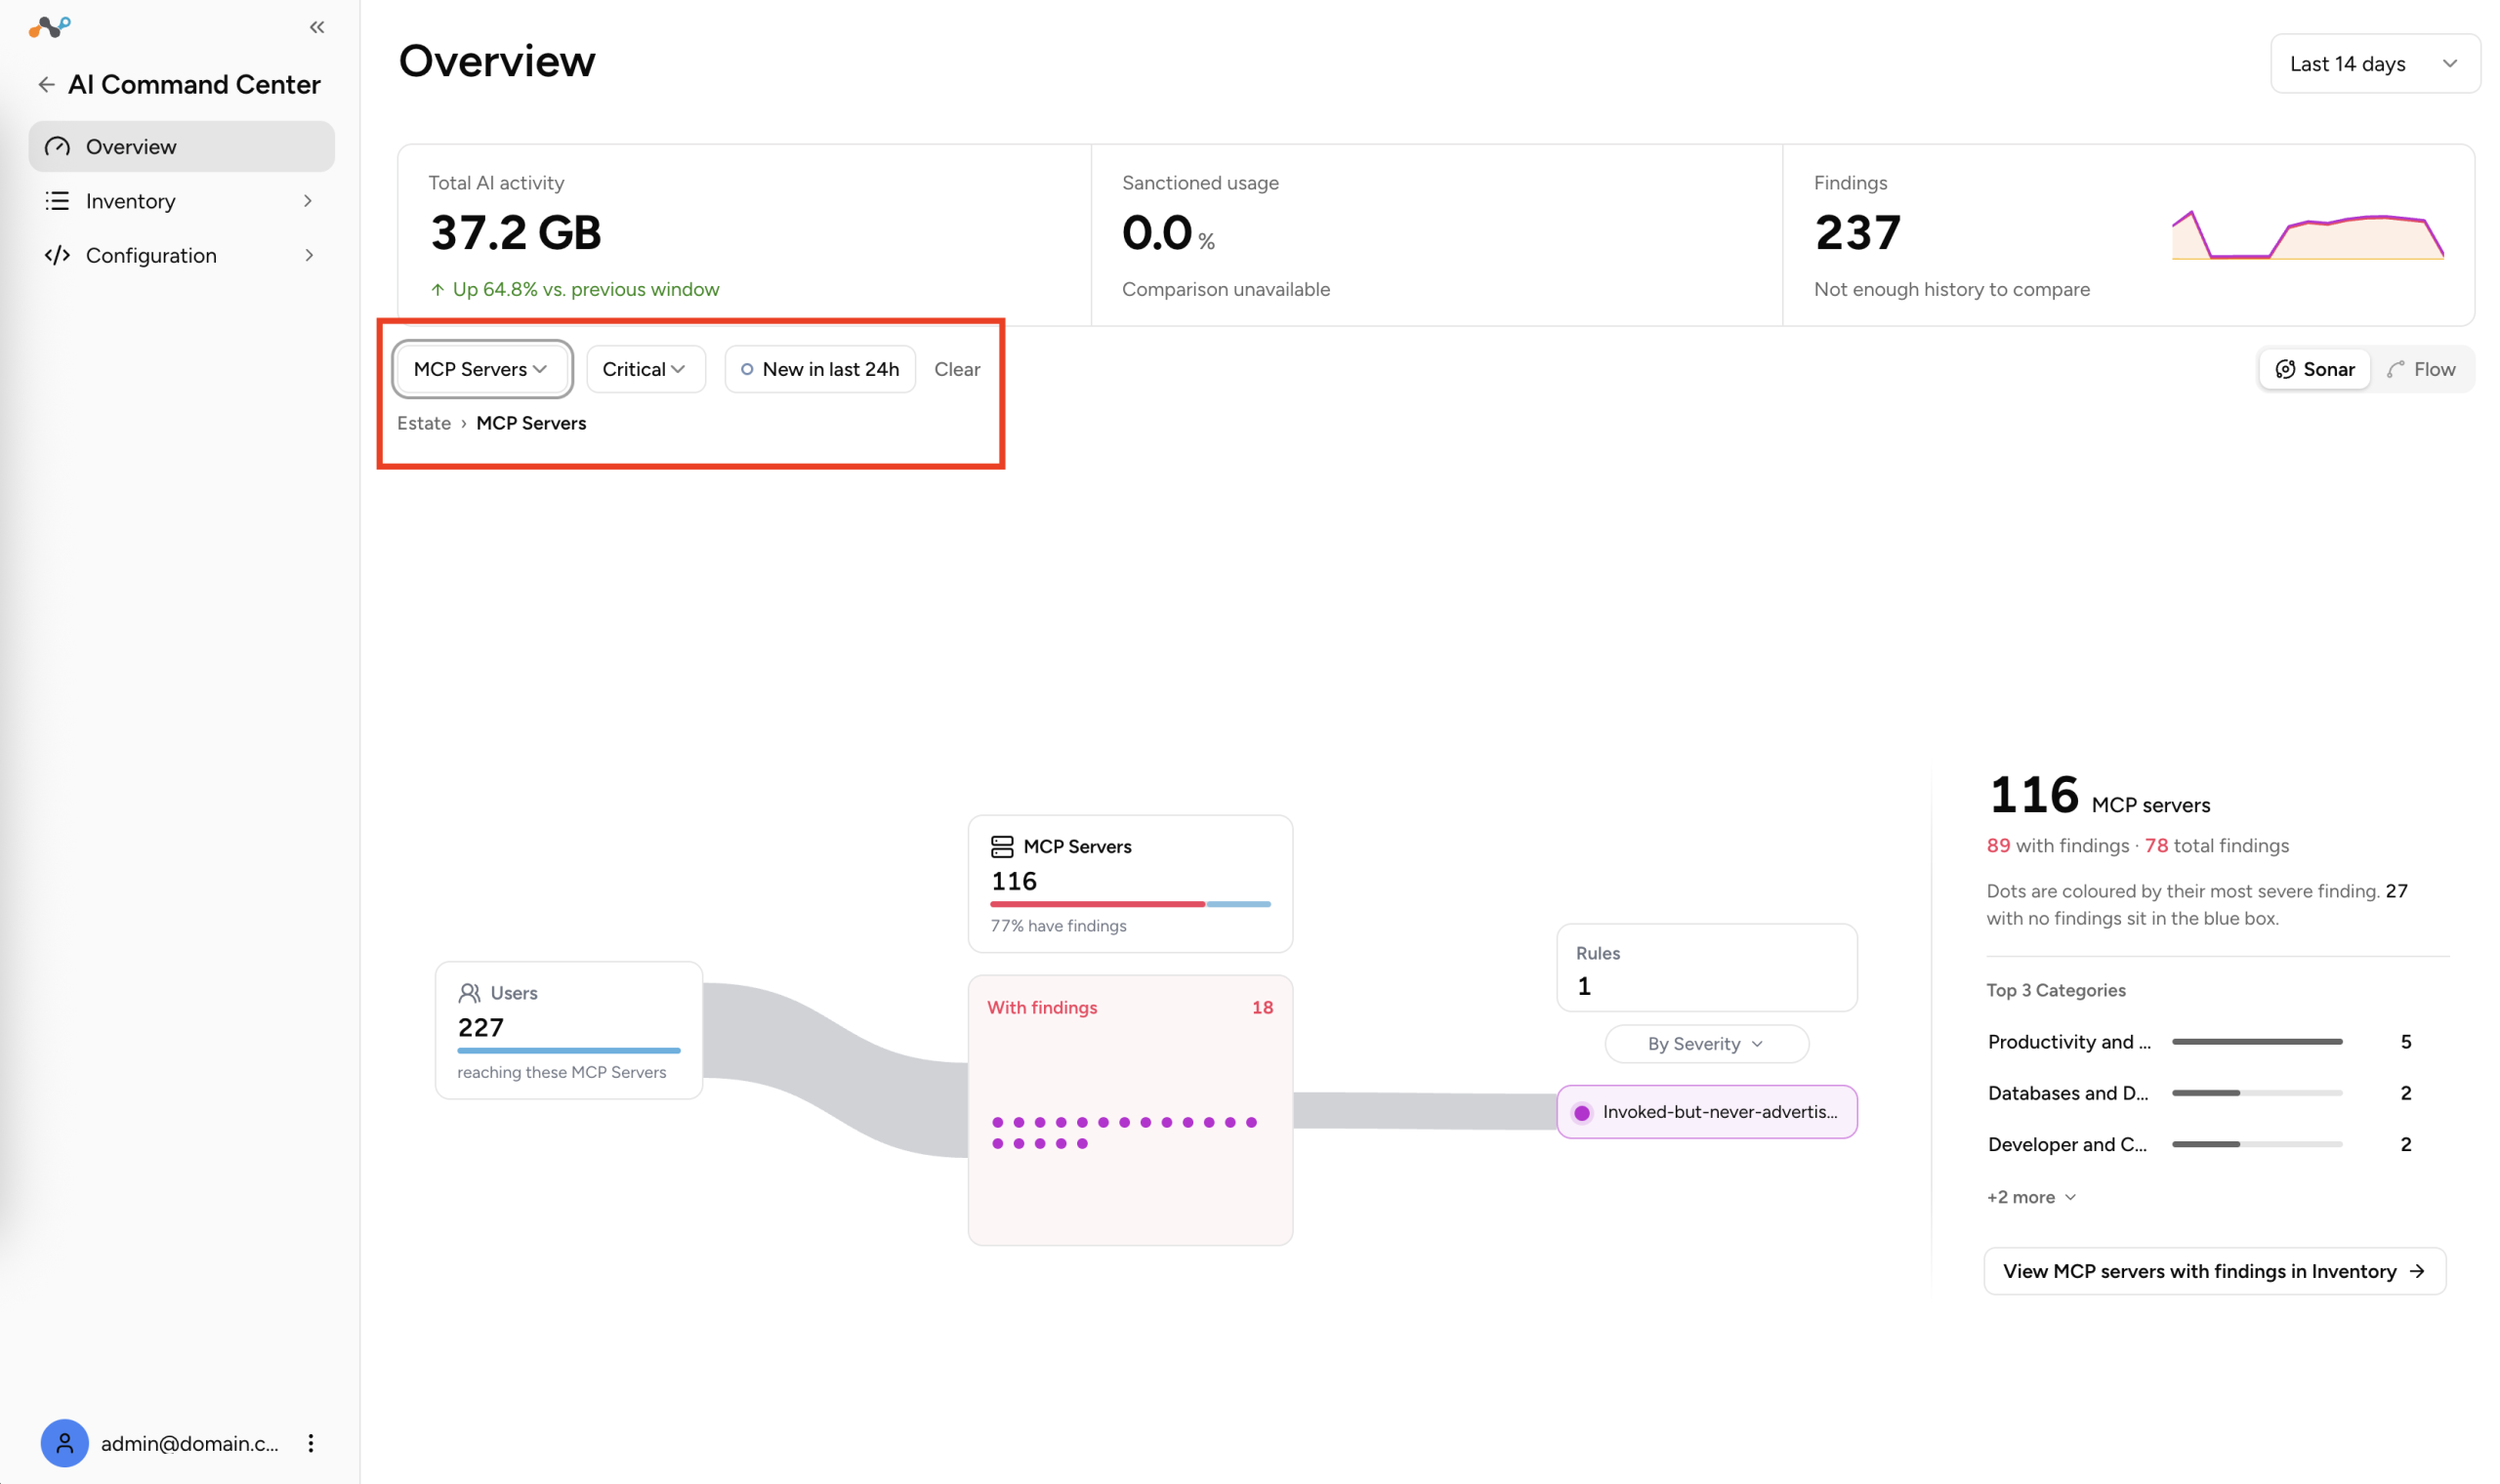
You can filter Sonar in three ways:
- By entity type: AI Apps, MCP servers, Agents, and Models.
- By severity.
- By new assets. The new filter shows assets discovered in the last 24 hours that have findings. This filter does not change when you change the time range.
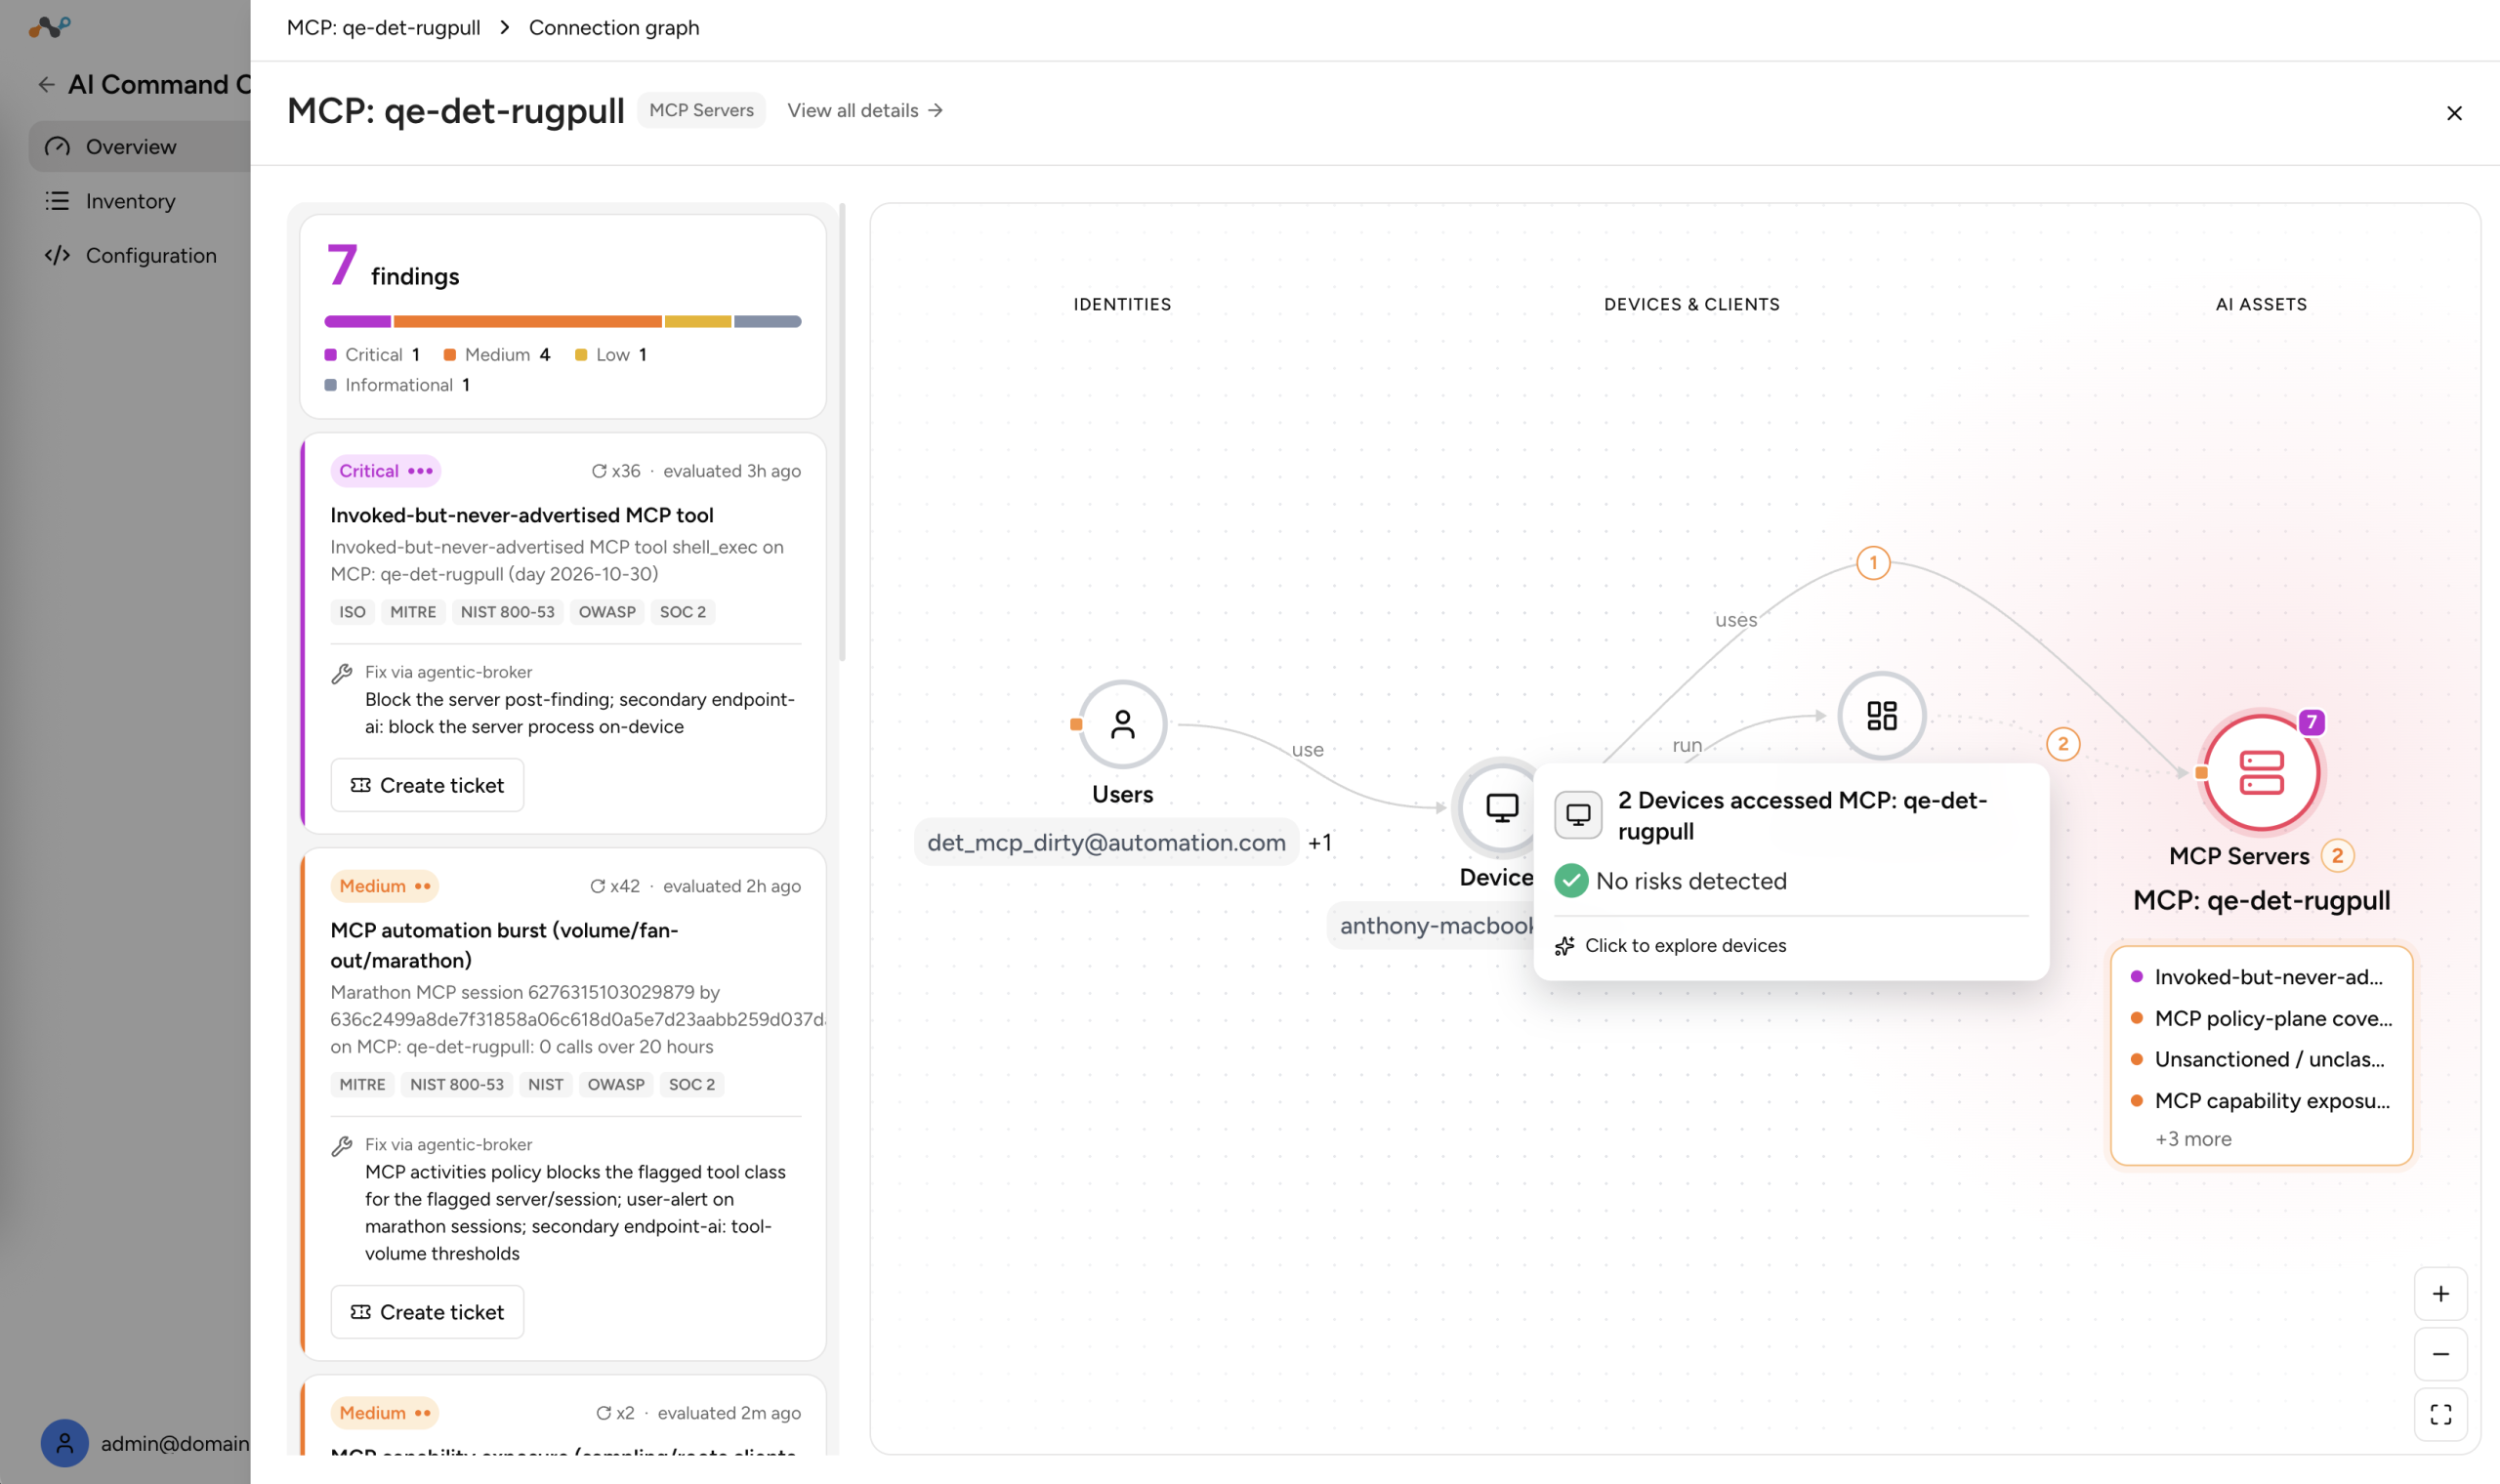
To see the details of an asset, in Sonar view, click a dot.
The detail view for the asset opens in a side panel, including its connection graph. This view lists all the findings associated with the asset and the related assets.
Reviewing Findings by Entity or by Rule
Below the visualizations, you can list findings in two groupings.
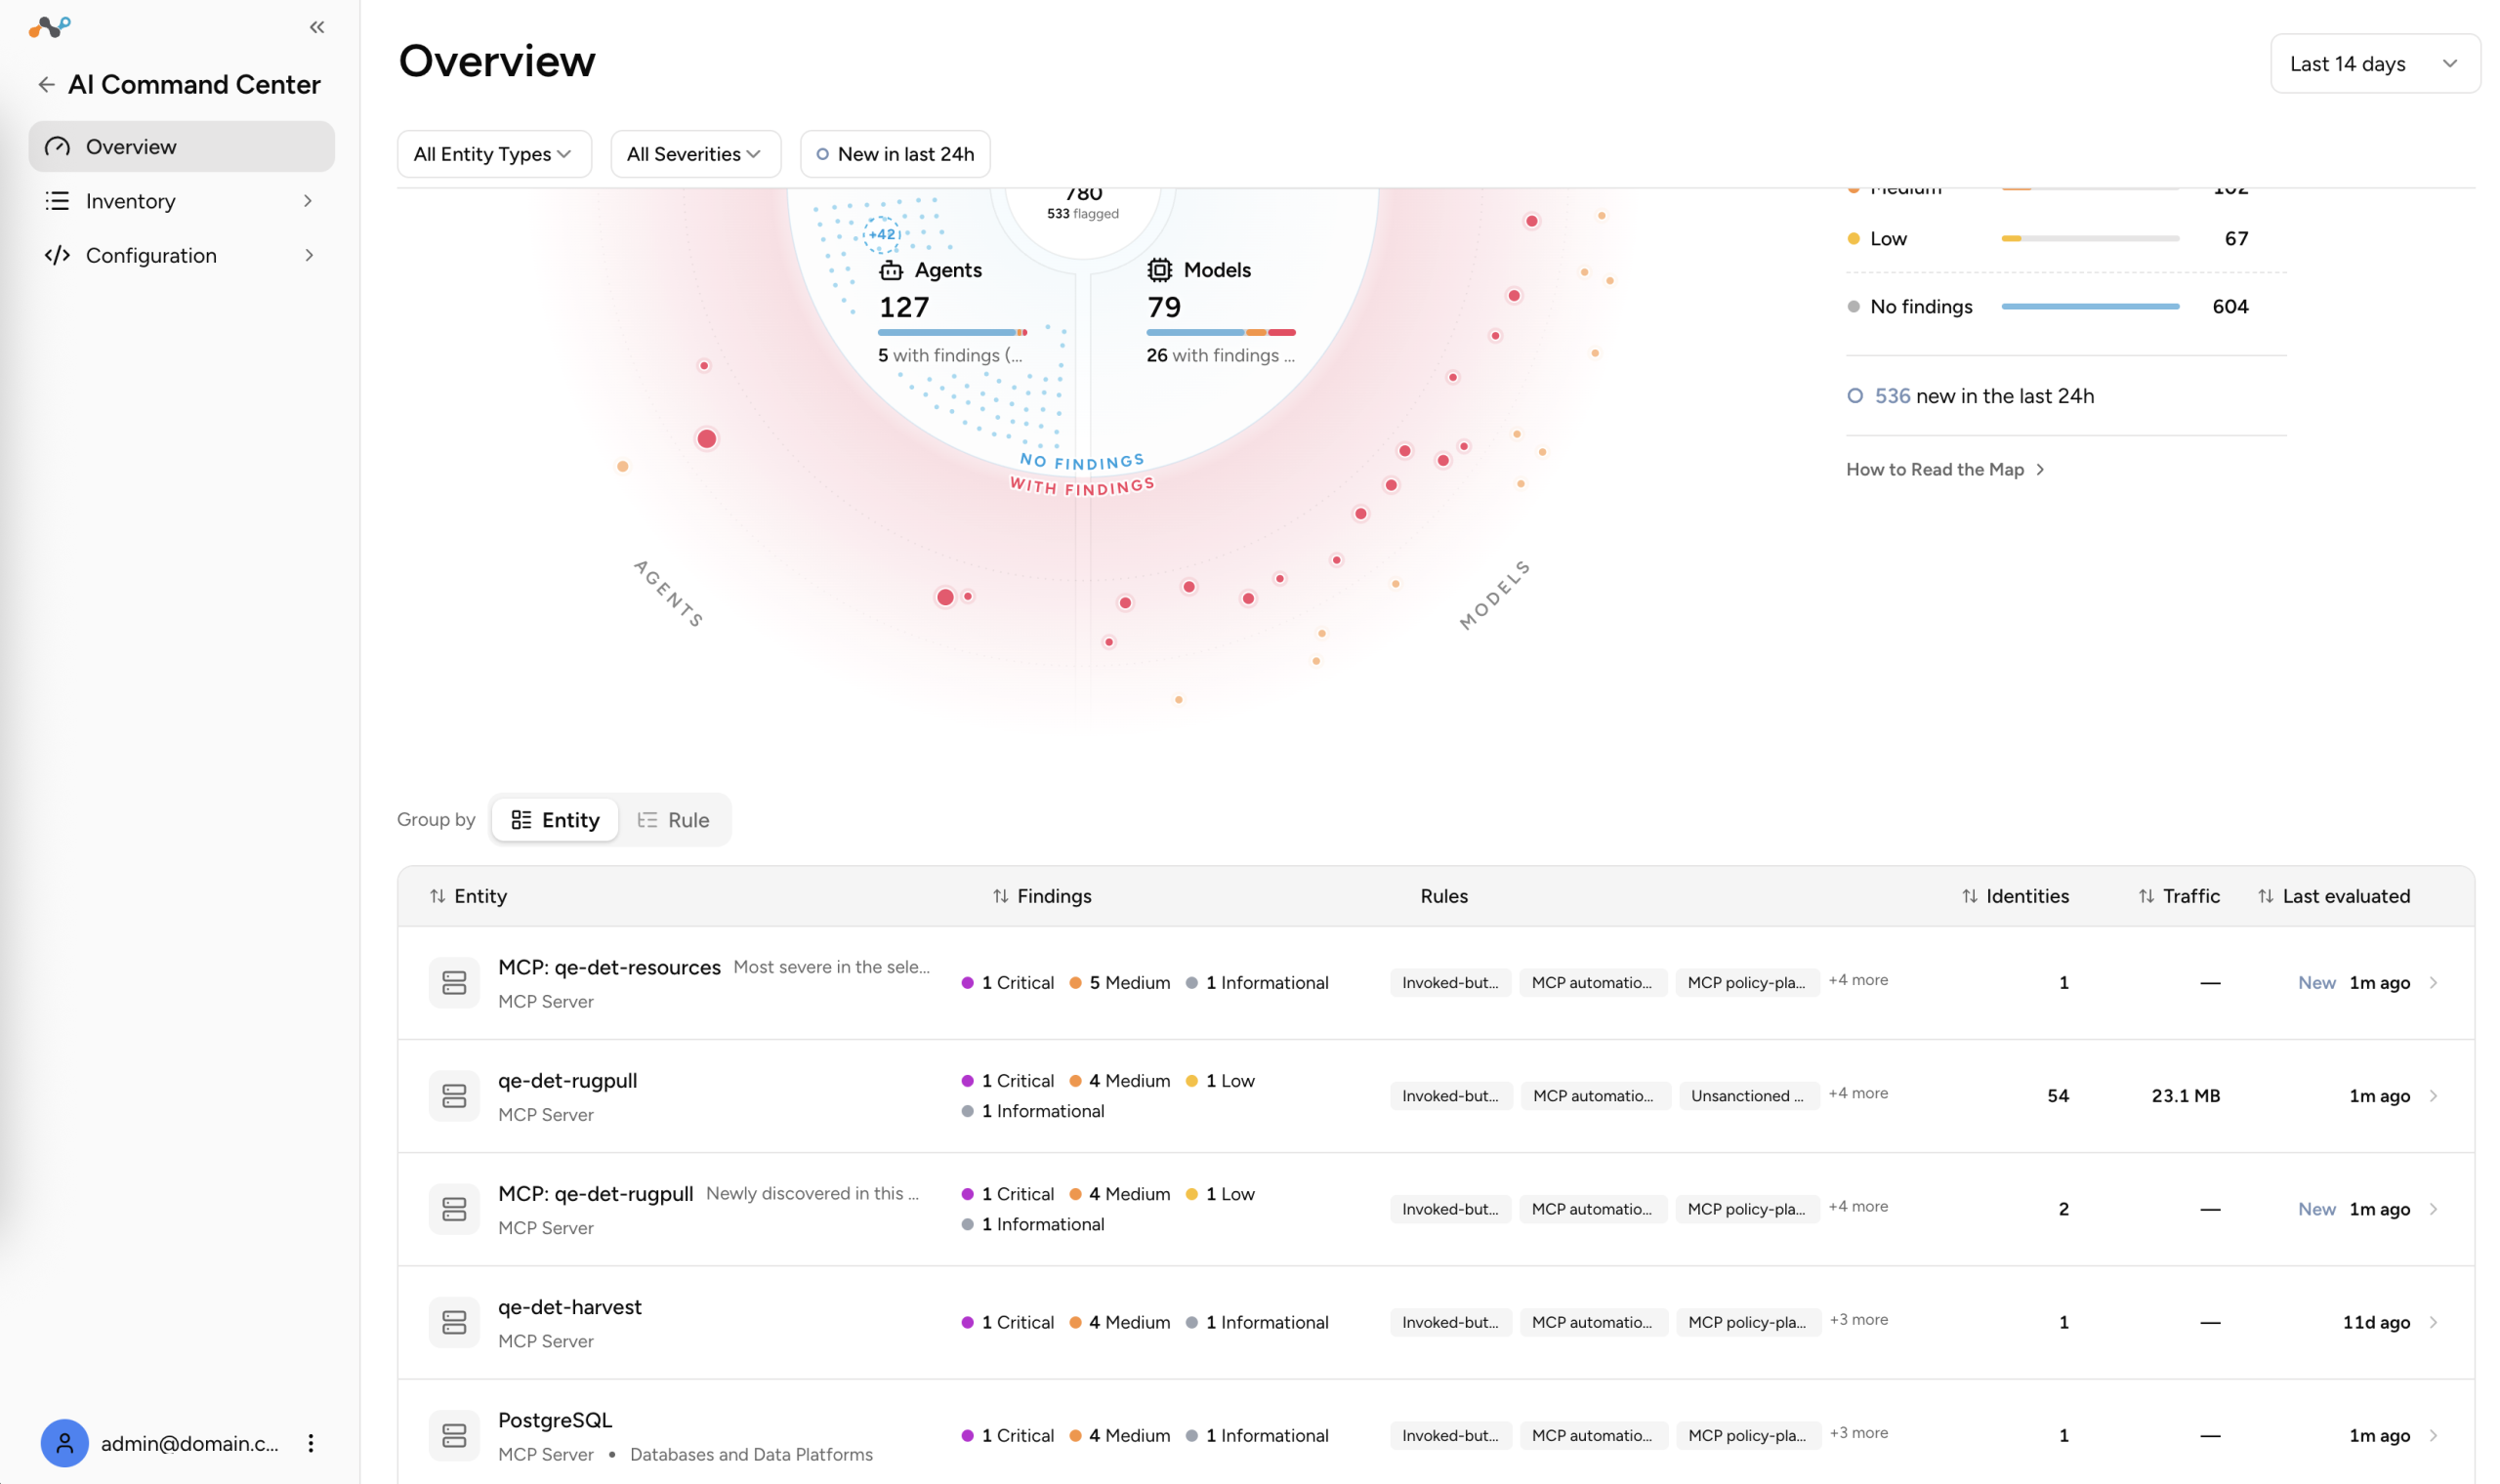
Entity List
The entity list shows each asset (app, MCP server, agent, or model) that has findings. The list sorts by highest severity, so assets with critical findings always appear first. The following table describes the information shown for each entity.
| Column | Description |
|---|---|
| Entity | The name and type of the asset. |
| Findings | The findings recorded for the asset. |
| Rules | The rules that produced the findings. |
| Identities | The users and identities related to the asset. |
| Traffic | The upload and download traffic for the asset during the selected time range. Traffic excludes blocked traffic. |
| Last evaluated | When Netskope last evaluated the asset. |
Rule List
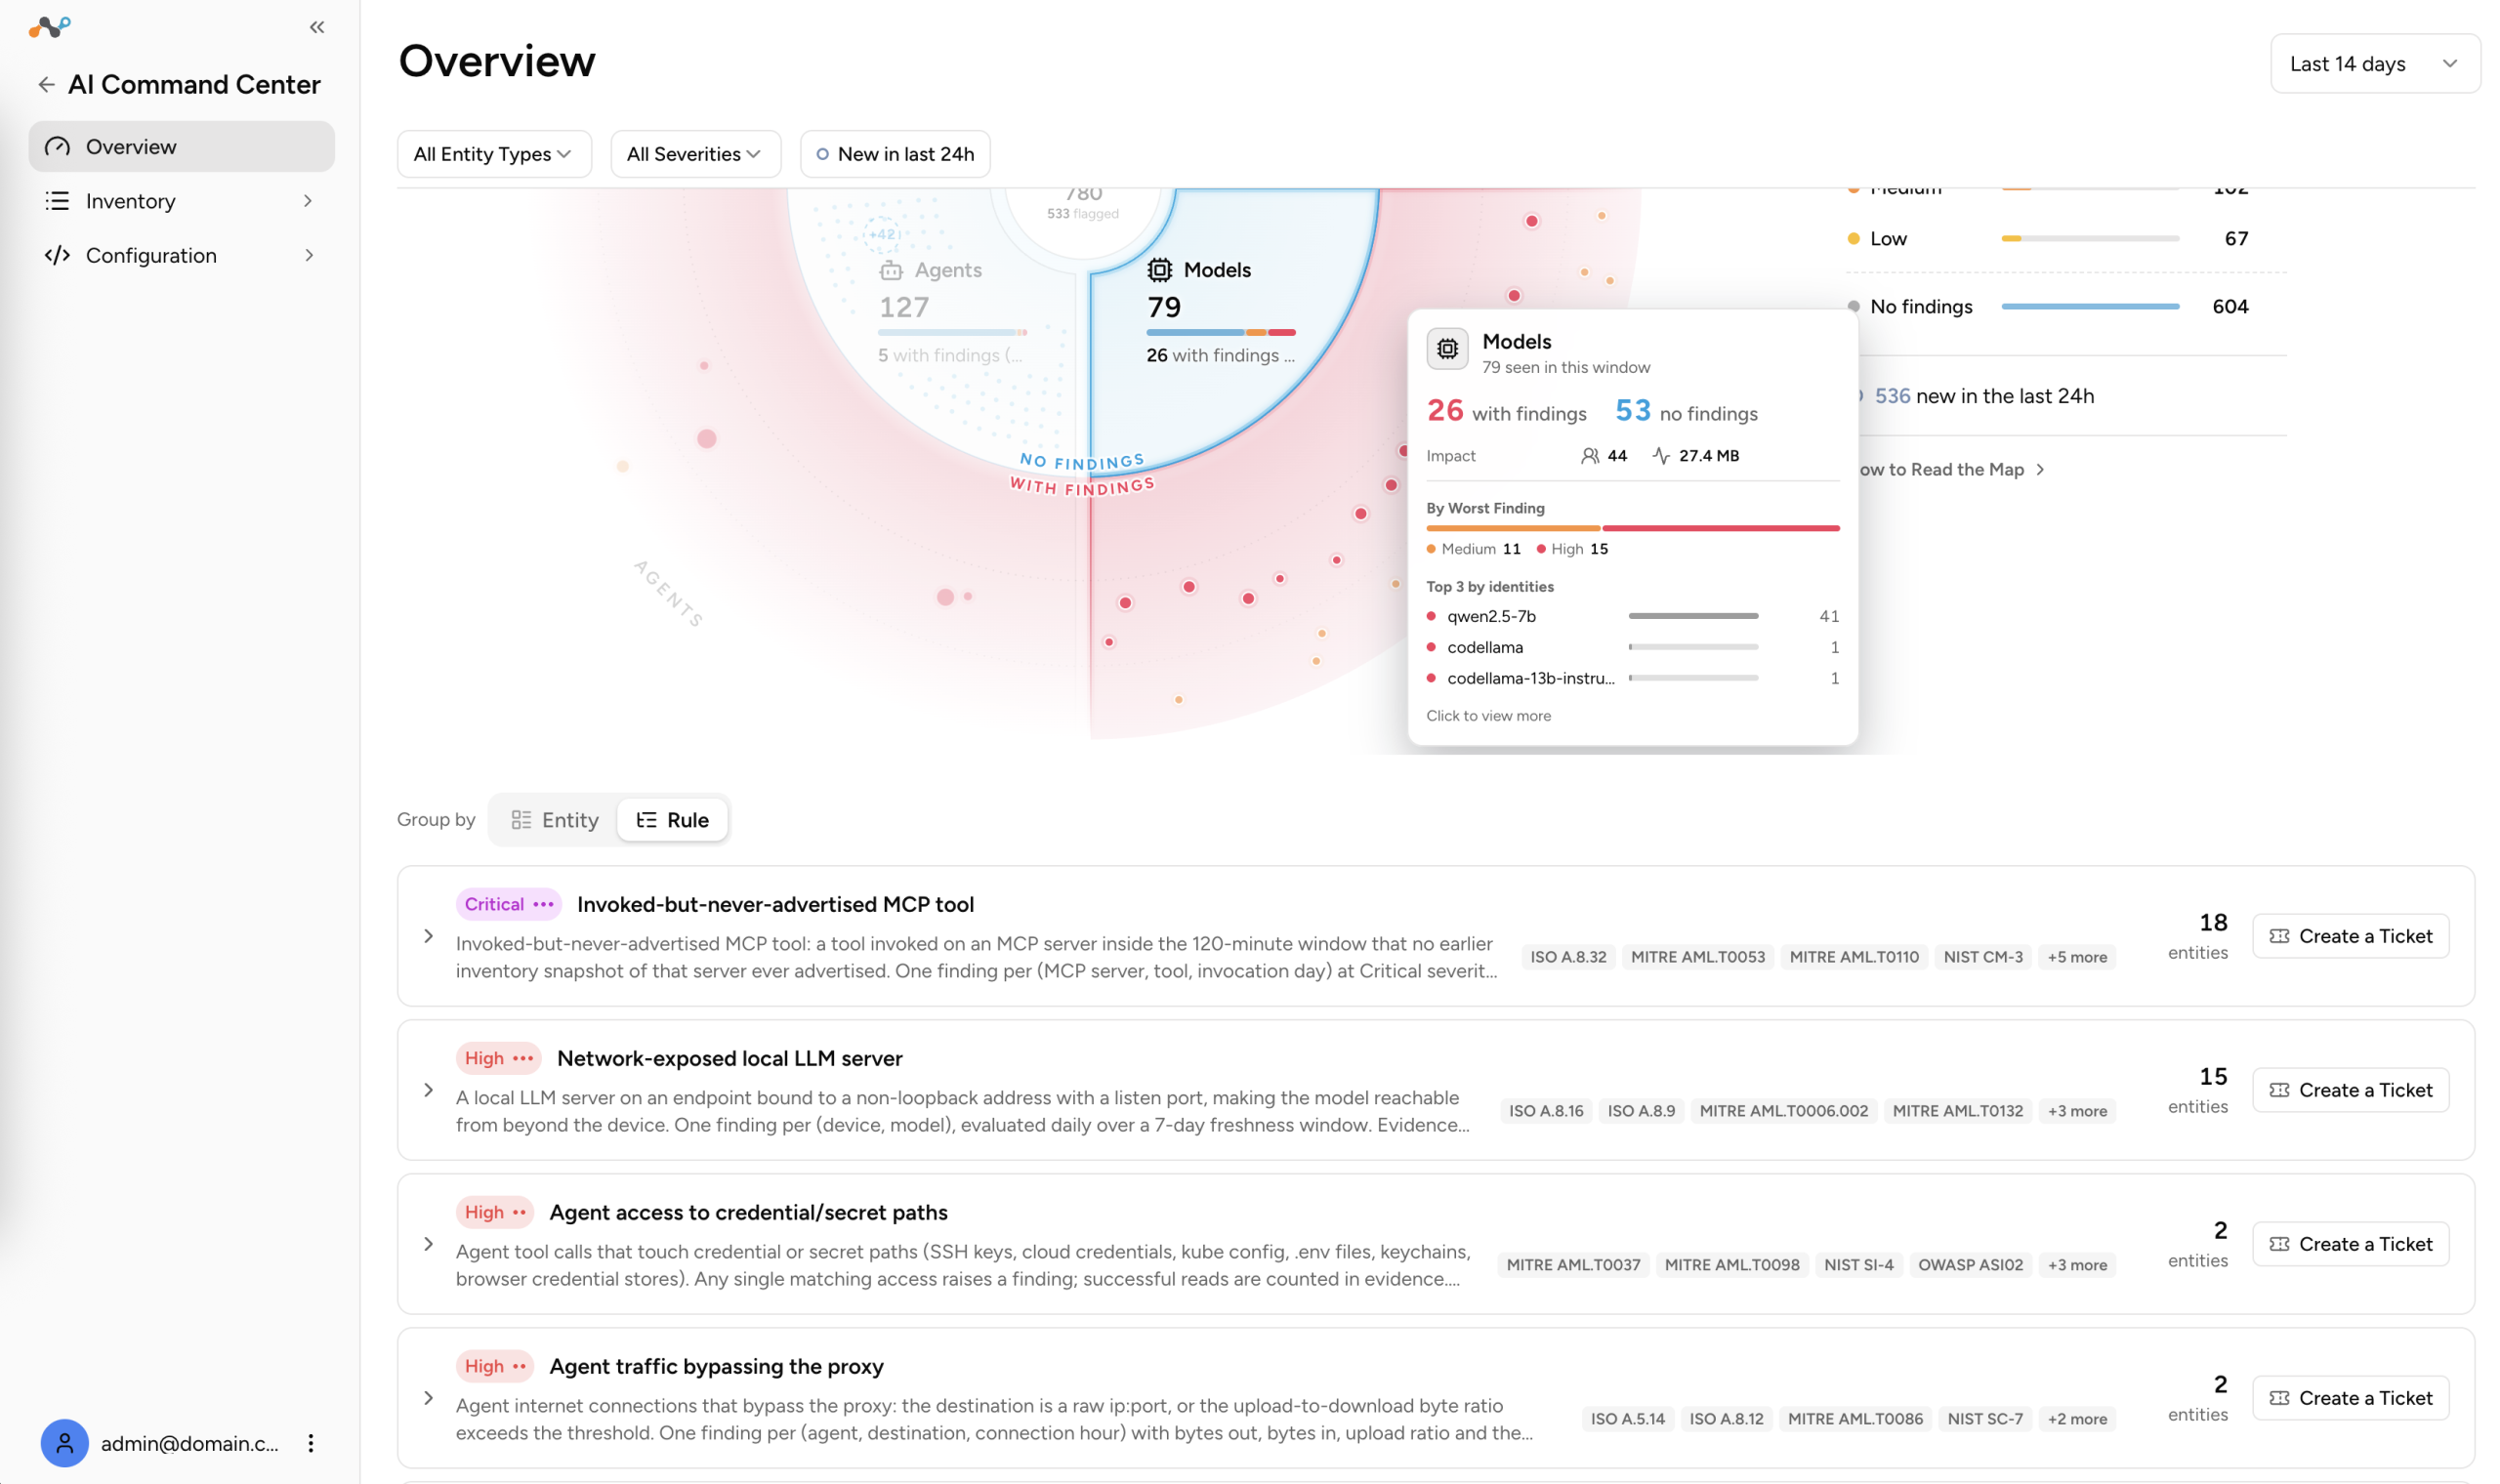
The rule list groups findings by rule. Each rule expands to show the assets that have a finding for that rule.
Click any entity to open its detail view. You can also create a ticket for a finding from these lists. See Creating a Ticket for a Finding.
Tracing Findings in Flow
Flow shows how identities connect to assets and the findings associated with them. Colors in Flow follow severity. They show how many of the findings for an asset fall into each severity level. Click an asset to open its detail view.
The traffic shown in Flow includes upload and download traffic and excludes blocked traffic.