

Netskope Agentic Reporting eliminates the burden in data reporting and analytics by combining AI-driven report construction with intelligent narrative summaries, allowing you to easily turn chaotic data into actionable insights with minimal manual effort.
This documentation describes Netskope Agentic Reporting as it works in the beta, which is the first phase of the product.
Getting Started
Netskope Agentic Reporting has five main capabilities; each is worth trying at least once.
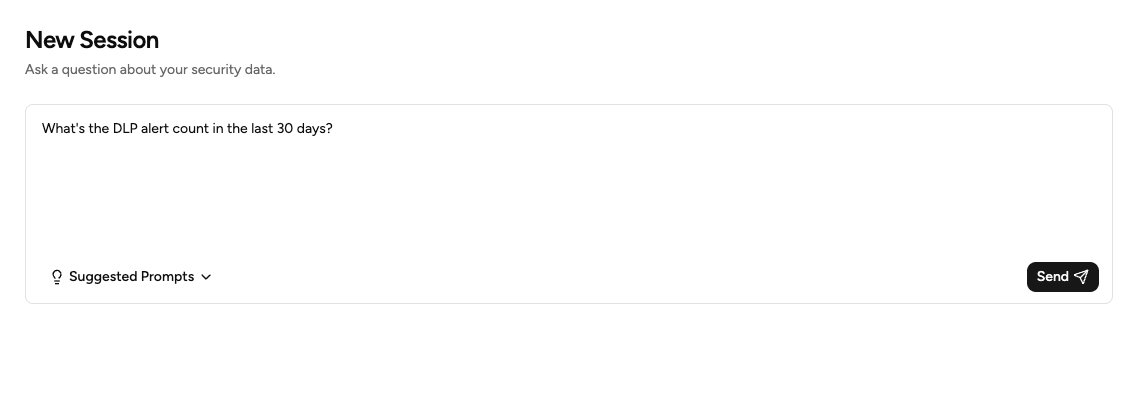
1. AI chatbot for data exploration. Type a question or choose a starter prompt, such as how many malware were detected in the last 30 days. The chatbot returns a widget/chart to answer your question. Suggested prompts are provided to help you quickly get started exploring your environment.
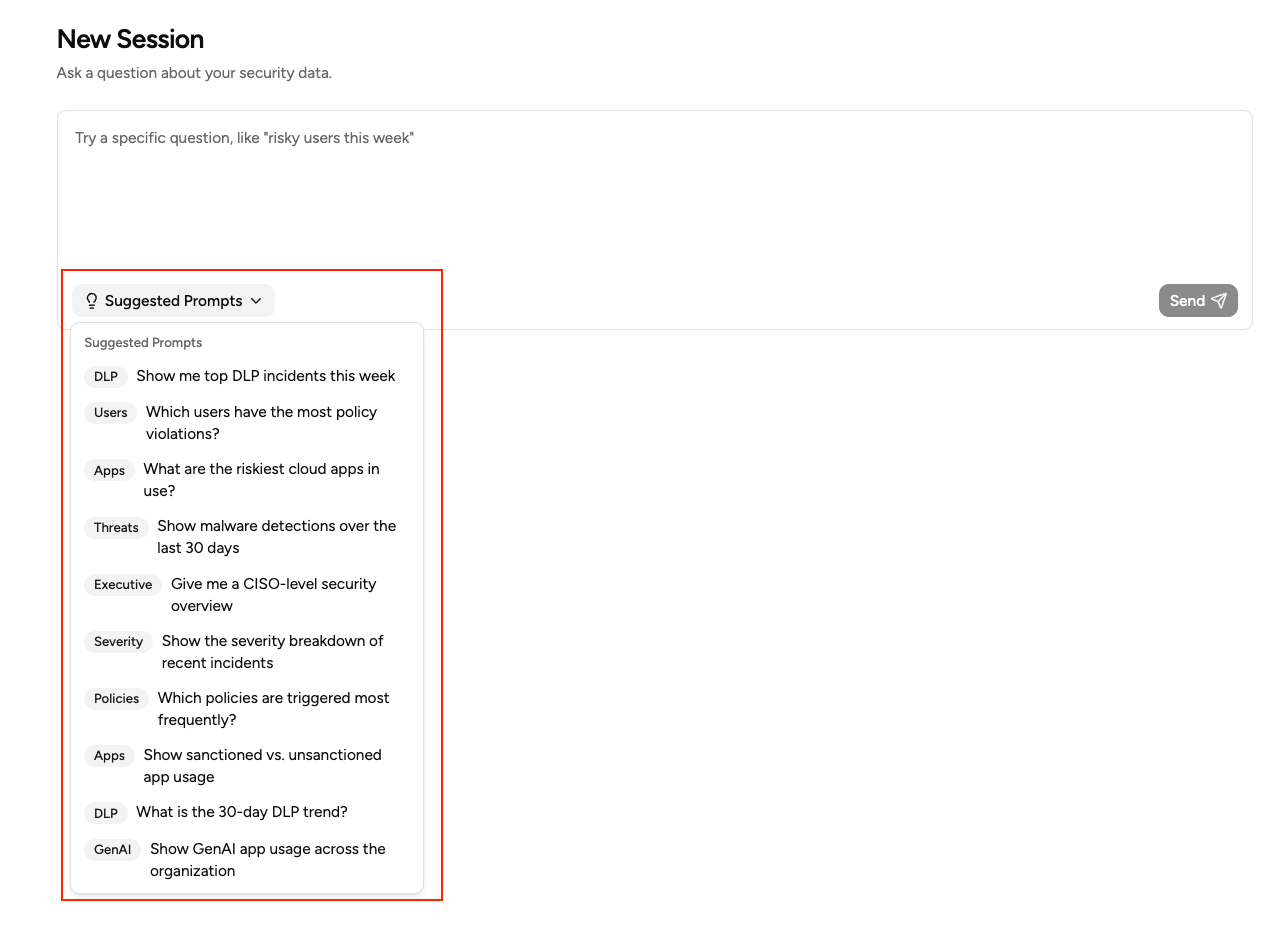
2. Iterate in the same session. Follow the AI generated suggested follow-up questions or type your own to dive into your data.
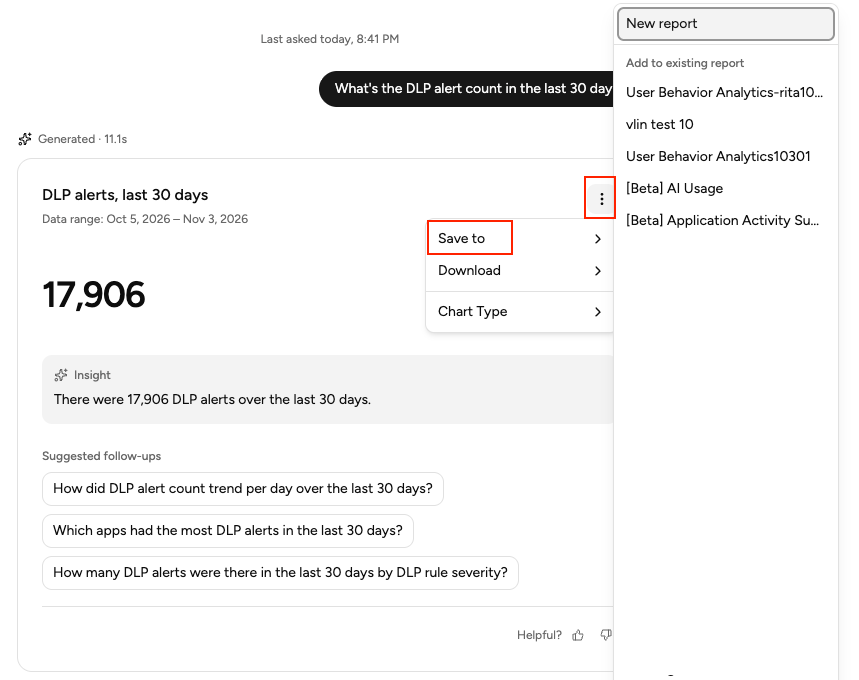
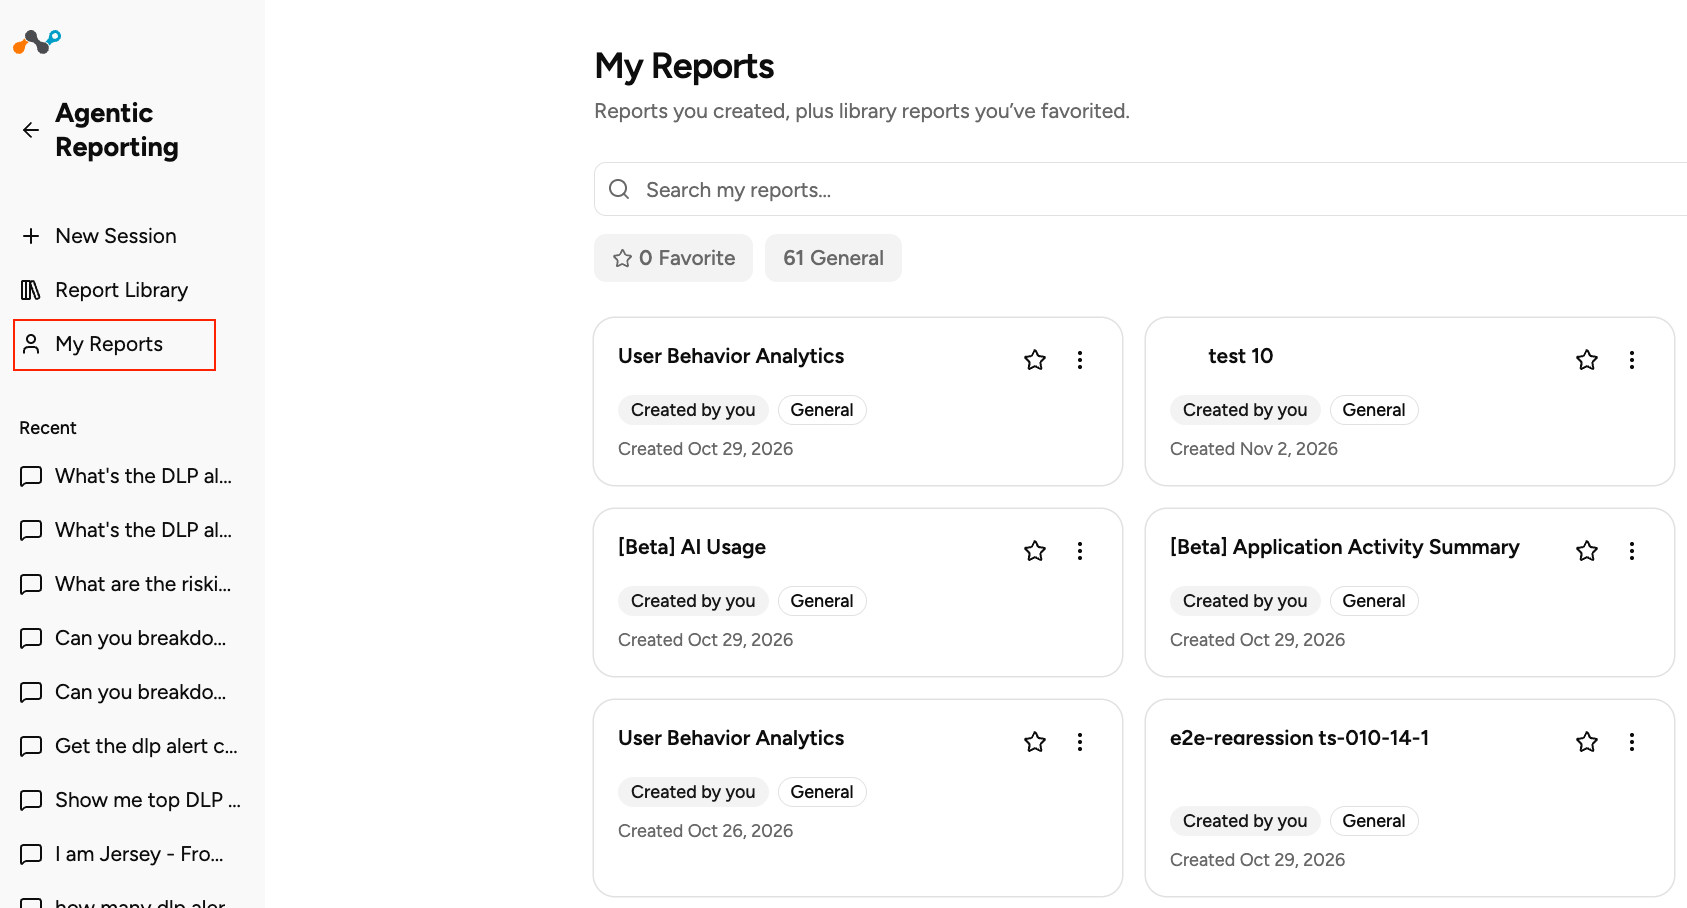
3. Save the charts/widgets to custom reports and visit them in “My Reports.”
- Save the chart/widget created to a new custom report or an existing one.
- You can visit your saved custom reports in “My Reports.”
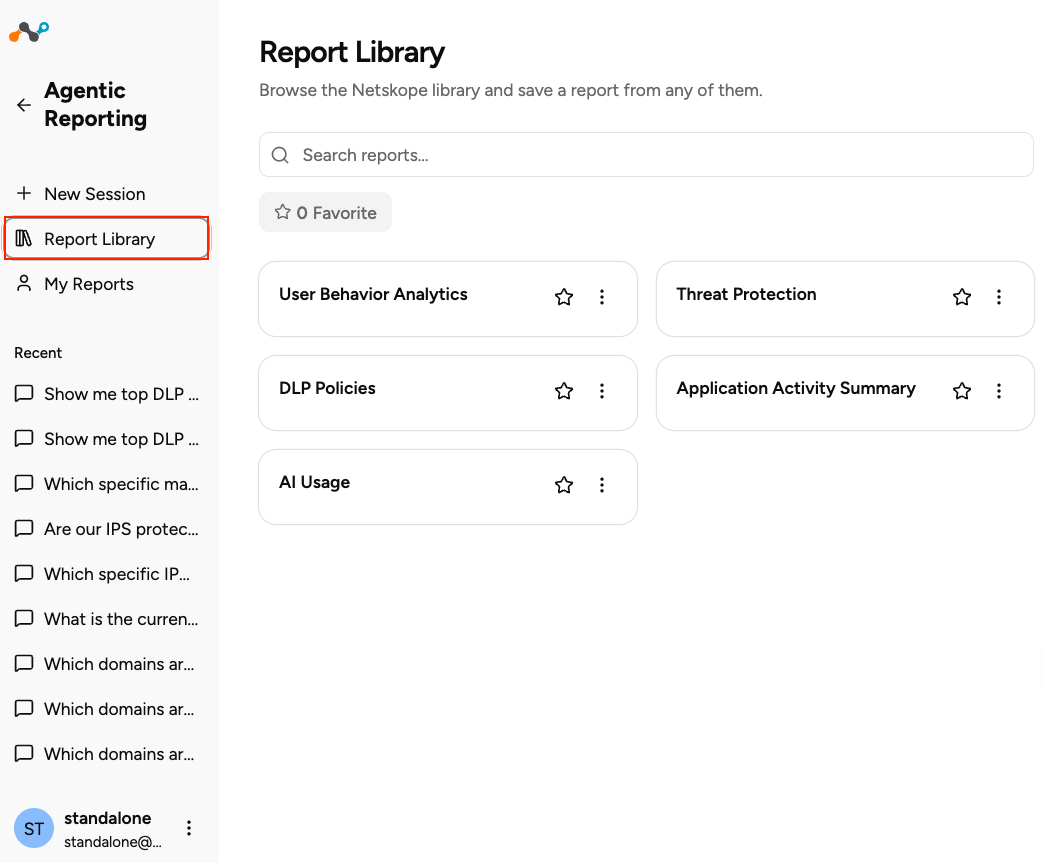
4. Access predefined reports in “Report Library.” Predefined reports can be accessed through “Report Library.” These are provided by Netskope as a starting point. You can make a copy and further customize according to your needs.
5. Leverage the AI assistant to summarize and expand your reports.
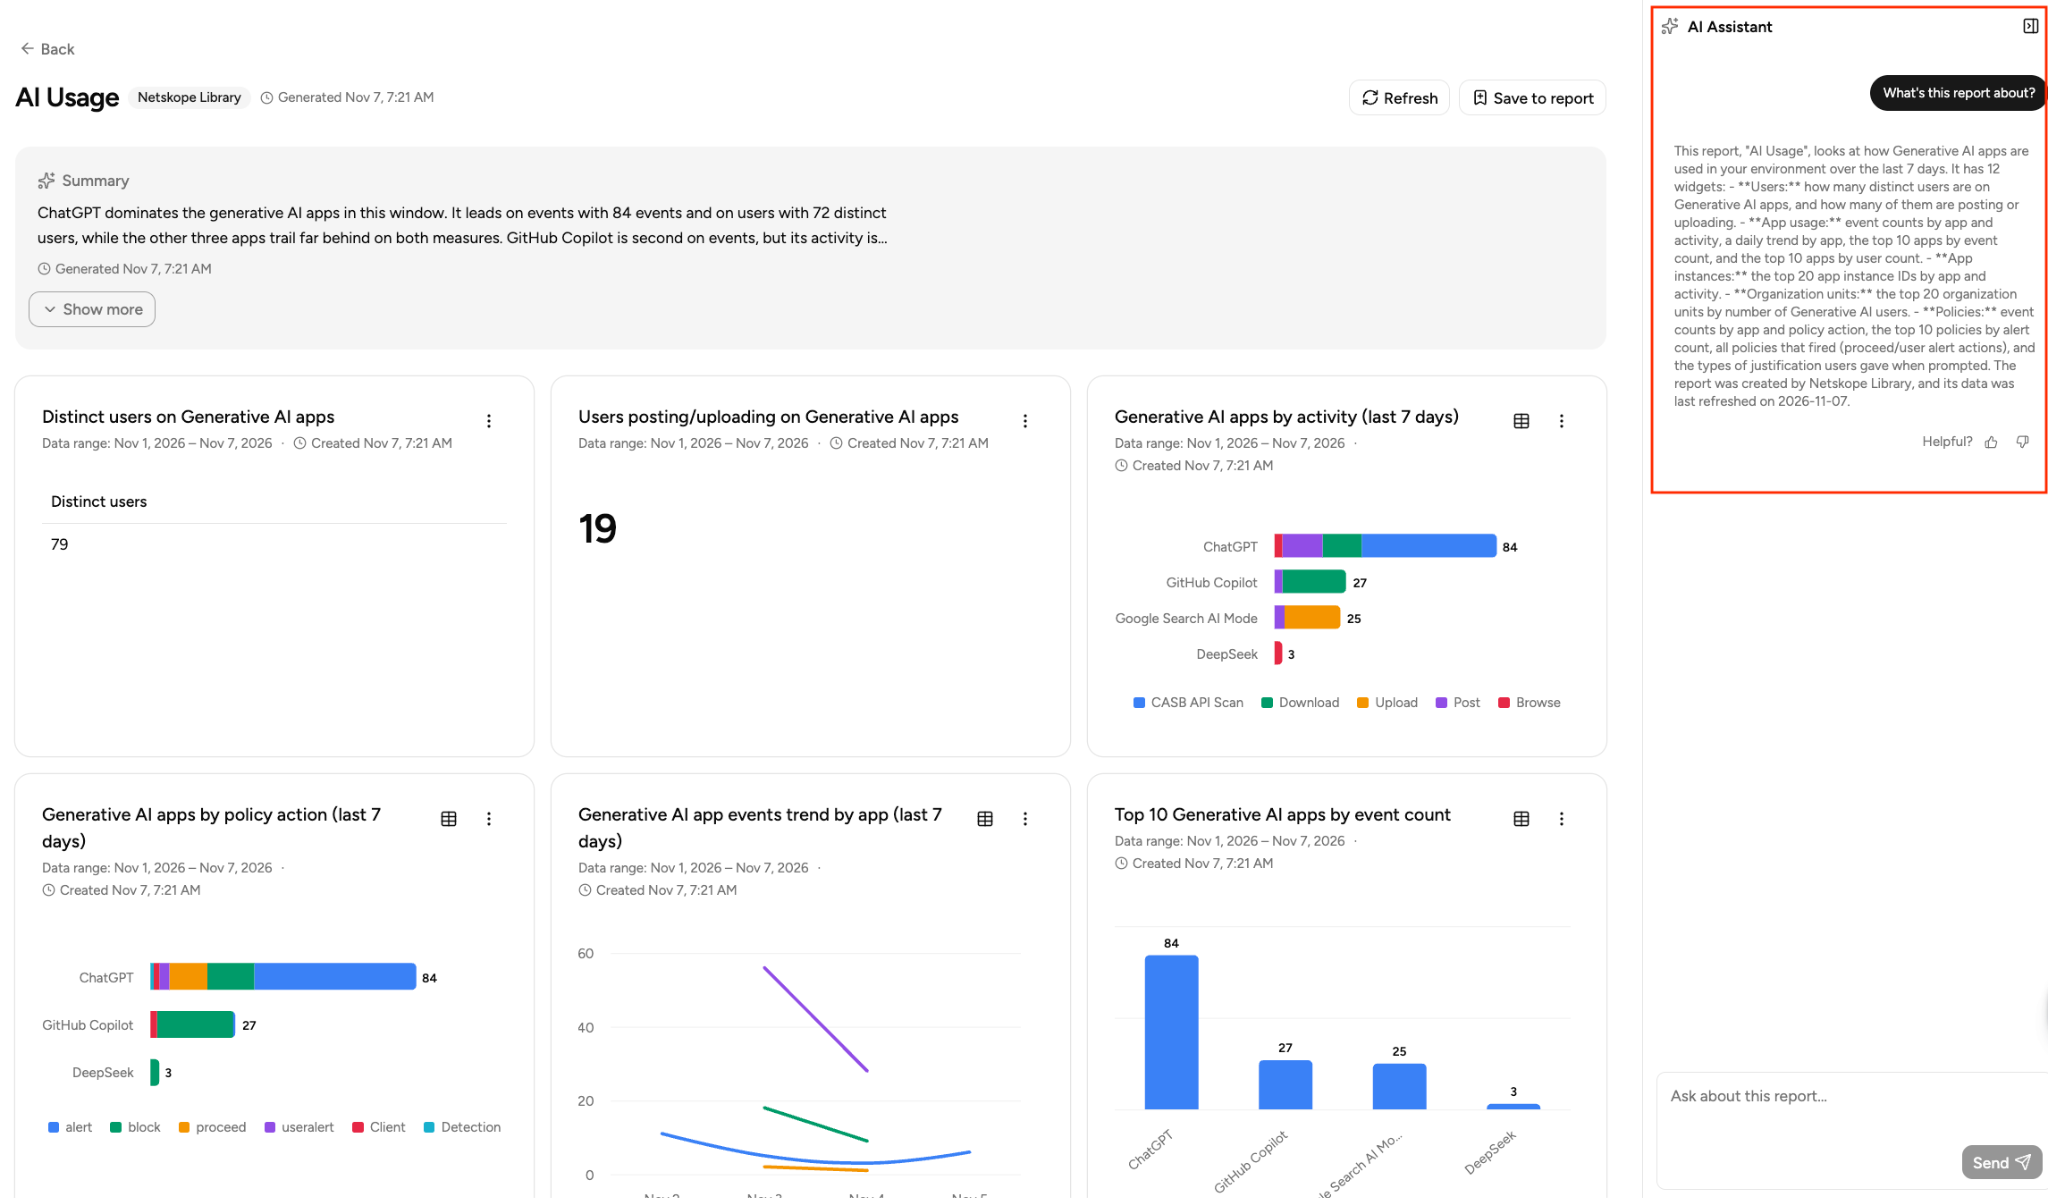
- On any predefined or custom reports, the AI assistant can summarize the report or help explain the data.
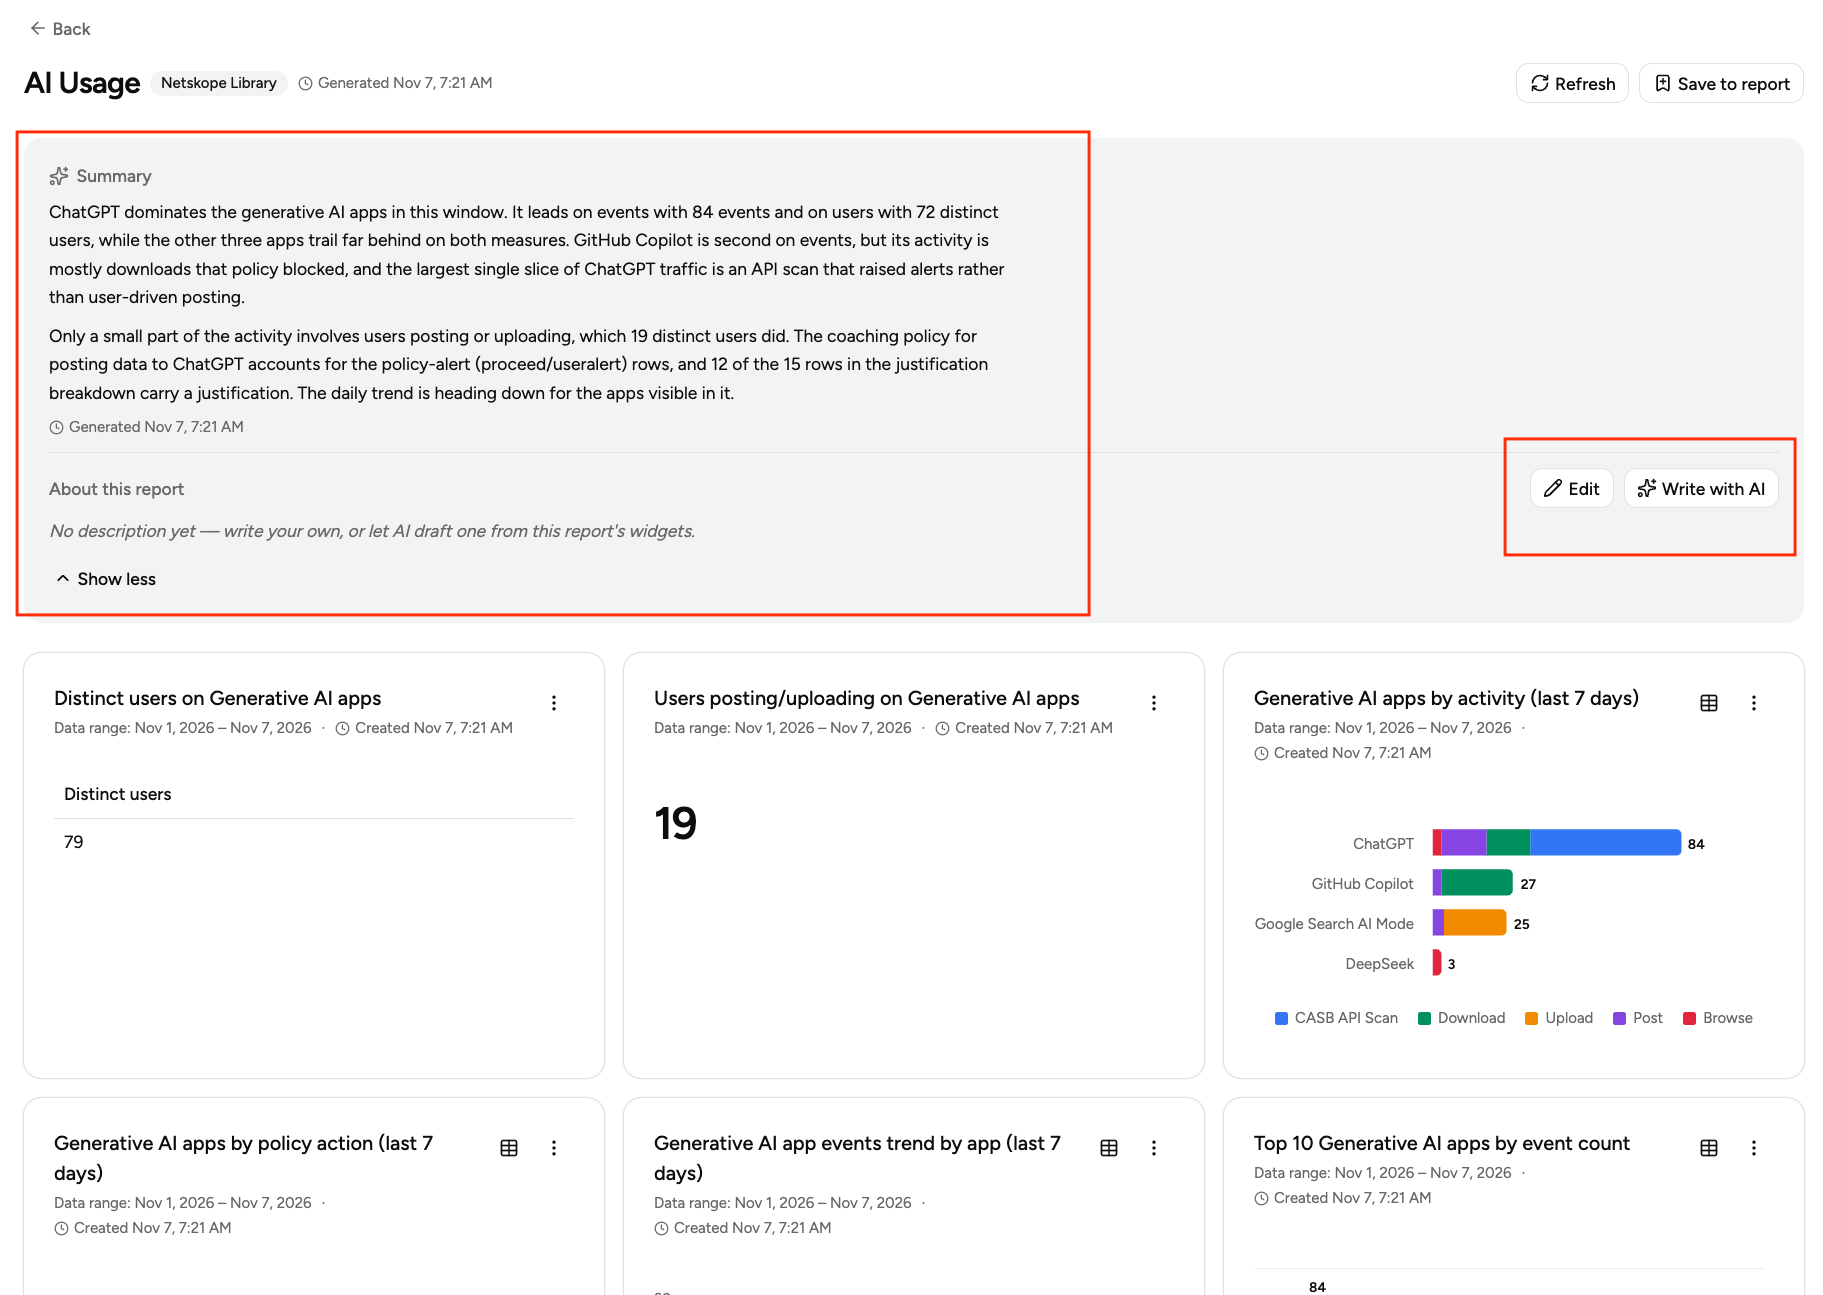
- You can generate an AI summary for the whole report, and “About this report” notes that describe each metric with more details.
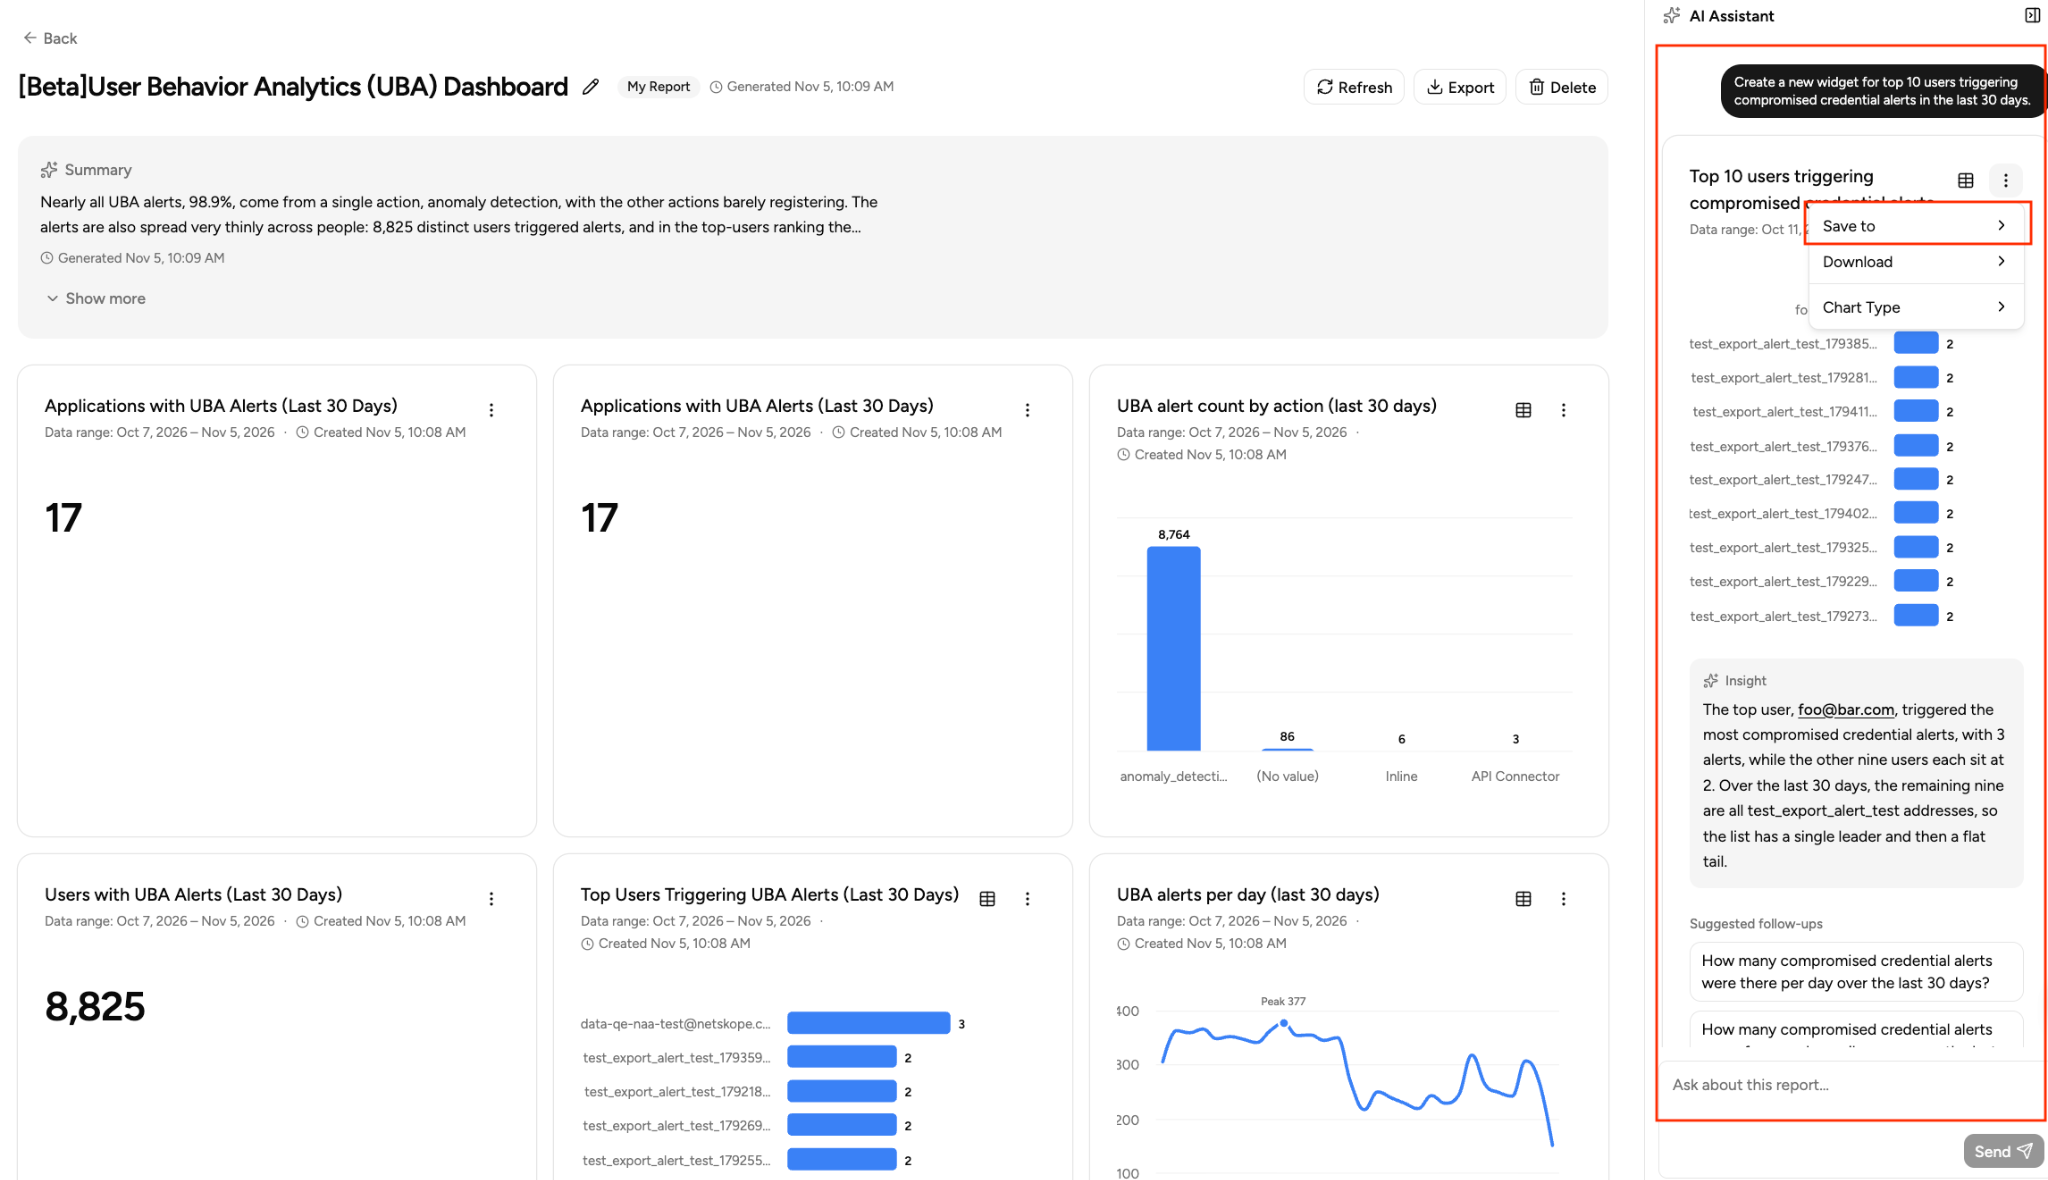
- To add a new widget to your custom report, simply enter the prompt, and the AI assistant will create the widget based on your requirements. The widget can then be added to your report, using the manual drop-down menu from the generated chart.
- Note that a predefined report can be edited only when it’s saved as a custom report through the “Save to report” button. Reports show data from when they were last loaded, click “Refresh” to view the latest data.
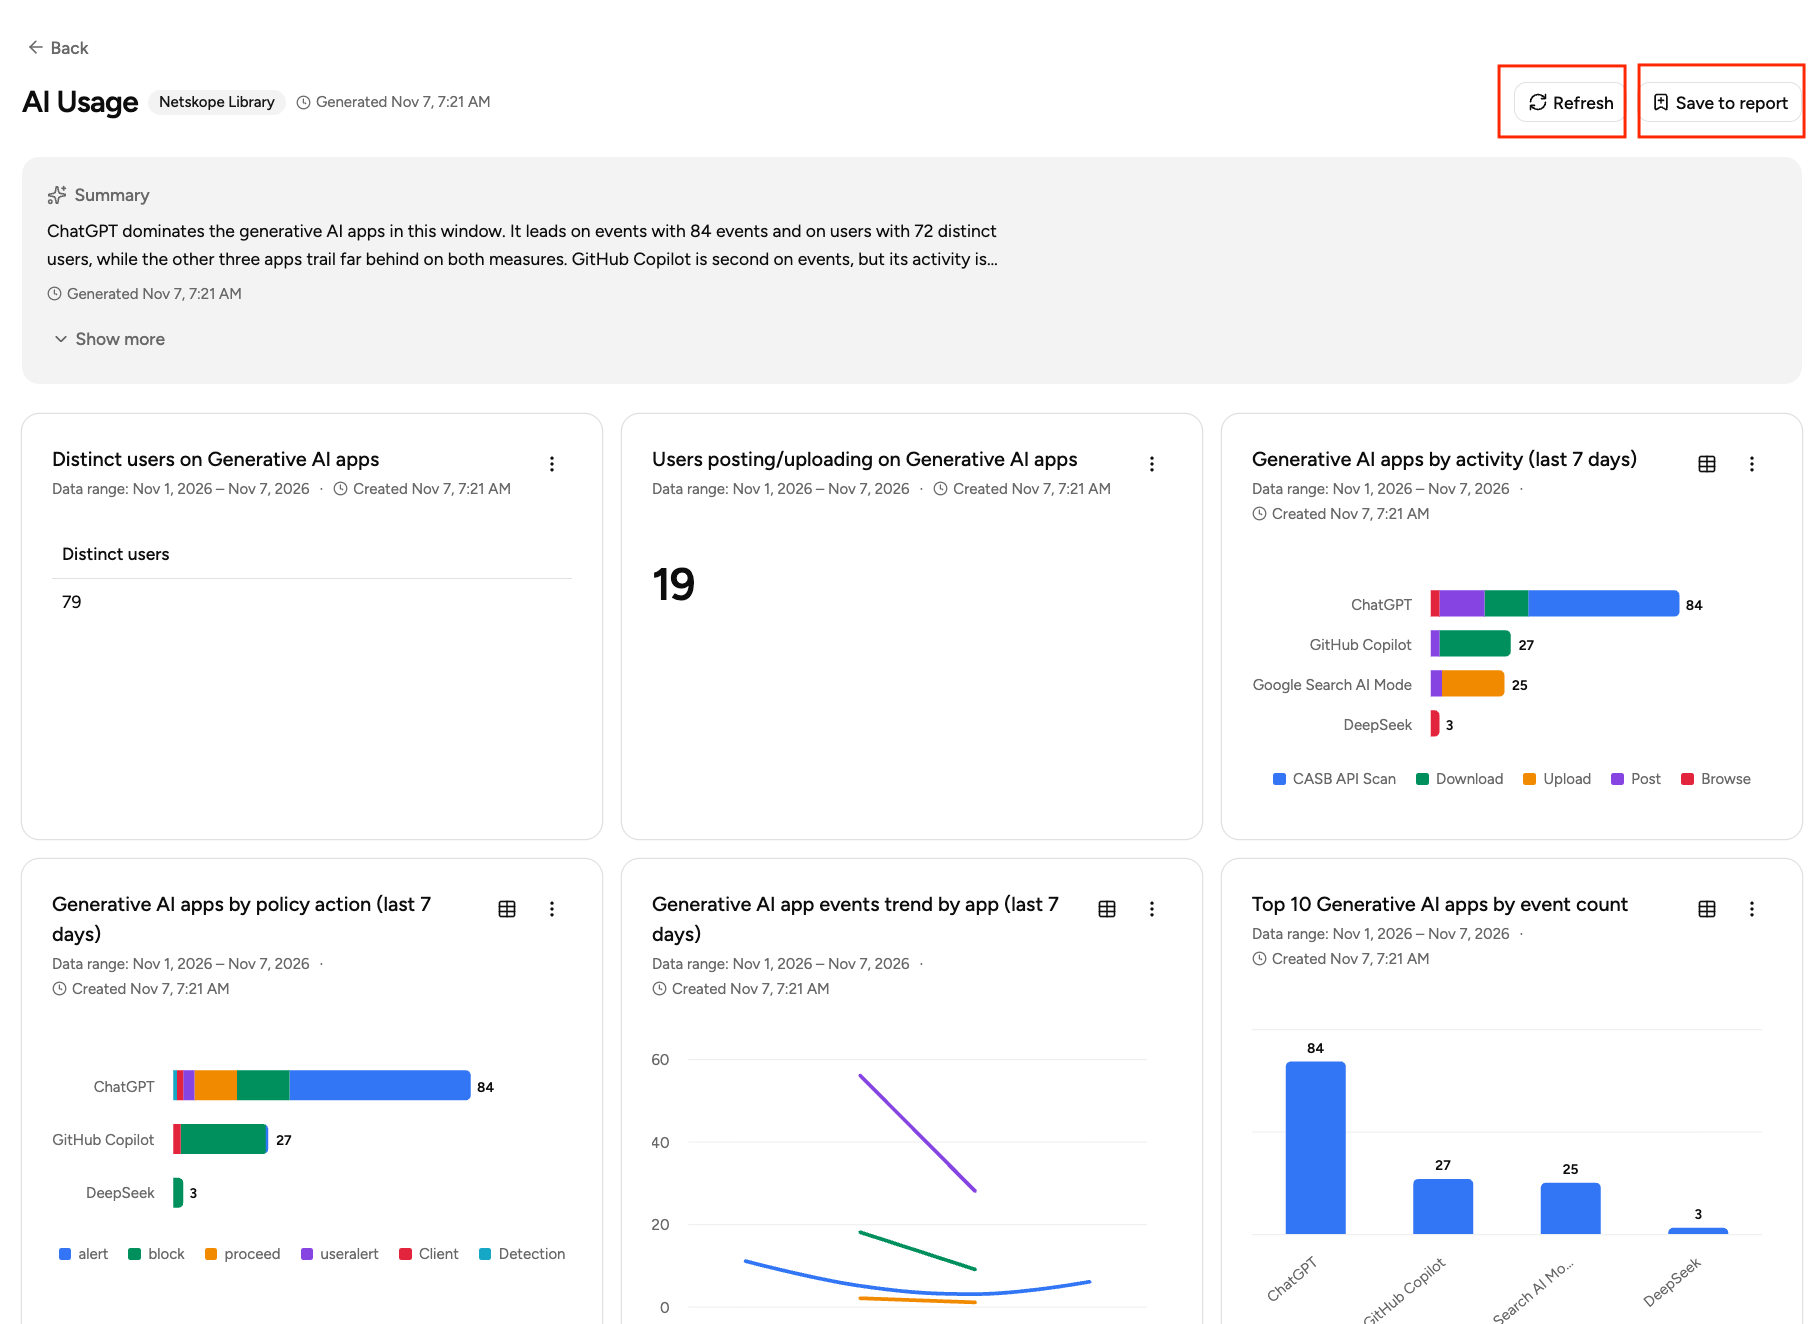
Report Library and Predefined Reports
Five predefined reports will be provided during the internal pilot & customer beta programs. New reports will be launched in future releases.
Report | Data used | What it covers |
|---|---|---|
DLP Policies | Alerts | DLP alert overview, DLP policies triggered, DLP policy actions taken, user info, and object details |
User Behavior Analytics | Alerts | UBA alert overview, user investigation, and UBA alert details by alert type |
Application Activity Summary | App Events and Alerts | Cloud app usage, user activities, and file transfer |
Threat Protection – Malware | Alerts | Malware detections |
Threat Protection – Malsites | Alerts | Malicious site detections |
Threat Protection – IPS | Alerts | Intrusion Prevention System results |
AI Usage | App Events and Alerts | AI app usage overview, user activities, policy violations, policy actions taken, and instance awareness |
Writing Better Prompts
When drafting prompts, follow these four best practices to get accurate answers faster.
Rule | Do | Avoid |
|---|---|---|
Define the metric | “Count of malware alerts” | “Show me malware” |
Include a time range | “… in the last 7 days” | No time range, which leaves the agent to guess |
Be specific about the metric, grouping and filters | “Top 10 users by DLP policy alerts, grouped by policy” | “Who is risky?” |
Use Netskope terminology | “Policy alerts”, “application events”, “malware alerts” | General or non-Netskope terms for the same thing |
Sample Prompts
AI usage
- How many users were accessing AI apps in the last 30 days?
- Now show me the user count by user group.
I also want to view the event count per user group.
- Now show me the user count by user group.
- Show me the weekly usage trend by AI apps in the last 30 days.
- Show me the top 10 AI apps by event count in the last 30 days and the user count of each app.
- Show me the application instances detected in each AI app in the last 30 days. I also need to understand the user count and event count.
- What policy actions were detected in each AI app in the last 30 days?
Application activity
- What is the total file size (both uploaded and downloaded) detected in cloud apps in the last 30 days?
- How many users were accessing cloud apps in the last 30 days?
- Show me a breakdown view of user count by app category.
Keep the top 10 categories only.
- Show me a breakdown view of user count by app category.
- Show me the top 20 user activities in cloud apps by total file size in the last 30 days. I also want to view the event count for each app.
- Show me the weekly trend of the total file size uploaded and downloaded in the last 30 days.
Cloud Threats & Alerts
- Show me the weekly trend of alert count by alert types in the last 30 days.
- How many malware blocks were detected in the last 30 days?
- Who are the top 10 users with malware blocks detected?
Add policy names detected to the widget.
- Who are the top 10 users with malware blocks detected?
- Show me the daily trend of inline malware blocks in the last 30 days.
- Show me the top 10 cloud malware sources in the last 30 days.
- How many malicious sites were blocked in the last 30 days?
- Show me the top 10 malicious site categories detected in the last 30 days.
- Show me the top 10 users visiting malicious sites in the last 30 days.
DLP
- How many DLP policy violations have been detected this month? Also show me the percentage change compared to the previous month.
- I need a clear breakdown view of all DLP policy actions taken in the last 30 days and the alert count for each of them.
- Show me the top DLP rules triggered in the last 30 days.
- I need to understand the severity of these rules.
What are the user count and app count for each rule triggered?
- I need to understand the severity of these rules.
- Show me the daily trend of DLP alert count by policy names in the last 30 days.
Feedback and Support
Please rate every AI response if possible. Your feedback will help us enhance the product.
Thumbs up: select it when the answer is what you expected.
Thumbs down: select it when something is wrong or unclear, then choose a reason or write your own:
- Wrong numbers
- Wrong time range
- Wrong chart types
- Not what I asked
- Too generic
- Other, using the free-text box
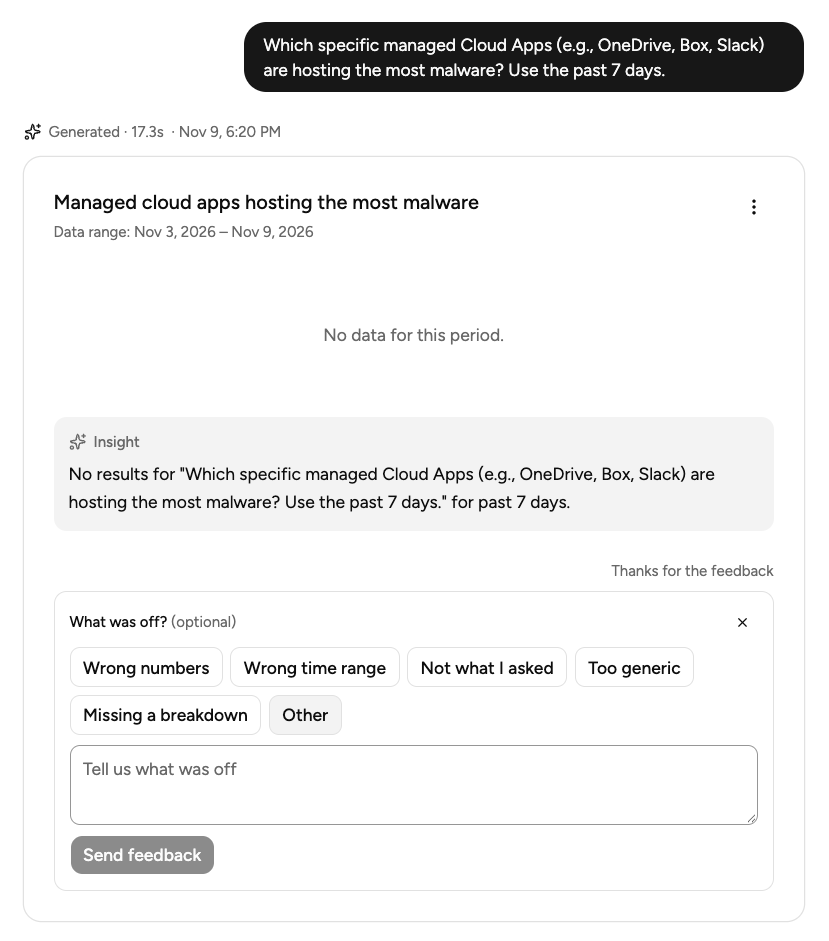
Netskope product management and engineering review this feedback to find out whether the data was wrong or the logic needs work, and use it to improve the quality of the agent’s answers.
Data Considerations and Reminders
The product is limited in data, features, and access during the beta program.
Area | What to expect in the beta |
|---|---|
Data types | Application Events and Alerts only. Prompts about other data may return incomplete or no results. |
Event-level data | Whether the agent can return detailed event-level data depends on the question. |
Data retention | Up-to 30 days of data can be queried. |
Chart types | Line, area, bar (vertical and horizontal), pie, donut, single metric, and table. |
AI assistant | The AI assistant can add new widgets, summarize the report, and explain results. It cannot edit widgets, resize widgets, or move widgets. |
Widget actions | You can manually change the chart type of a widget, but cannot manually resize widgets, move widgets, or edit data fields included in the widgets. |
Access control | Tenant Admin role is required to access the product. Tenant Admins have full access (interacting with the AI chatbot, creating new widgets/reports, editing existing reports, & refreshing report data) and can grant product access to non-admin users with two different options:
|
Data refresh | Reports show data from the last load. Click the “Refresh” button for the latest data. |
Deleting reports | Deleted reports can’t be restored. |
Session history | Session history is supported, but with some limitations during the internal pilot & customer beta:
|
FAQs
Who can use the beta?
Users with the Tenant Admin role. Tenant Admins have full access (interacting with the AI chatbot, creating new widgets/reports, editing existing reports, & refreshing report data) and can grant product access to non-admin users with two different options:
- View (Read-Only): Users can only view existing reports, and cannot edit existing reports, refresh existing reports, create new reports, or interact with the AI chatbot.
- Manage: Full access (same as Tenant Admin)
What data can I ask about?
Application Events and Alerts from the last 90 days. Questions about other data, such as transaction, endpoint or DLP incident events, may return no results.
Why did I get no results, or not what I expected?
Check that your question is about alerts or application events, includes a time range within 90 days, and names the metric you want. See “Writing Better Prompts” above. If it still looks wrong, select thumbs down and tell us why.
Can I save or export what the agent builds?
Yes. Save a visual to a new or existing report, or download the results.
How long does a session stay open, and how many are saved?
A session stays open for 24 hours after your latest question. After that it is locked, and you can start a new session to continue. The Recent section holds your newest 10 sessions. You can’t rename, delete or pin sessions.
Is there a limit on how many questions I can ask?
No. There is no limit on the number of questions you can ask per day in the beta. Usage limits will be introduced later, and this documentation will be updated if they are.
When should I start a new session?
Start a new session when you switch topics, for example from malware to application usage. Keeping topics separate makes results easier to find and track.
Why does my report show old data?
Reports show data from when they were last loaded. Click the “Refresh” button to update them.
Can I get back a report I deleted?
No. Deleted reports can’t be restored, so check before you delete.
Is my data used to train AI models?
Your data is not used to train or retrain the underlying AI models. It is used to improve how the agent behaves, in two ways:
- Feedback that applies generally (for example, a question type the agent handles poorly): we remove personal information and use it to improve the agent’s instructions and configuration. This changes how the agent is set up, not the model itself.
- Feedback specific to you or your tenant (for example, your preferred chart types or terminology): this is saved as a personal “memory” scoped to your user or tenant, so the agent can apply your preferences in future sessions. It is not shared with other tenants.
Where do I report a problem or ask for help?
You can share your feedback through the in-product feedback system. If you have any questions or need any help, feel free to reach out to your Netskope account representatives.
Will the product behavior change?
Yes. Behavior and features may change as we learn from your feedback, we’ll provide periodic updates throughout the beta program via email.