There are two types of probes: Network probes and App probes.
Network Probes
Use Cases and Principles
A Network Probe test is a synthetic test that provides end-to-end and hop-by-hop network performance analysis. It can be triggered from NSClients and/or Netskope Enterprise Stations. It helps you easily diagnose any degraded end users and corporate sites connectivity to the Netskope POPs by discovering the whole network path between them and measuring hop-by-hop performances. You can identify network degradations at all infrastructure layers between your users/sites and the Netskope POPs, such as:
- Local end user connectivity
- Local corporate networks
- Connection to the local ISP
- Interconnection between consecutive ISPs, up to the Netskope POP
When being triggered from the Netskope Enterprise Stations, Network Probes can also target any custom destination (FQDN – Fully Qualifed Domain Name or IP address), while bypassing the Netskope NewEdge Cloud infrastructure.
Network Probe tests are based on the traceroute principle.
Network Probe tests can use either ICMP or UDP to perform the traceroute. The method used is configured at the site level.
The principle of UDP-based Network Probe test can be schematized as follows :

The Network Probe discovers the network path to a target by sending UDP segments with an incremental IP header TTL (Time To Live) field. So the first UDP segment is sent from the NSClient/Enterprise Station to the target with a TTL=1 value in the IP header. As this packet cannot be routed by the first router on the path, the router drops the packet and sends an ICMP error message “TTL exceeded in transit” back to the NSClient/Enterprise Station. The process continues with a TTL=2 IP header field to discover the second router. It goes on with incremental TTL field values up to the target. When the target is reached, this latter replies back with an ICMP error message “Destination unreachable – Port unreachable”, informing the NSClient/Enterprise Station that the used UDP port is closed.
At each hop, a minimum of 6 probing segments are being sent. In case the NSClient/Enterprise Station does not receive ICMP error messages back, it automatically increases the number of tests. Up to 12 tests per hop can be triggered. If the router is configured so that it drops packets without generating ICMP error messages, the router is still identified in the path visualization graph but no performance metrics can be computed.
Each UDP segment sent uses a different UDP server port (from 33.435 to 33.535). When the UDP segments reach the target, this latter should at least have one of the 6 different UDP ports closed (in most of the cases, the majority of UDP ports > 1.024 will be closed, if not all), so that it sends ICMP error messages “Destination unreachable – Port unreachable” back to the NSClient/Enterprise Station.
From all collected data, the NSClient/Enterprise Station computes network round trip times as well as packet loss for each hop.
Traffic Steering Requirements

In order to discover the underlay network path between a corporate site and the Netskope POP, the Network Probe tests traffic must not be steered through Netskope.
In order to achieve this, you must:
- Set the “Routing” paramater of the Enterprise Station to “Steered” mode.
Refer to the following section for more details. - Configure a policy-based routing rule in your corporate firewall so that the non-HTTPS traffic from the Enterprise Station IP address bypasses the secured tunnels.
Configure Network Probes
Network Probe for NSClients
To monitor NewEdge POPs connectivity performance from end users’ devices, navigate to the main “Network Probes” (1) configuration menu of the “Synthetic Probes”. The “Netskope Client” (2) tab is selected by default.
Click on “Edit” (3) to edit the Network Probe default configuration:

This configuration lets you configure the three main settings that will be applied to all NSClients by default:

The “Network Path and Device Health Collection” (2) is required to collect the following data from NSClients:
- Network path discovery between the NSClient and the NewEdge POPs (determined through GSLB service)
- Overlay network latency between the NSClient and the NewEdge POPs
- The device health information that will be shown in the “User Overview” dashboard (CPU consumption, memory consumption, Disk I/O, WiFi signal strength, …)
In addition to these metrics, CPU usage, Memory usage and Disk I/O metrics can be provided on a per-process basis. This level of granularity requires the activation of the “Process Information Collection” (3) option.
The probe interval dropdown list (4) lets you determine how often the network connectivity performance to the NewEdge POPs is being performed. Possible values are between 5 minutes and one hour, by 5-minute increments.
In case you do not want this default configuration to be applied to all NSClients, you can create custom Network Probes and apply them to specific users/groups/devices.
To do so, click on the “Create” button from the main Network Probe configuration view (1):


Give a name to this new Network Probe policy (2).
Select the “Process Information Collection” option (3) if you want to collect CPU usage, Memory usage and Disk I/O at the process level.
Select the NSClients from which to perform Network Probes (4).
You can select specific users, user groups, organization units, operating systems and/or device classification.
Select the probe interval (5). This interval will take precedence over the probe interval configured in the default setting.
Finally, specify the location of this new policy in the list of all Network Probes.
The order in the list is important as the first policy matching an NSClient will always take precedence over the others.
Once the configuration is done, the newly created Network Probe will appear in the list of Network Probes:

Network Probe for Enterprise Stations
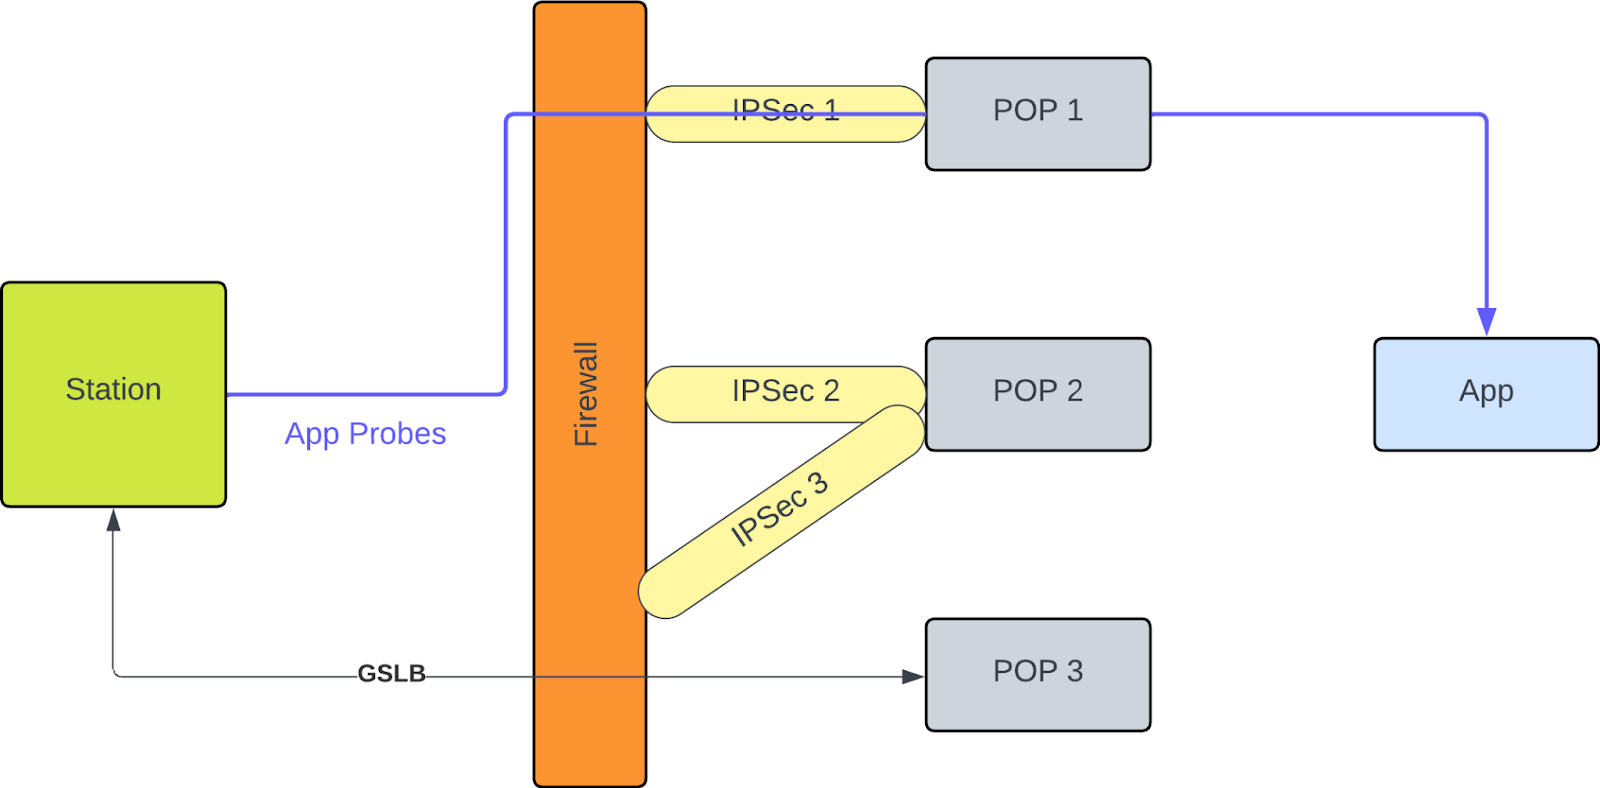
When assigning IPSec/GRE tunnels to a site, any Enterprise Station linked to the site will automatically trigger Network Probe tests to the top two POPs that are part of the IPSec/GRE tunnels configuration.
These top two POPs are determined based on the volume of data being sent through all active tunnels.
If the “Monitor NSClient connectivity” option is selected in the site configuration (please refer to the Sites section for more information), the Enterprise Station linked to the site will also mimic the NSClient behavior by targeting the Netskope POP which is determined by the GSLB service.
The GSLB service is being invoked for each Network Probe test, and the test is only performed to the best POP identified.
Network Probes in Steered Mode
In this scenario, the Enterprise Station routing mode is set to “Steered” mode. Please refer to the following section for more details.
Network Probes in Bypassed Mode
In this scenario, the Enterprise Station routing mode is set to “Bypassed” mode.
Refer to the following section for more details.
In this scenario, the Enterprise Station does no take into account the following site parameters:
- IPSec/GRE tunnels that are associated to the site
- The “NSClient connectivity” checkbox value
All Network Probe tests are bypassing The Netskope NewEdge Cloud and directly target the applications you select.
Navigate to “Settings → Synthtetic Probes → Network Probes” (1) and select the “Station” (2) tab:
Click on “Create” (3) to create a new Network Probe.

Select the application you want to monitor through Network Probes (4):

If you select a predefined application and if this is already monitored (through App Probes for example), then the three top domains already used for other synthetic tests are selected by default.
You can still modify this list if required.
If the predefined application is not part of any existing synthetic test, then you have to select the targets you want to be part of the Network Probe configuration.
When selecting a custom application, there is no target list to choose from as custom applications can be made up of a maximum of three targets. All of these targets will be tested through Network Probes.
Finally, select the Enterprise Station(s) you want to assign the Network Probe to (5-6):

One this is done, just click “Save” to confirm (7).
App Probes
Use Cases and Principles
An App Probe test is a synthetic test that provides application availability and performance monitoring.
It can be triggered from NSClients and/or Netskope Enterprise Stations and helps you easily identify any web service unavailability and performance issues by testing specific domains (for NSClients) and/or URLs (for Enterprise Stations) at application level.
This test is not limited to the web application performance itself, it also covers the whole infrastructure chain between the end user and the application, helping you to find the root cause of any performance degradation by providing performance telemetry that monitors:
- The network infrastructure and services between the end user and the Netskope POP
- The Netskope infrastructure itself
- The network infrastructure between the Netskope POP and the monitored application
- The servers that are delivering the application
When being triggered from the Netskope Enterprise Stations, App Probes can also target any custom destination (URL), while bypassing the Netskope NewEdge Cloud infrastructure.
Important
Local configurations (legacy proxy, EPOC, EPOT) are not supported.
To review best practices for App Probes, go here.
Traffic Steering Requirements
Enterprise Station in Steered Mode
The App Probe tests traffic must be sent through a secured tunnel in order to mimic typical real users behavior.
In order to achieve this, you must:
- Set the “Routing” paramater of the Enterprise Station to “Steered” mode.
Refer to the following section for more details. - Configure a policy-based routing rule in your corporate firewall so that the HTTPS traffic from the Enterprise Station IP address is steered through the secured tunnel.
Enterprise Station in Bypassed Mode
In order to perform App Probe tests directly to custom destinations and bypass the NewEdge Cloud infrastructure, you must:
- Set the “Routing” parameter of the Enterprise Station to “Bypassed” mode.
Refer to the following section for more details. - Configure a policy-based routing rule in your corporate firewall so that the HTTPS traffic from the Enterprise Station IP address bypasses the secured tunnels.
Configure App Probes
To monitor the reachability, availability, and performance of applications through synthetic testing, please do the following:
- Specify what you want to monitor.
This is done by selecting either a predefined application or a custom application from a dropdown list.
In case you want to select a custom application, this has to be created beforehand. Please refer to the Custom Applications section for more details.
- Define the location from which you want to monitor.
This step is done by creating App Probes, which can be applied to either NSClients or Enterprise Stations.
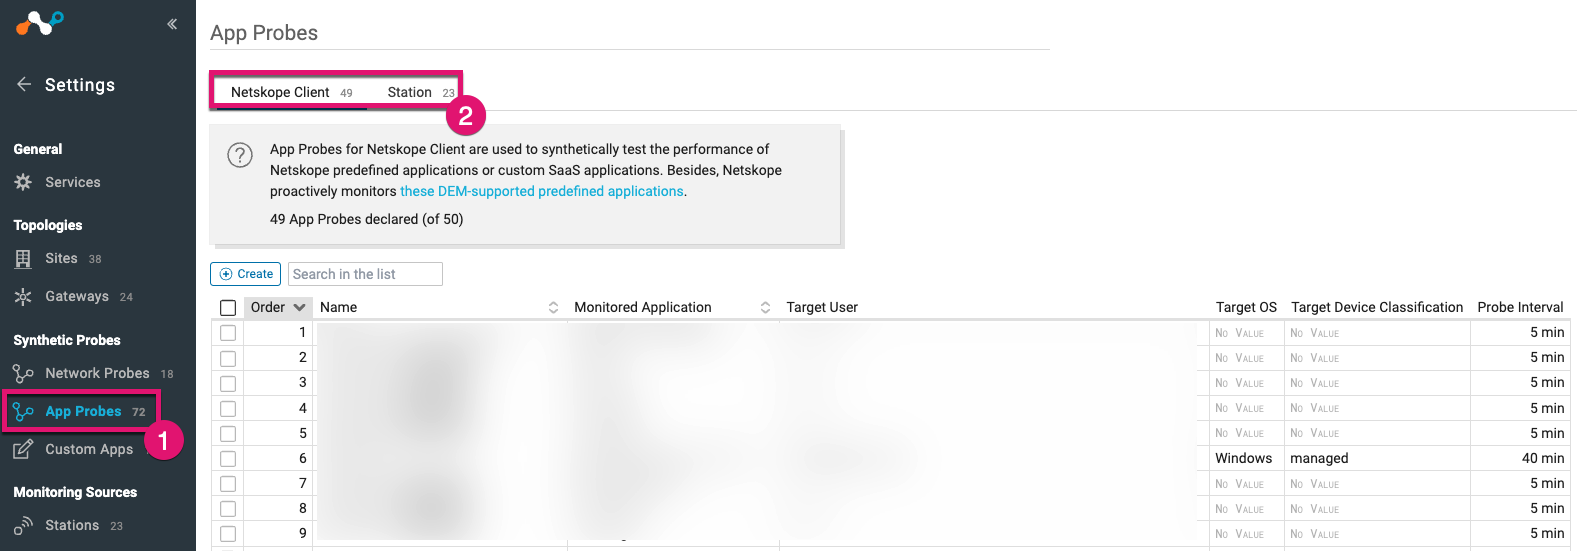
Navigate to the “App Probes” configuration menu (1) and select either the “Netskope Client” or “Station” tab depending on the source from which you want to trigger the execution of App Probes tests (2).
App Probes for NSClients
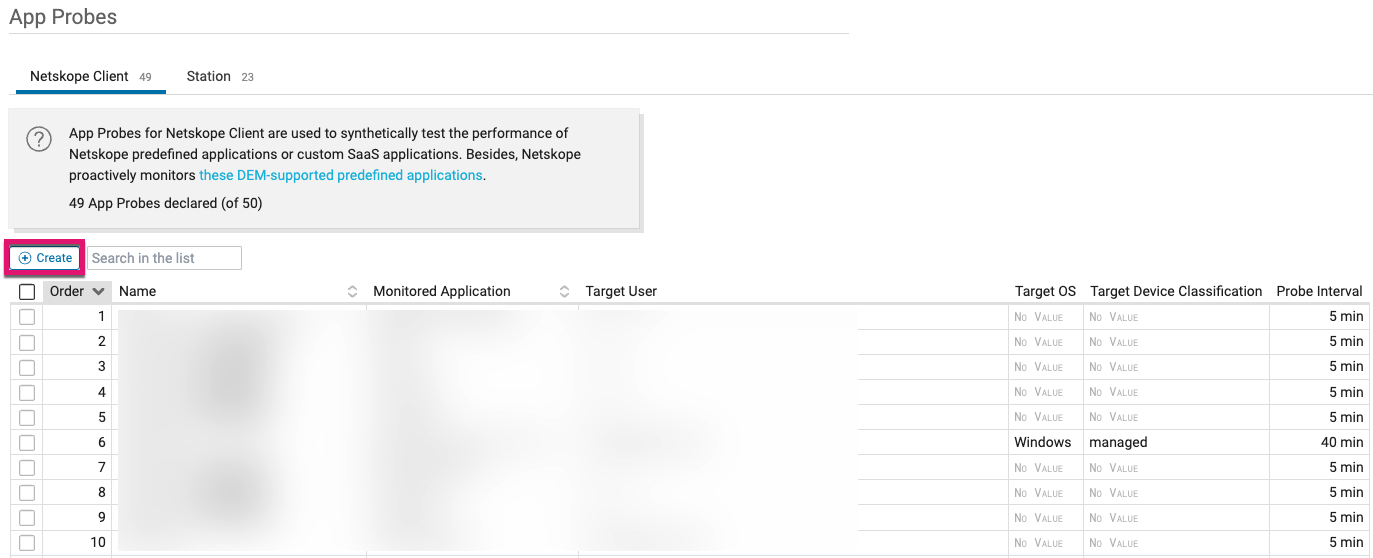
- Select the “Netskope Client” tab at the top of the App Probes view to see the list of existing App Probes.
- You can easily find an existing App Probe by searching by name in the search box.
- Selecting an App Probe allows you to edit, deactivate, or delete it.
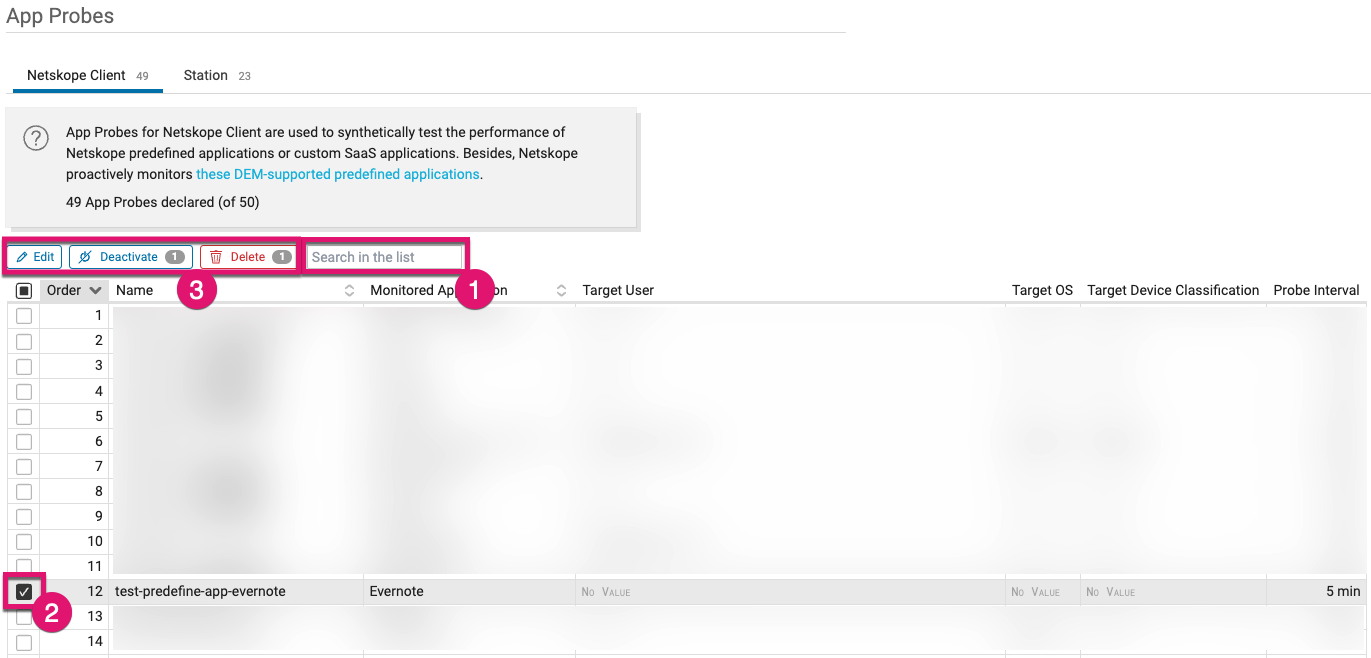
When there is no App Probe selected, click on “Create” to create a new App Probe:
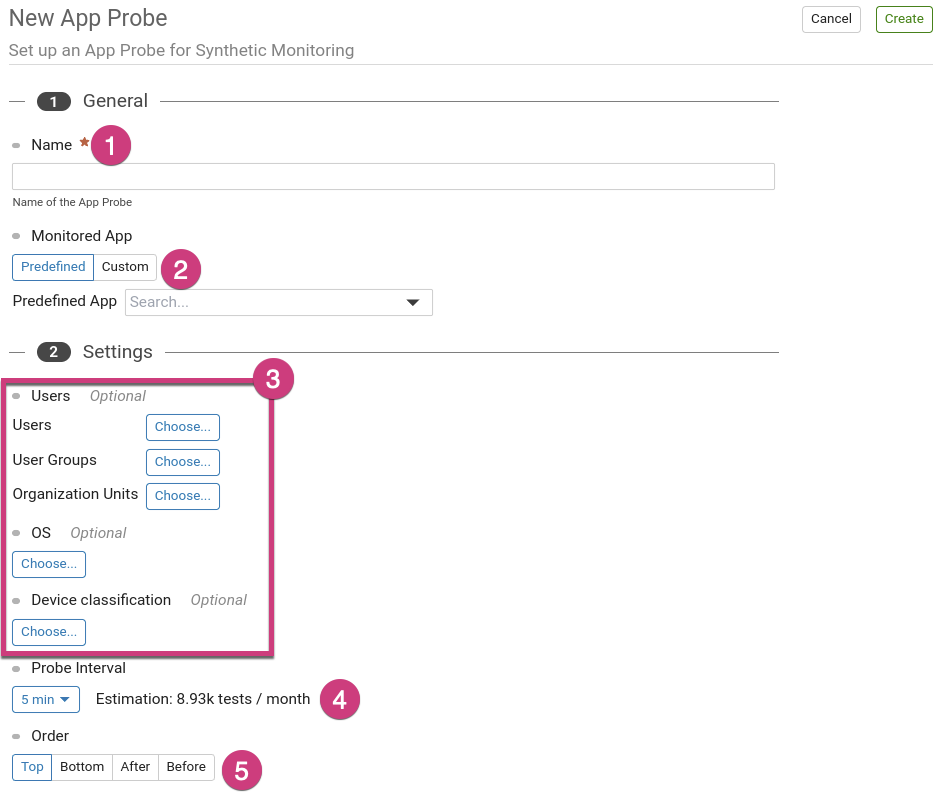
From this view, you can configure:
- The name of the App Probe policy to apply to selected NSClients (1)
- The application you want to monitor.
This can be a predefined or a custom application (2) - The scope of monitoring, that is the NSClients from which you want to monitor the application (3). You can include in the scope:
- Users and/or
- Specific users
- Users groups
- Organization units
- Operating systems and/or
- Windows
- MacOS
- Devices based on their classification
- Managed
- Unmanaged
- Unconfigured
- Users and/or
- The interval between consecutive tests (4).
This can be between 5 minutes and 1 hour, by 5 minutes increments. The default value is 5 minutes. - The order in which to enforce the App Probe policy (5).
This specifies the order in which App Probe policies are being enforced.
App Probes for Enterprise Stations
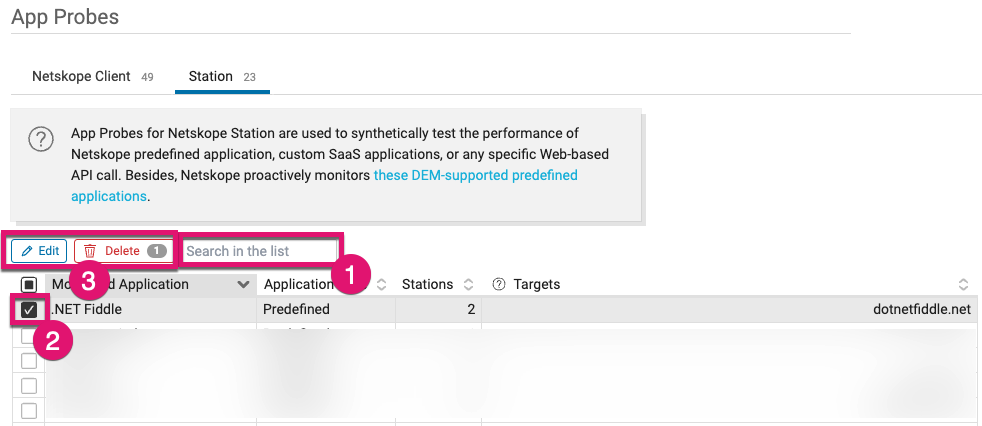
Select the “Station” tab at the top of the App Probes view to see the list of existing App Probes.
You can easily find an existing App Probe by searching by name in the search box (1).
Selecting an App Probe (2) allows you to edit or delete it (3).
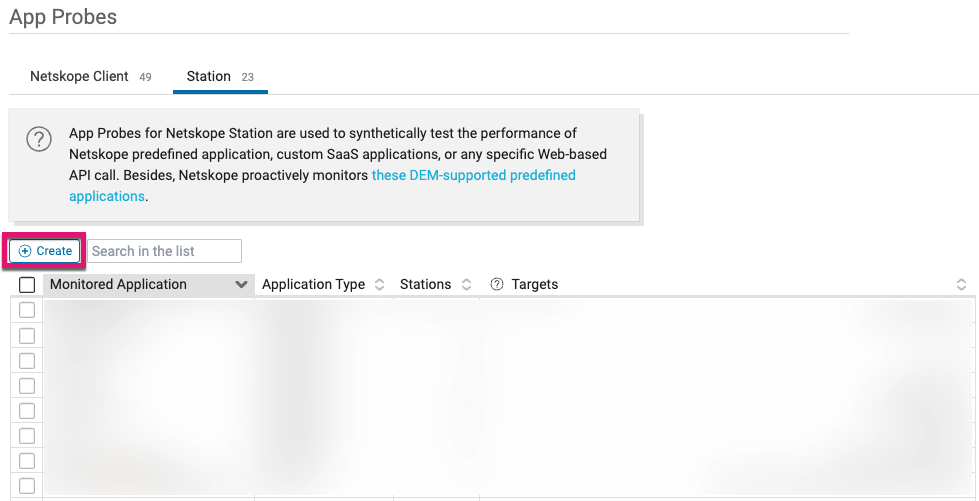
When there is no App Probe selected, click on “Create” to create a new App Probe:
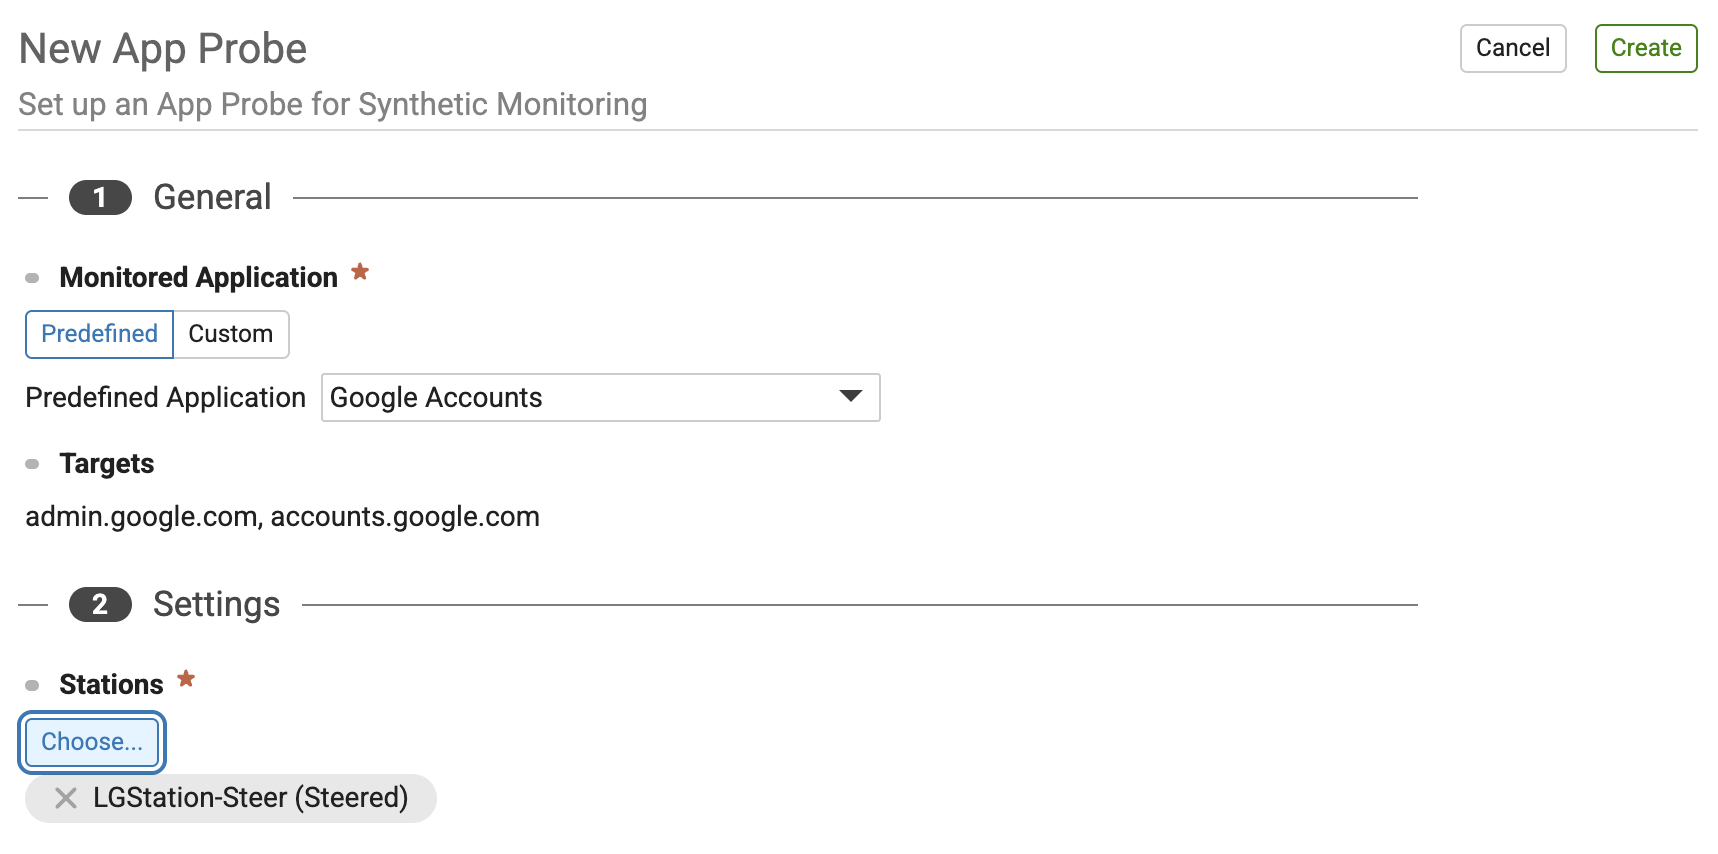
Predefined Applications
In case of a predefined application, just select the application from the dropdown list. The top three domains that will be tested is then automatically selected for you:

Now that the monitoring targets have been defined, click on the Choose button to select one or multiple Enterprise Stations to assign this monitored application to:
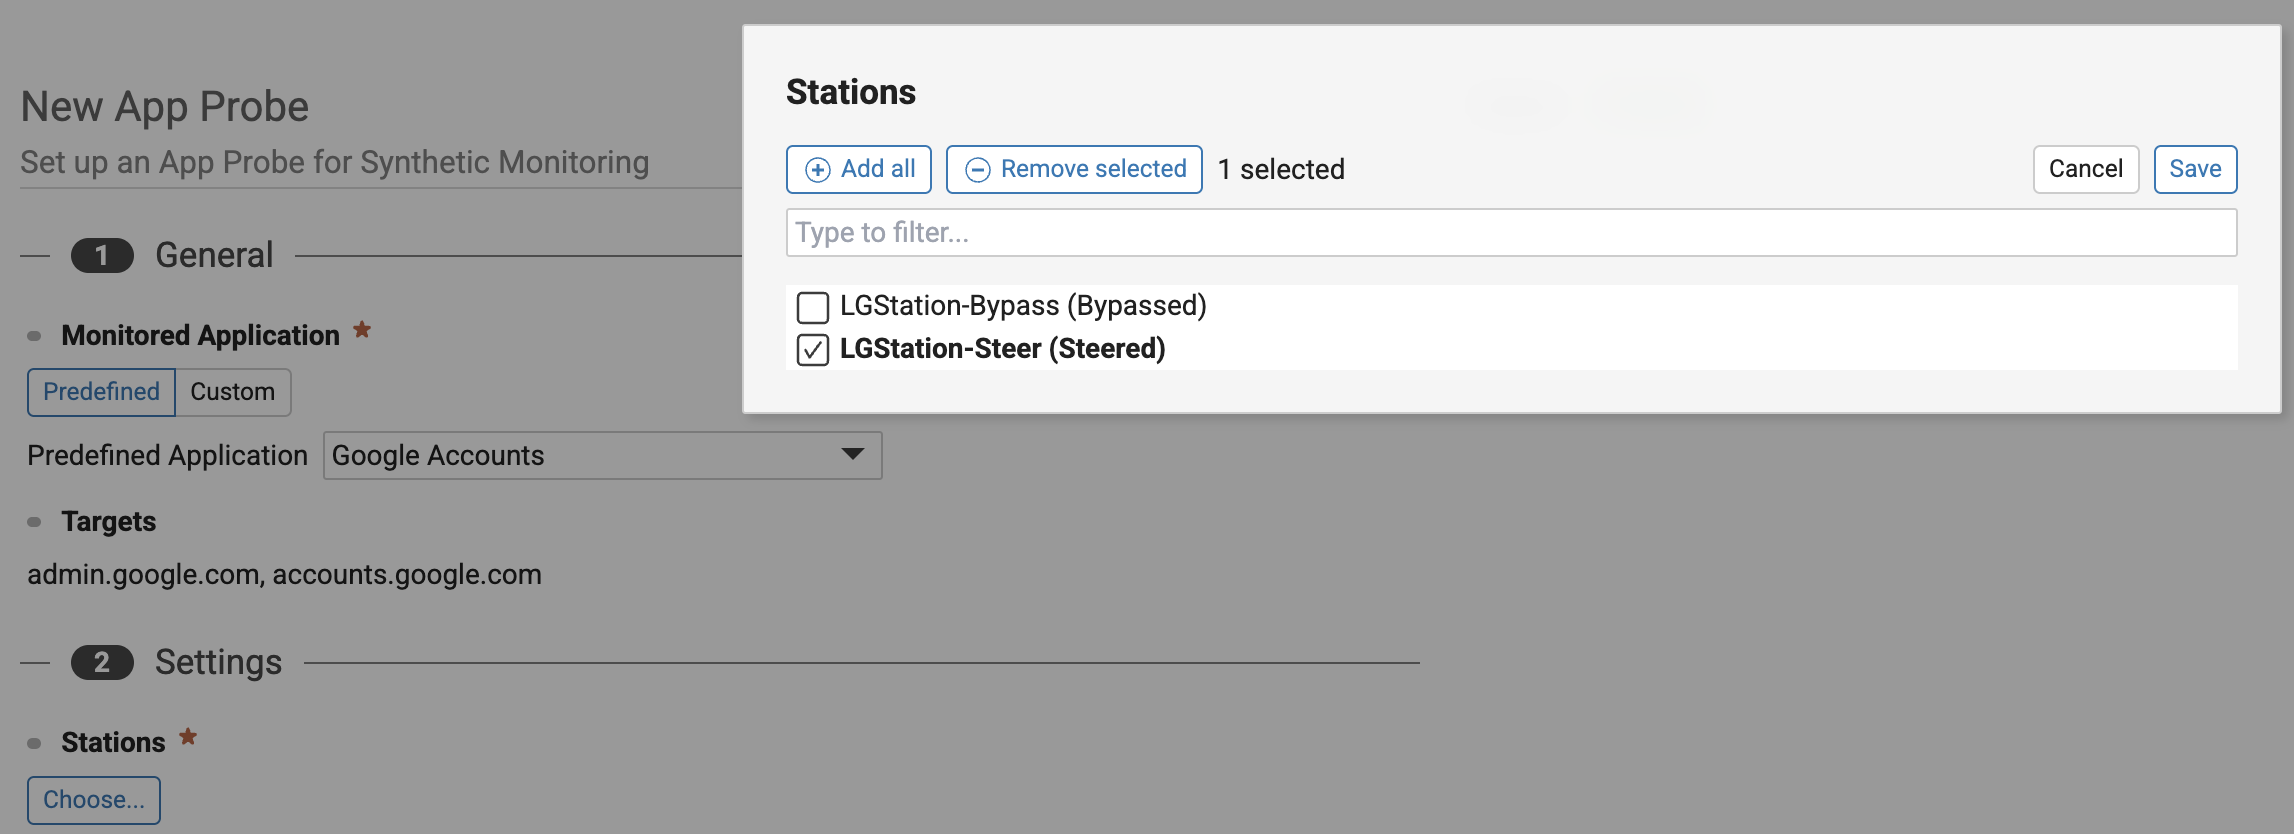
Click Create to finalize the App Probe creation process:
The configuration process is complete.

Custom Applications
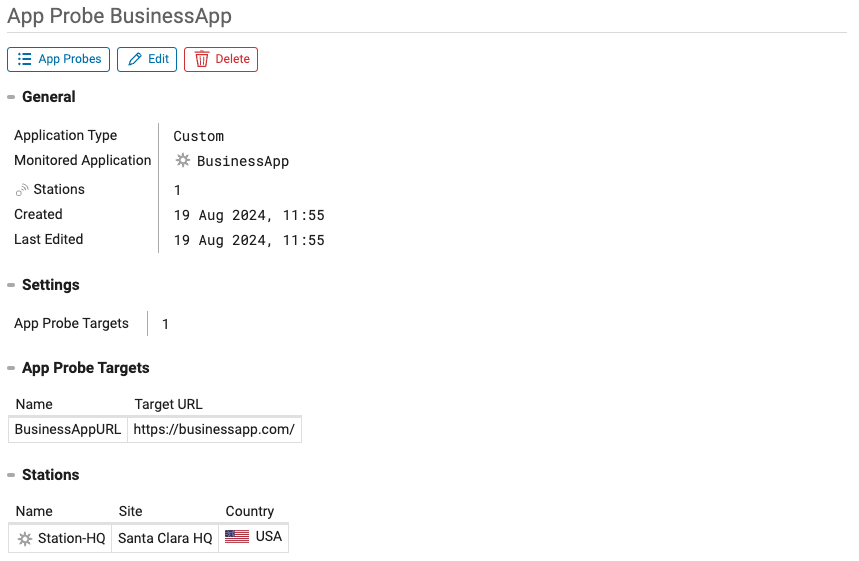
Applying an App Probe to an Enterprise Station for a custom application is straightforward.
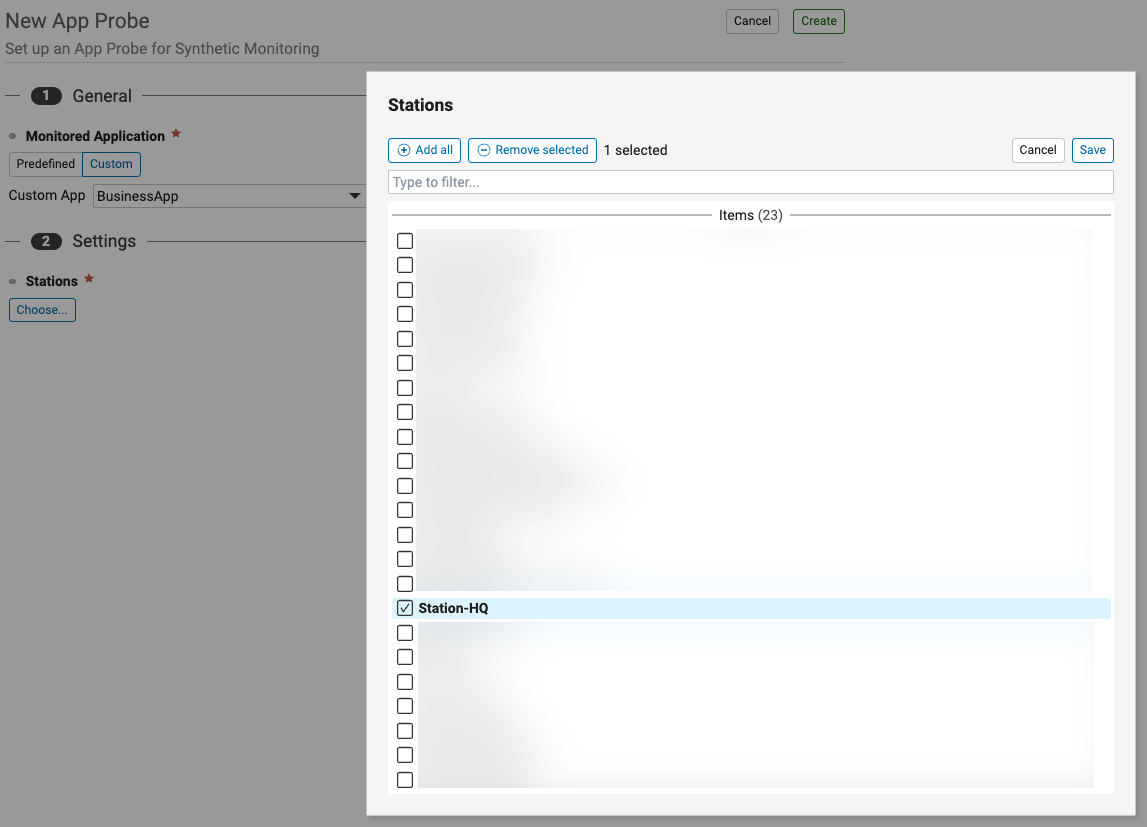
Select the “Custom” tab from the “Monitored Application” section (1), select the desired application from the dropdown list (2) and apply it to one or multiple Enterprise Stations (3):
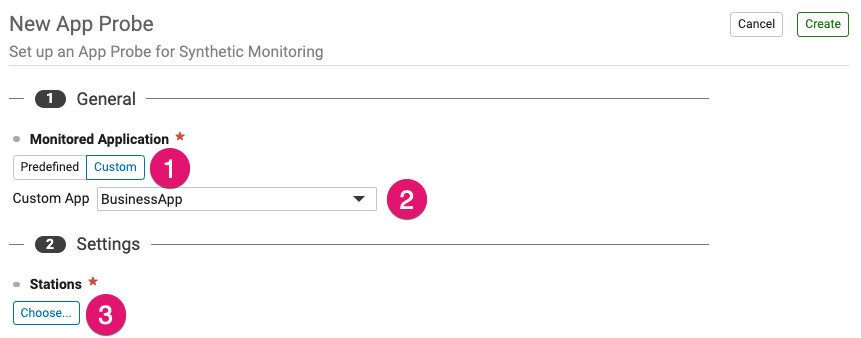
Click Create to finalize the App Probe creation:
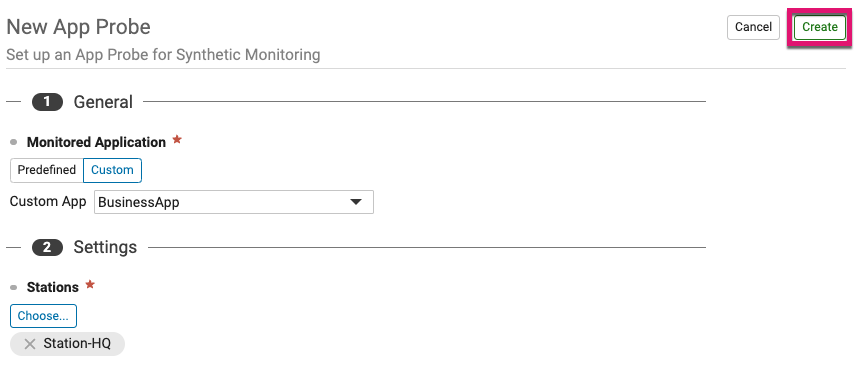
The configuration process is complete.