

The Utilization page provides a unified view of agent capacity use, with projections and alerts to balance availability and cost, so teams can plan ahead of demand instead of reacting to a shortage and size the next commitment with data.
This is helpful for example, a security agent runs low on capacity in the exact period it’s needed most, with no advance warning. As the number of agents in use grows, the blind spot grows with them. If each agent is bought, tracked, and capped separately, there’s no single view of where capacity is used, where it sits idle, or where it’s about to run out. Capacity is wasted on agents that don’t need it, teams that do need it go without, and at renewal there is no usage data to size the next year’s commitment.
The Utilization page shows usage by agent, tracks the trend, and gets ahead of it with early alerts, so availability and cost stay balanced across every team. A unified dashboard shows utilization and capacity credit usage by agent, with a projected run-out and alerts near the limit. Teams plan the next purchase on their current usage and projections available through the Marketplace Utilization page.
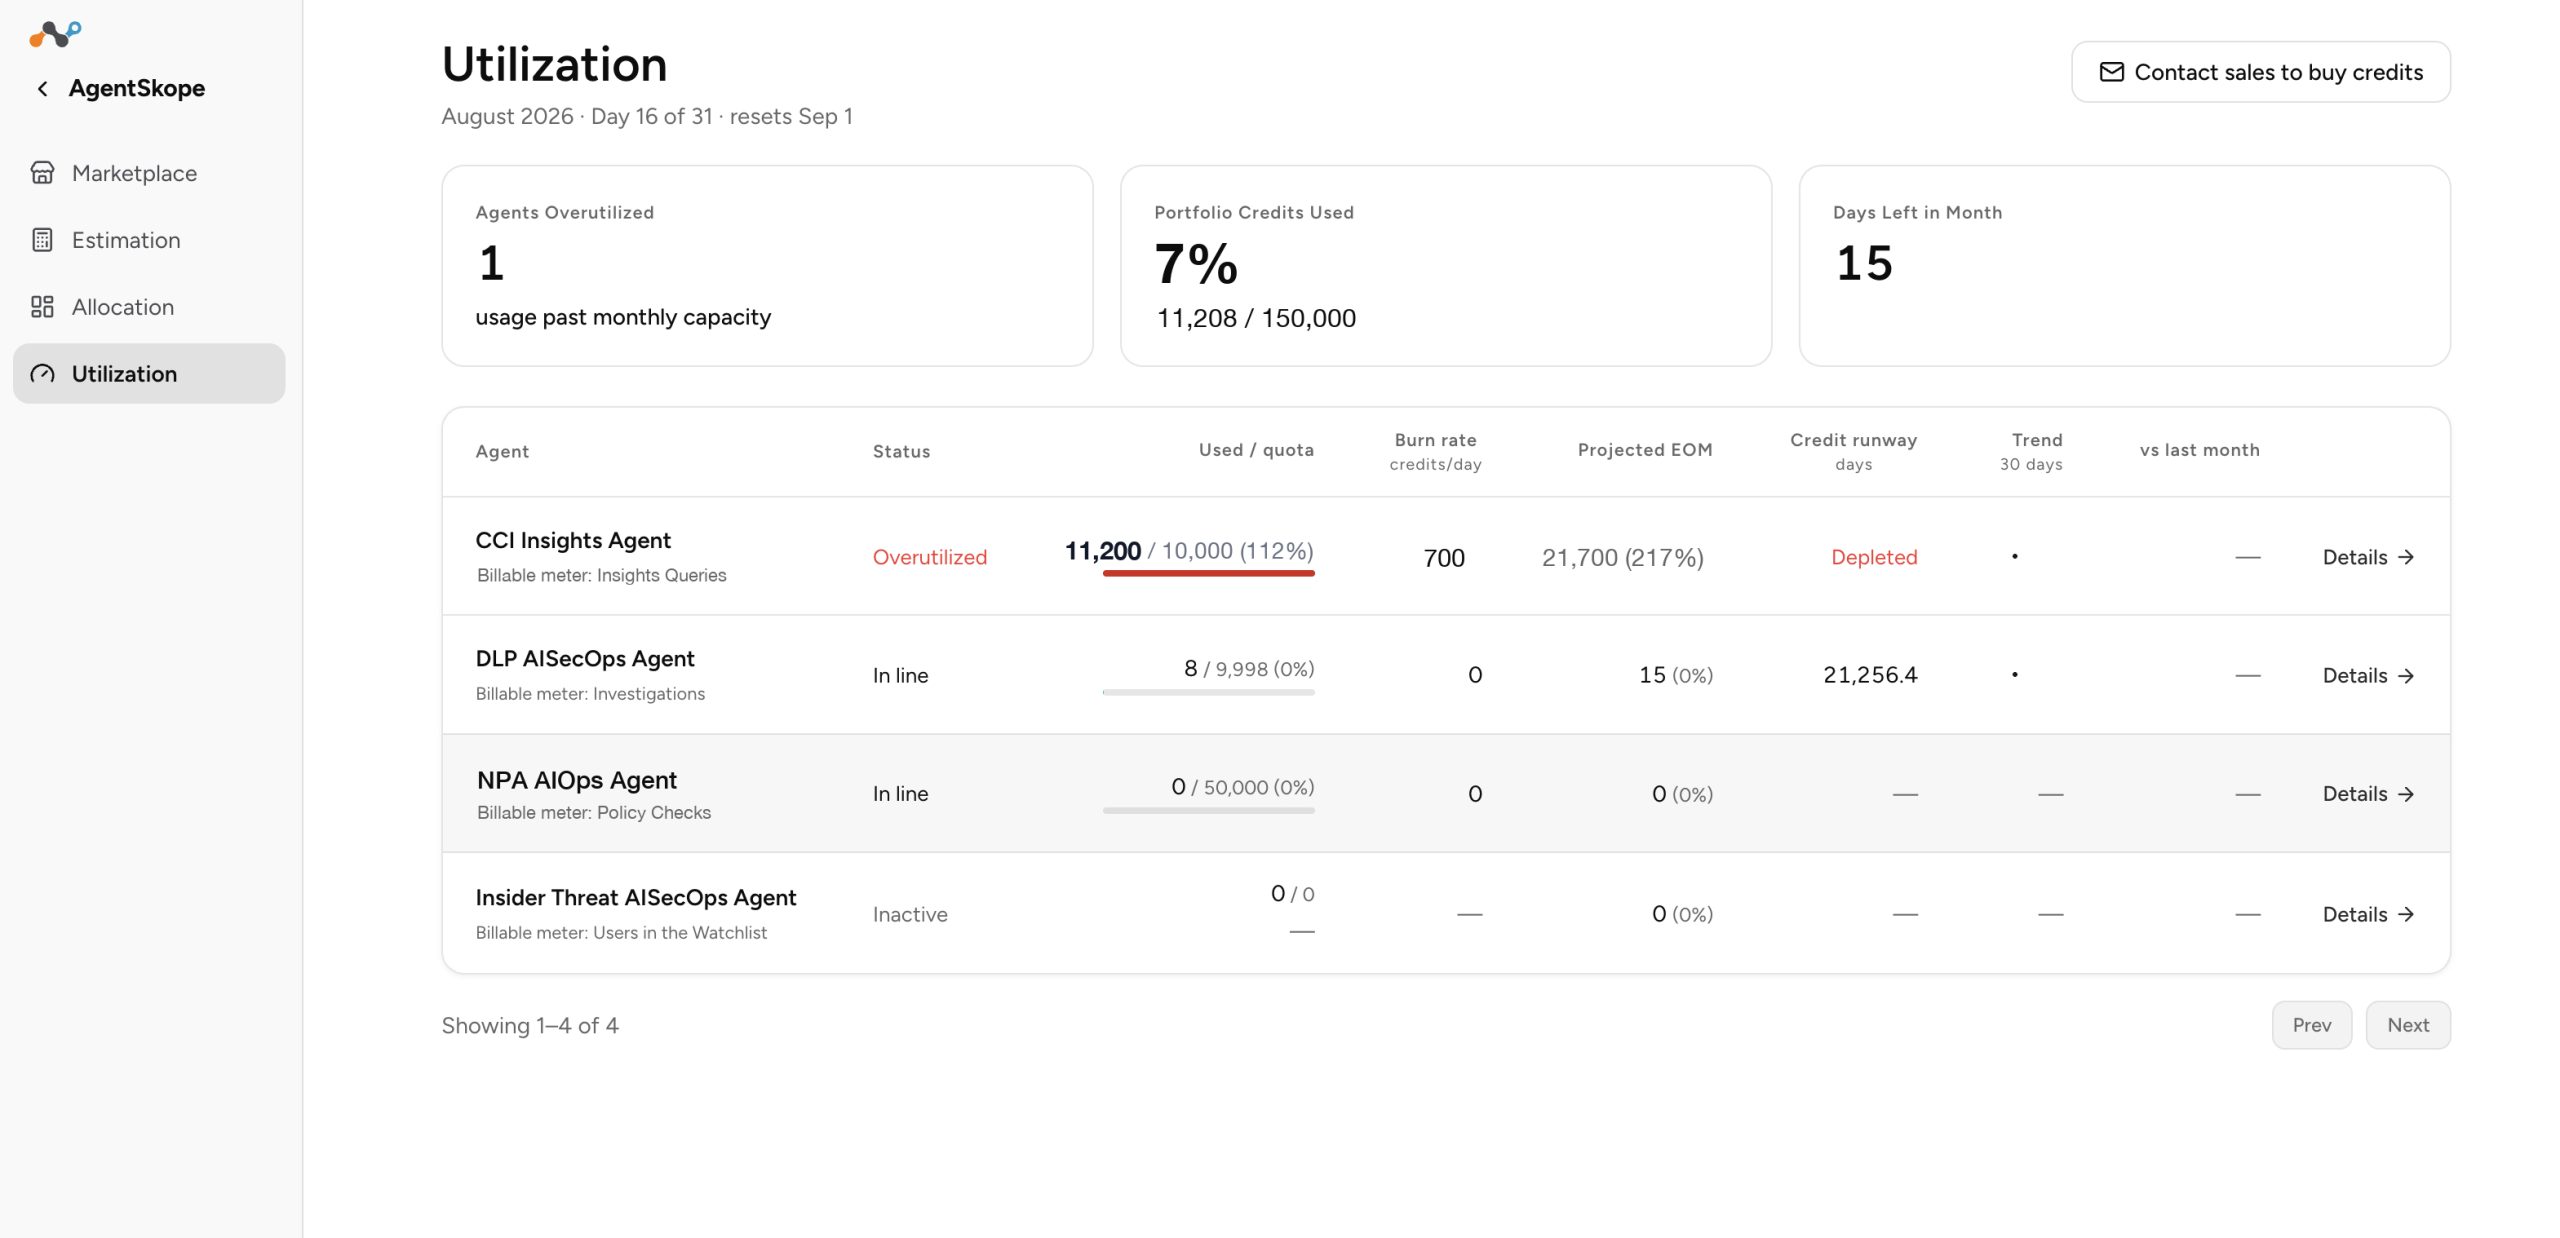
Click Details to view AI Agent specific metrics.
What you see. The page opens with the state of the month: the share of your portfolio capacity used so far, and how many days are left before the reset.
Below that, one row per agent:
-
Status — whether the agent is running within its allocation, or is not currently active.
-
Used against allocation (shown as Used / quota) — capacity consumed this month against what the agent holds, with a bar for the proportion
The remaining columns project how the agent finishes the month at its current rate, and how its workload compares with recent months.
What to do about it. If an agent is going to run short and another is running quiet, move capacity between them in Allocation. If the whole portfolio is tight, talk to your Netskope account team about adding capacity.
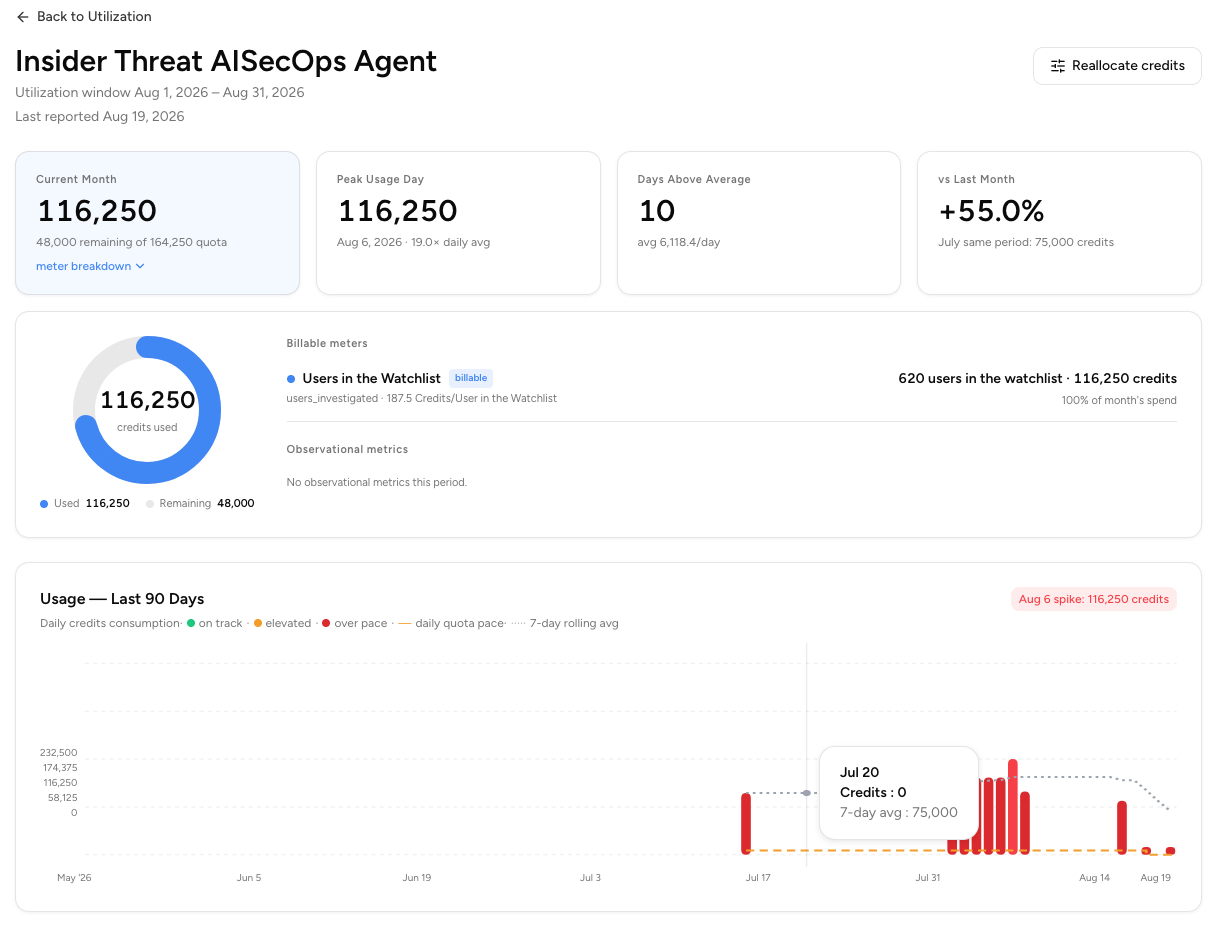
This is a drill down view of a single agent’s utilization.
Click the tiles to change the details for the following metrics:
-
Current Month
-
Peak Usage Day
-
Days Above Average
-
vs Last Month (days above average versus the same period the previous month)
To learn more: For current agent details, credit specifics for your tenant, and anything not covered here, see the Netskope support knowledge base or contact Netskope Support. For questions about capacity you hold or want to add, contact your Netskope account team.