

SaaS Security Posture Management continuously monitors SaaS apps to identify the app’s posture. The Apps page provides the detailed summary of SaaS apps. To view the Apps page, log in to your Netskope tenant and navigate to API-enabled Protection > Security Posture SaaS > Apps.

Apps Metrics
In the metrics section, you will see the tenant level details about:

-
Apps Configured – shows the number of apps configured to the total number of apps supported by SSPM. You can hover over the numbers to see the names of the apps.
-
Posture Score – shows the lowest posture score amongst all the SaaS apps. The weekly trend chart shows the posture score for the last 7 days, with date and time when you hover over it. You can see the posture score change between today and last week’s posture score. Refer to the SPM Posture Score document for more information.
-
Failed Findings – shows the number of critical failed findings to the total number of failed findings. You can click on these numbers to see the details on the Findings page. Hover over the weekly trend chart to see the findings for the last 7 days. You can see the failed findings percentage change between today and last week’s data.
-
3rd Party Apps – shows the number of 3rd Party Apps with critical risk score to number of 3rd Party Apps. You can click on these numbers to see the details on the 3rd Party Apps page. Hover over the weekly trend chart to see the total number of 3rd Party Apps for the last 7 days. You can see the 3rd Party Apps percentage change between today and last week’s data.
-
Users – shows the number of privileged users to the total number of SaaS app users. You can click on the number of users to see the list on the Inventory page. Hover over the weekly trend chart to see the users for the last 7 days. You can see the average users change between today and last week’s data.
Recent Changes
The Recent Changes section provides visibility into posture activity across configured SaaS applications for the selected time period. It highlights changes to the Posture Score, Findings, and 3rd Party Apps to help identify posture improvements, regressions, and newly detected risks. At the top, you also see the number of active and deleted instances for the selected time period.

Posture Score Trend – The Posture Score graph displays the trend of the overall posture score across configured applications during the selected time range. Hover over the graph to view the names of the three apps with the lowest posture scores.
- Each data point represents the posture score at a specific time.
- Use the trend to identify posture improvements or regressions.
App Posture – The App Posture summary shows the number of applications whose posture changed during the selected period. The change in the posture score is determined by comparing the first and last samples within the selected time range. Intermediate samples are not considered.
- Improved – Applications whose posture score increased.
- Regressed – Applications whose posture score decreased.
- No Change – Applications with no change in posture score.
Findings – The Findings section shows posture evaluations that are newly failed and newly passed.
- New Failures – Posture evaluations that recently failed.
- New Passes – Posture evaluations that were evaluated and passed.
3rd Party Apps – The 3rd Party Apps section highlights changes related to integrations connected to your SaaS applications.
- Newly Discovered – New 3rd Party Apps detected.
- Increase in Risk – 3rd Party Apps whose risk level increased.
- Risk Accepted & Approved – 3rd Party Apps that were approved or whose risk was accepted.
Time Range – Use the time range selector to change the period for which posture changes are displayed.
Apps Card
The Apps page shows the SaaS app cards with the detailed summary. You can filter the apps using the application name and posture score. You can also sort the sequence of apps based on posture score low to high and high to low.

-
The half donut scale shows the posture score and posture level of the app calculated from the failed findings. Click on the posture score to navigate to the single app page. The posture score and posture levels are defined as follows:
-
Excellent – SaaS apps with a posture score ranging from 90 to 100.
-
High – SaaS apps with a posture score ranging from 75 to 89.
-
Medium – SaaS apps with a posture score ranging from 60 to 74.
-
Low – SaaS apps with a posture score ranging from 50 to 59.
-
Poor – SaaS apps with a posture score ranging from 0 to 49.
-
Unknown – SaaS apps with not defined posture score.
-
-
Shows the weekly score trend chart for the past 7 days and posture score change between today and last week’s posture score with increase and decrease status.
-
Shows the number of instances. Click on the number of instances to navigate to a single app page.
-
Shows the number of failed findings. Hover over the number to see the detailed summary as per severity. Click to see the details in the Findings page.
-
Shows the number of 3rd Party Apps. Hover over the number to see the app summary as per risk levels. Click to see the details in the 3rd Party Apps page. See Risk Levels document to know more.
-
Shows the number of users that can access the app. Click to see the resources in the Inventory page.
Instance Scan
Every instance is scanned periodically for instance resources to check the connection between SSPM and the SaaS Apps. If the connection is disrupted, you will see a “Data may be Stale or Missing” warning message at the top of individual SaaS app cards. Click on the individual app cards to see the particular disconnected instance.
View SaaS App Instances
Click on the individual app card to navigate to the single app page.
- The Recent Changes section shows the trend of the application posture score over the selected time period and highlights changes in Instance Posture, Findings, and 3rd Party Apps, helping you quickly identify posture improvements, regressions, newly detected risks, and remediation activity.
- The Failed Findings section provides a severity-based breakdown of posture findings that are currently failing for the selected application.
- The 3rd Party Apps section displays information about connected 3rd Party Apps and highlights newly discovered integrations or risk changes, if available.
- The Users section shows the number of users associated with the selected application instance with furthur breakdown of the number of privileged and non-privileged user.

You can also see the individual cards of instances of that app.

-
Shows the posture score and posture level of the instance.
-
Shows the weekly score trend chart for the past 7 days and posture score change between today and last week’s posture score with increase and decrease status.
-
Shows the number of failed findings. Hover over the number to see the detailed summary as per severity. Click to see the details in the Findings page.
-
Shows the number of 3rd Party Apps. Hover over the number to see the app summary as per risk levels. Click to see the details in the 3rd Party Apps page. See Risk Levels document to know more.
-
Shows the number of users that can access the app. Click to see the resources in the Inventory page.
-
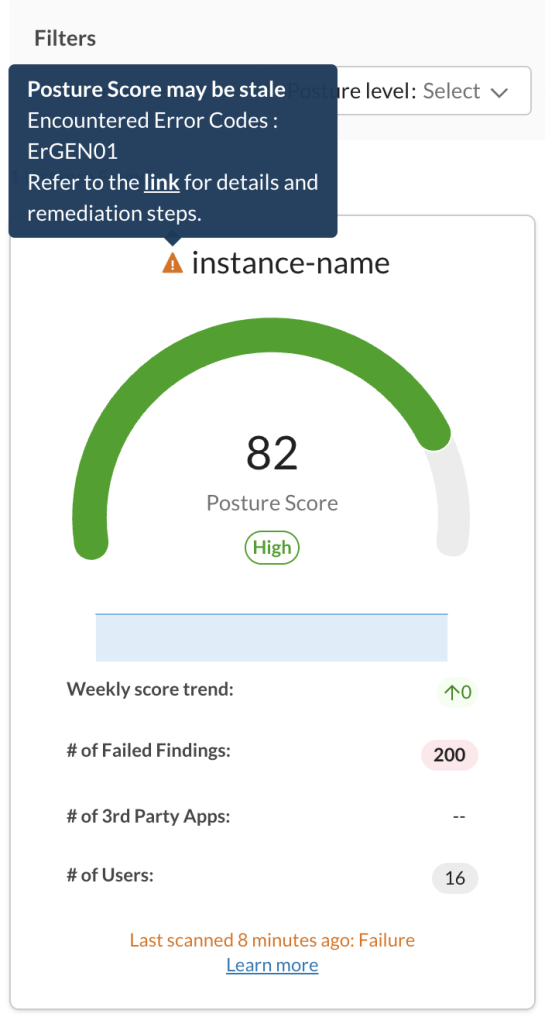
At the bottom of the card, you can view the Last Scan time, which shows when the most recent scan was performed along with its status. See Last Scan Time to learn the different Scan Status definitions.
Last Scan Time
The last scan indicates the most recent scan performed on an instance, regardless of its outcome (success, failure, or partial). Following are the different instance Scan Status definitions:
-
Success: All resource types in the instance were successfully scanned in the last attempt.
-
Initial scan in progress: The initial listing of all resource types is still ongoing.
-
Failure: All resource types in the instance failed to scan on the last attempt.
-
Partial Failure: Some resource types failed, while others succeeded in the most recent scan.
-
Initial scan in progress – Failures Detected: The scan is underway, but one or more listed resource types have already encountered failures.
-
Not Applicable: Applicable only for custom instances onboarded via BYOA feature.
-
Never: The scan has not been performed on the instance. This can occur for one of the following reasons:
-
Although the instance is onboarded, the required scan permissions or prerequisites have not yet been granted.
-
No scan has been executed since the feature release, and no data is available to determine the last scan status. In this case, no errors are reported.
Monitoring and visibility into app status were introduced in the R133 (Dec 2025) release. Re-grant app access to trigger the first scan.
 If the last scan time exceeds twice the configured Security Scan Interval, check the instance state and regrant the instance if it is in an error state.
If a failure is reported, review the warning message displayed at the top of the card and note the error code. Refer to SSPM Connectivity to SaaS App for details about the error code and the remediation steps to resolve it.
-

Click on the instance card to see the instance summary and recent changes.
