

Data Loss
Data Loss (disponible sous Views dans la navigation de gauche) fournit des analyses générées par l’IA, en continu rafraîchisses, de vos données d’incidents DLP (Prévention des pertes de données). Chaque vue agit comme une lentille sauvegardée qui analyse une tranche spécifique d’activité d’incident, mettant en lumière des schémas récurrents, des utilisateurs à risque, des points chauds de politique et des comportements inhabituels sous forme de liste classée de Insights.
Rather than running manual queries, you simply open a view to see the latest AI-generated report.
The Views List
Navigate to Views > Data Loss to see your available analysis cards. Each card includes:
- Title & AI Summary: A headline summary of the latest findings.
- Insight Count Tiles: Tuiles de statistiques regroupées par catégorie, telles que User Behavior, Application, Domain, Policy, Data Volume, File, et General.
Click any card to open the detailed view.
The View Detail Page
Summary Banner
A single-paragraph summary at the top of the page provides a high-level narrative of what the AI detected in the current reporting period.
Insights List
Insights are AI-generated findings that automatically surface meaningful changes, trends, and anomalies in your DLP data. Instead of manually sifting through thousands of incidents, insights answer the question: “What’s different, unusual, or worth investigating in my DLP activity right now?”
Insights are ranked by severity (Critical → High → Medium → Low). Each card displays:
- Severity & Type: Identifying the risk level and category.
- Summary: A short description of the finding.
- Metrics & Trends: A right-hand panel showing headline metrics (e.g., “% change” compared to the prior period) or a trend sparkline.
- Status: Si une information a déjà été transmise à un niveau supérieur, un badge Promoted apparaît avec un lien direct vers le dossier associé.
Incident Volume Chart & Table
Below the insights, the page provides the supporting data for the entire view:
- Volume Chart: A time-series graph showing incident counts and data transfer volume.
- Incidents Table: A paginated list of raw incidents. Clicking a row opens the full incident detail in a side panel. This is a representative sampling of the incidents that were investigated.
Understanding Insight Types
Every AI-generated finding is categorized to help you identify the root cause of the risk:
| Étiquette | What it Surfaces |
|---|---|
| Data Volume | Significant spikes or drops in data transfer or incident counts. |
| User Behavior | Individuals or groups whose activity deviates from the norm. |
| Application | Unusual activity within specific apps (e.g., Google Drive, Dropbox). |
| Domain | High volumes of data moving to specific external domains. |
| Policy | Specific DLP policies triggering at unusual rates. |
| File | Specific files (by MD5) being transmitted repeatedly. |
| General | Cross-entity findings that don’t fit a single category. |
Investigating & Promoting Insights
To dive deeper, click an insight to open the Insight Side Panel. This panel provides:
- Key Findings: Factual sentences summarizing the detection.
- Why This Matters: A bulleted list explaining the specific security risk.
- Period Comparison: Side-by-side cards comparing metrics and top entities against the previous time window.
- Involved Entities: Metric rows for the specific users or apps linked to the finding.
Promote to Case
Si une conclusion justifie une enquête formelle, cliquez Promote to Case dans le panneau latéral. AISecOps créera un dossier New pré-rempli de tout le contexte et les preuves de l’analyse. Une fois promu, le bouton changera en View Case.
Report Freshness & Access
- Automation: Les insights sont générés une fois par jour à 2h30 du matin PST. Si vous voyez un « Générer des insights... » la page se mettra à jour automatiquement une fois que l’IA aura terminé la course.
- There are two RBAC permissions under AI Security Operations, DLP Agent and Insider Threat. DLP Agent permissions gives you permissions to all of aisecops except for Insider Threat. There are no separate permissions only for the Data Loss views.
Insider Threats
La page Insider Threats vous permet de créer des listes de surveillance d'utilisateurs pour des utilisateurs ou des groupes spécifiques afin de surveiller les activités malveillantes ou les infections actives par des logiciels malveillants. Vous pouvez filtrer par Users, Risk Level ou Watch Reasons.
Clicking the tiles in the Summary will also filter for who fall under any of those tiles. Clicking multiple tiles serves as an OR filter. These tiles are dynamically generated based on findings.

Clicking on any specific user will provide the generative analysis for that user. This analysis is dynamically generated and may include more or less than following examples.For example, some tiles such as the following will appear:
-
Anomaly Breakdown

-
DLP Incidents

-
Behaviorial Anomalies

-
Policy Alerts

-
Active Malware Detections

-
Malicious Site Visits
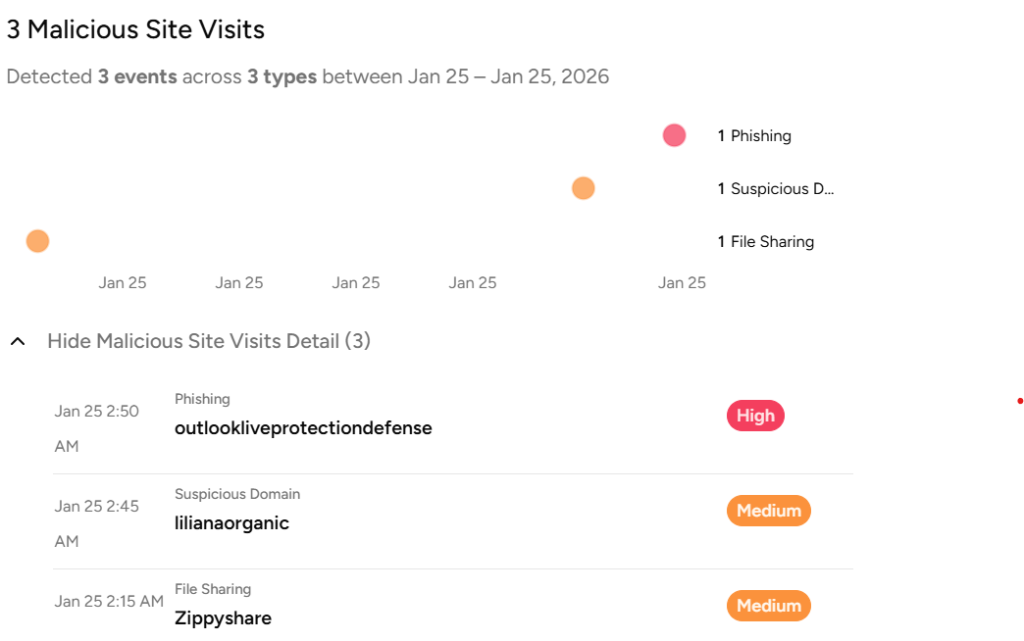
-
Key Findings

-
Recommended Actions


