

Advanced Wi-Fi Diagnostics gives you visibility into Wi-Fi network performance across the sites and users in your organization. It combines site-level and per-user metrics, signal strength, disconnects, roaming, gateway latency, and throughput so you can spot and troubleshoot Wi-Fi issues without analyzing the raw data yourself.
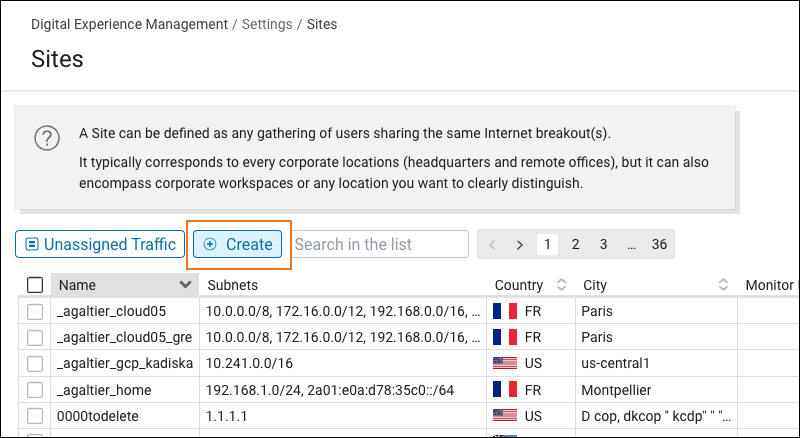
Advanced Wi-Fi Diagnostics organizes sites into two categories: sites you’ve already defined, and recommended sites the system has detected but you haven’t set up yet. If you want to start monitoring a new location, go to Digital Experience Management > Topologies > Sites and click Create to configure a new site before proceeding.
Prerequisites
Before you use Advanced Wi-Fi, ensure you have:
- Netskope Client version 138 or later.
- Active sites configured in DEM.
- A DEM Enterprise Starter or DEM Enterprise subscription.
- Location Services enabled on Windows devices, if you want roaming and access point (BSSID) data collected for those devices.
- Windows Event Collection enabled, if you want SSID data collected on Windows devices.
Note
This article calls out a few capabilities that are only available if your organization has access to the Advanced Wi-Fi Diagnostics.
To view Wi-Fi performance metrics for your sites:
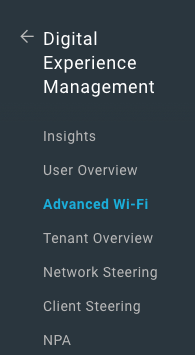
- In your Netskope tenant, go to Digital Experience Management > Advanced Wi-Fi in the left panel.
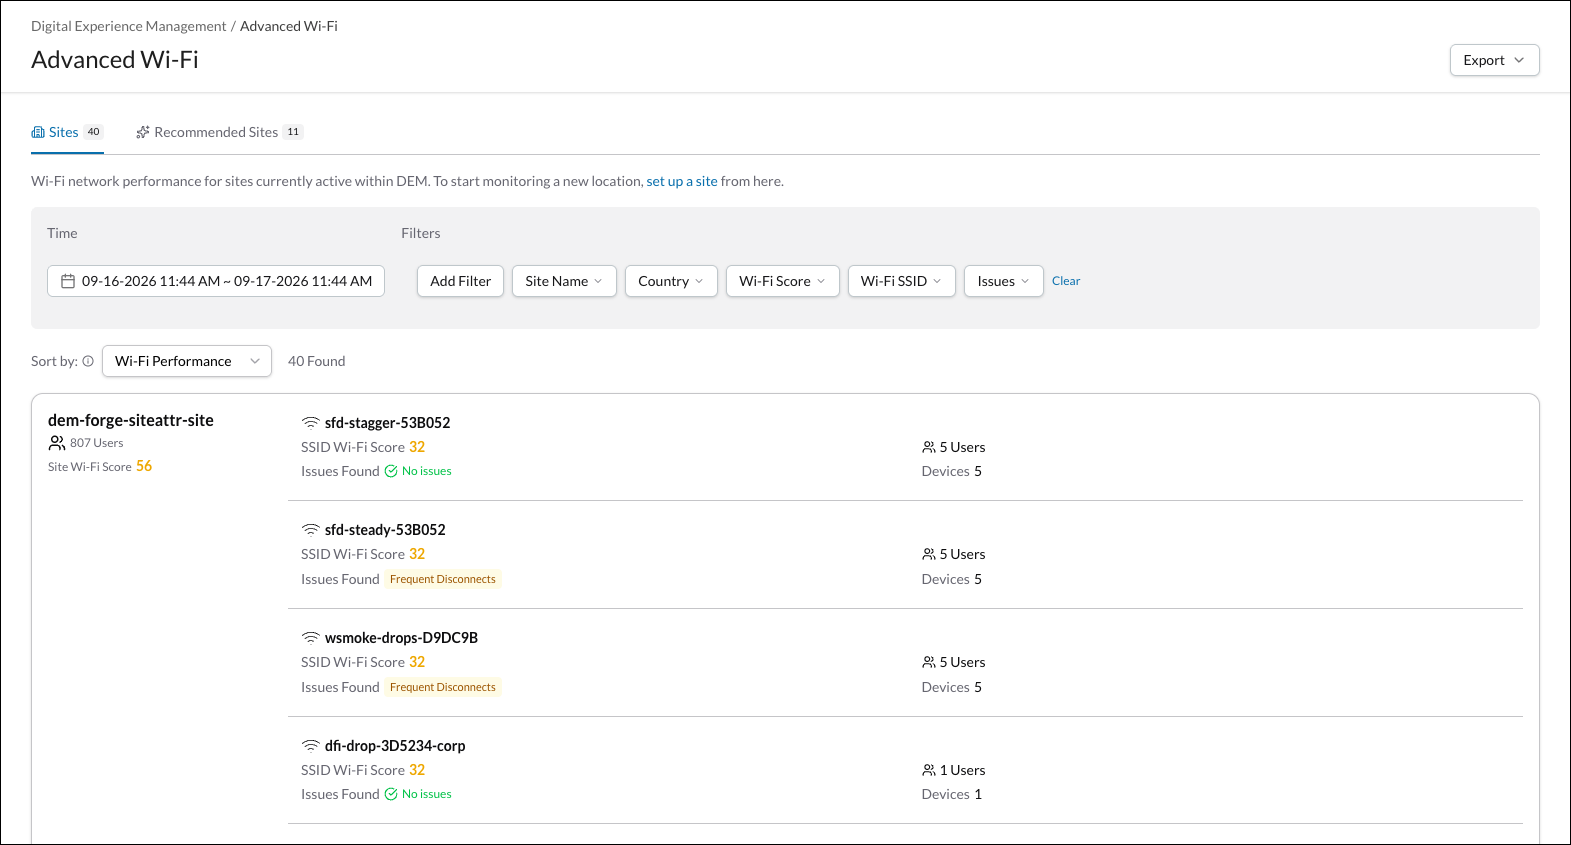
- Select the Sites tab to see Wi-Fi performance for sites currently active within DEM.
Tip
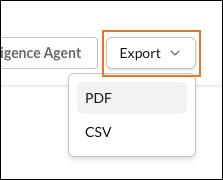
Use the Export button to download this page in PDF or CSV format.
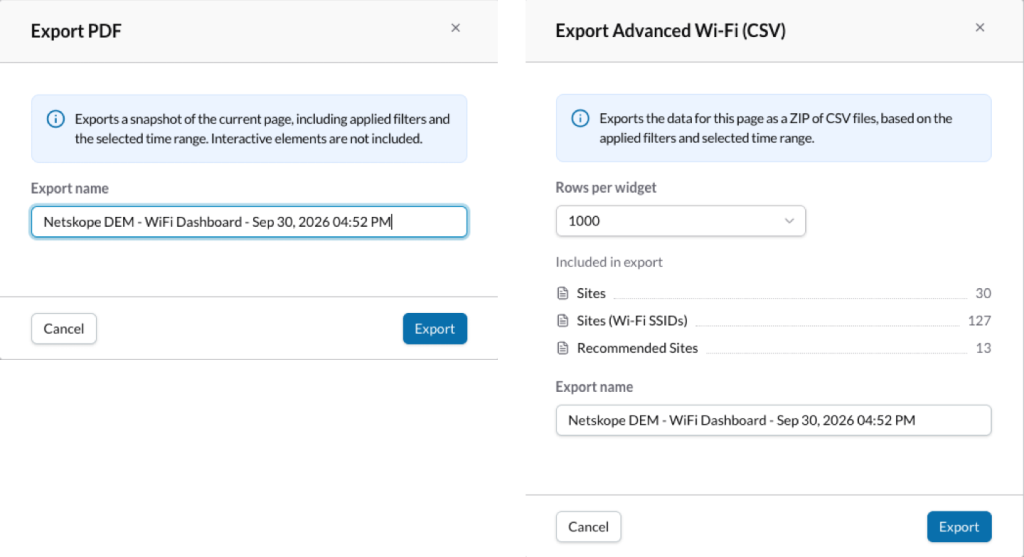
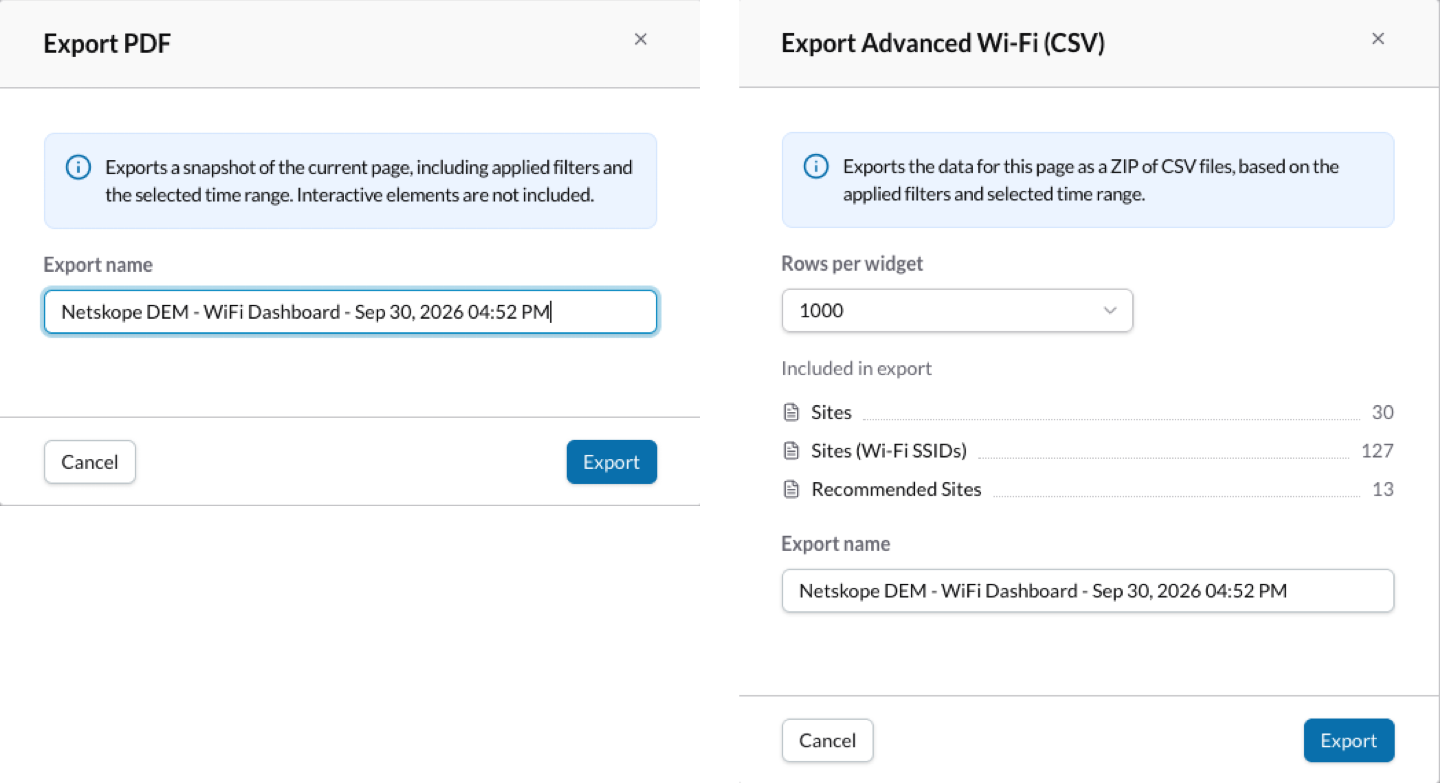
Keep or change the name. For CSV, you’ll see what’s included in the export, and you can select the number of rows to include. Click Export to download the file.
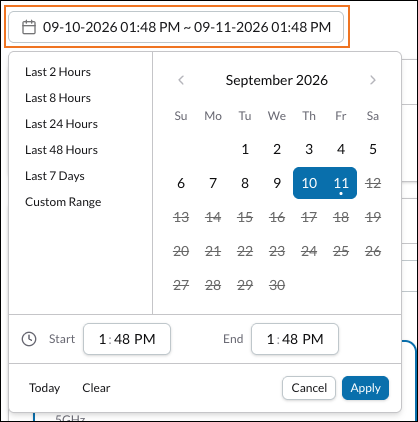
- To choose a time range, click on the Time field and specify a new time range.
- On the Sites tab, click Sort by to rank sites by Wi-Fi Performance (low to high), by Site Name (A–Z), or by Users (high to low).
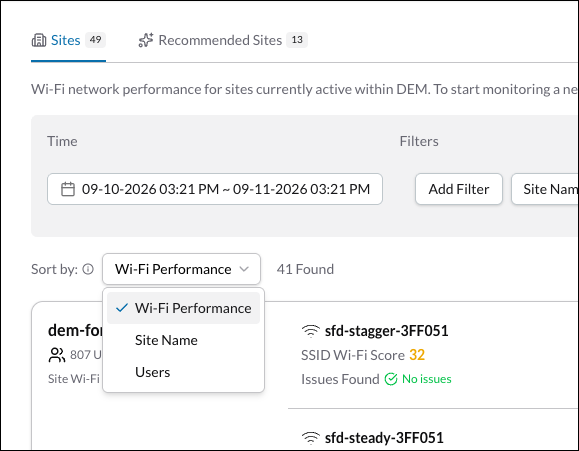
- Click a site or SSID to open go to the Site Wifi details page for deeper analysis, like Site Information and Wi-Fi Performance Analysis details.

Note
The Site Information panel may show different counts for users and devices, since these aren’t always the same number. A site with 28 connected users might have 32 connected devices if some users are connected from more than one device.
- Click the User count to open the Site User List side panel.
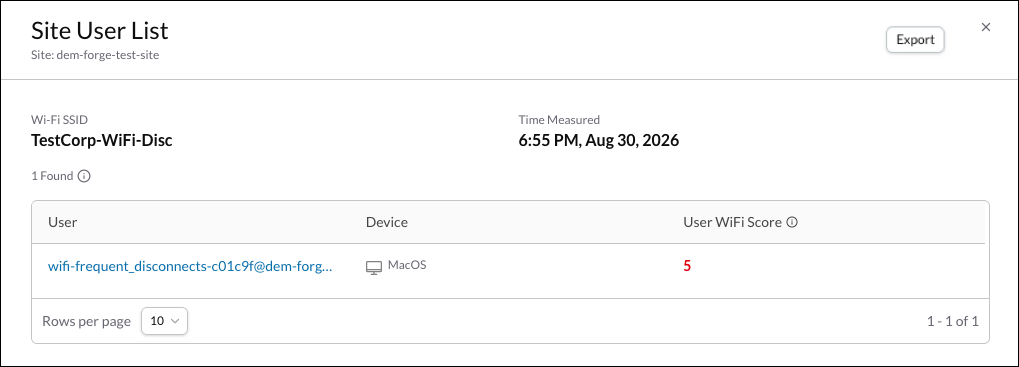
The Site User List side panel lists every user connected to the site (across all of its SSIDs in the selected time period), the type of device, along with each user’s Wi-Fi score.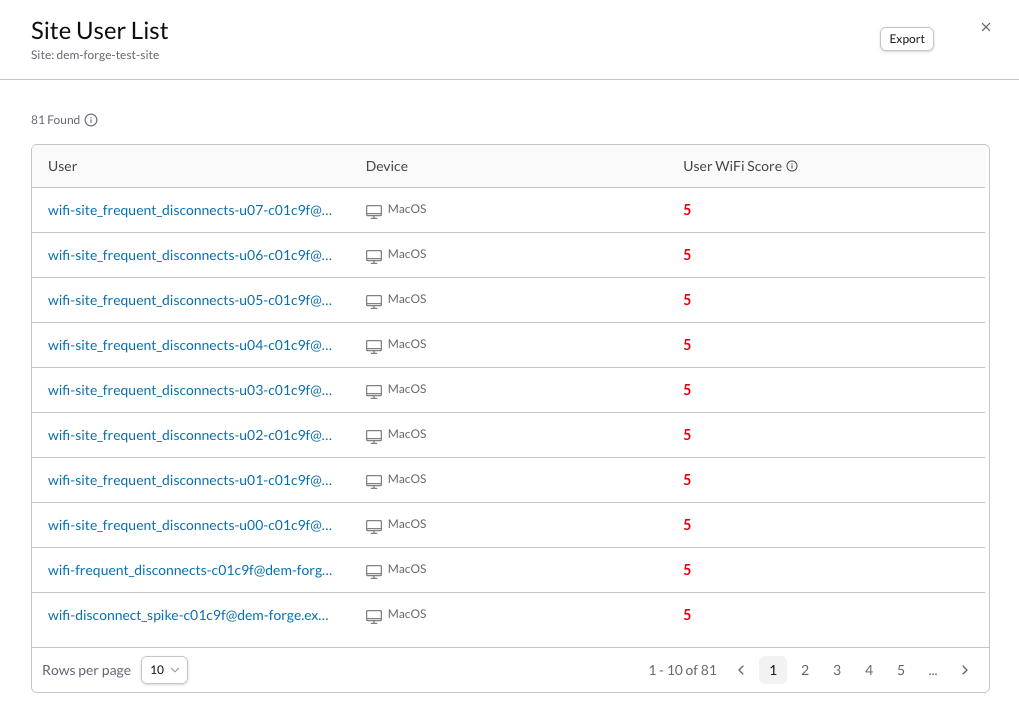
Tip
Use the Export button to download this page in PDF or CSV format.
Clicking on a user will take you to the User Wi-Fi Detail page, which can be also reached via User Overview > User Details > View Wifi Details.
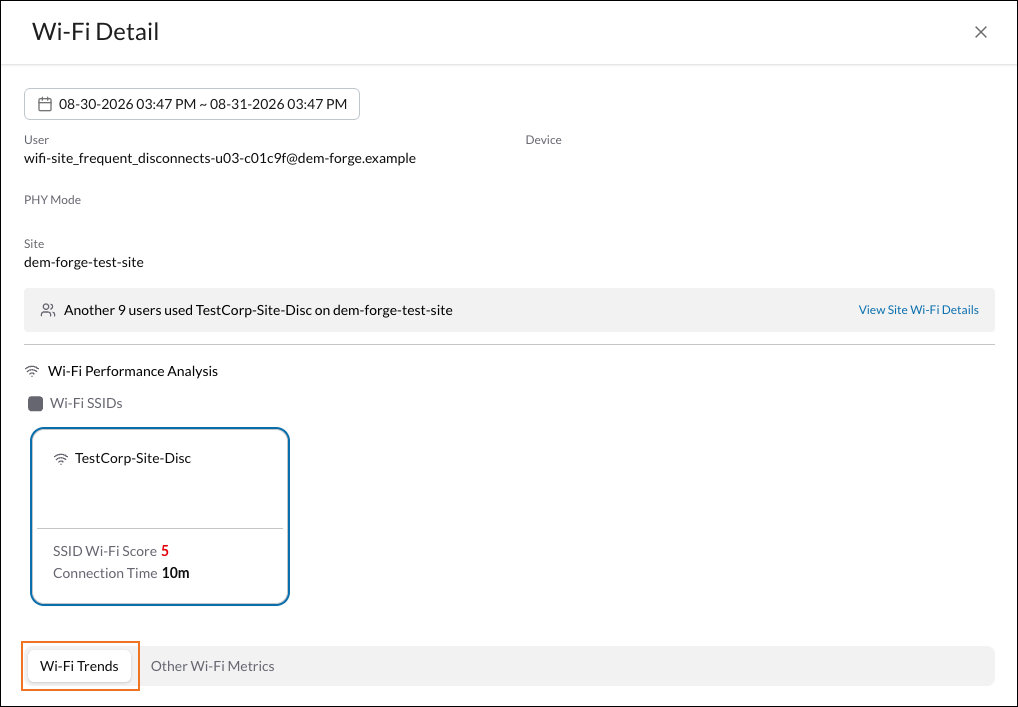
- Review the Wi-Fi Trends charts:
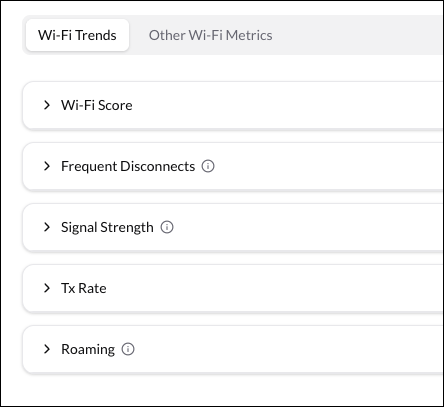
- Wi-Fi Score: A 0–100 score for Wi-Fi quality, recalculated every 5 minutes. Hover over a point on the chart to see which users contributed to that 5-minute score and who was actually connected during that window, and then click to open a side panel with the same list, from which you can click through to an individual user’s Wi-Fi details. The score for an SSID reflects the combined experience of everyone connected to it, and drops further when an issue is actively detected. See Understanding Wi-Fi Issues for more details. Click the down arrow
 to Export a CSV file with this data.
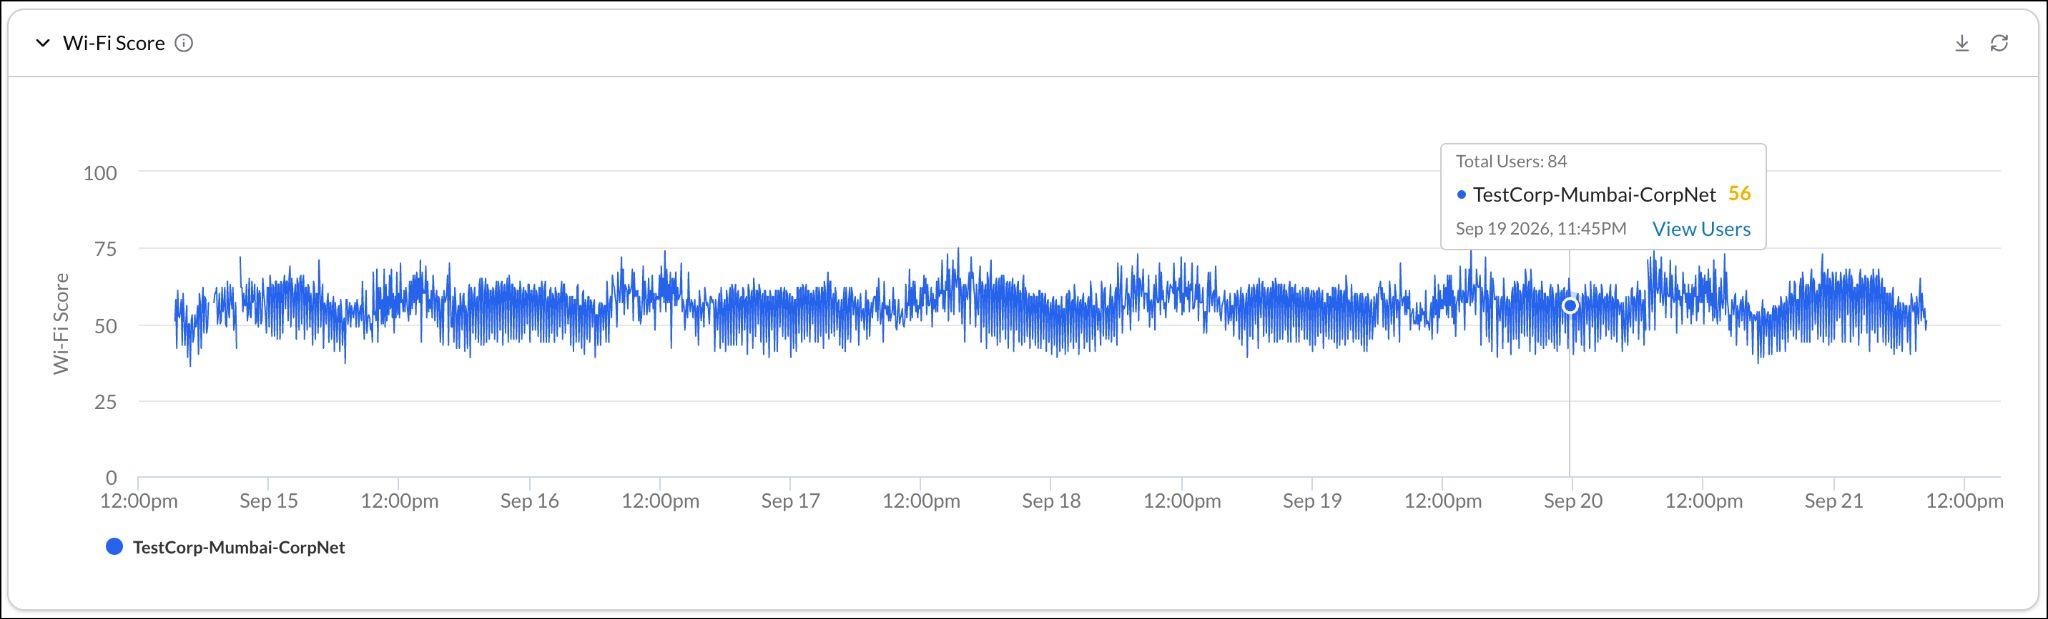
To learn more about how scores are calculated, see How DEM User Experience Scores are Calculated.Tip
Scores based on very few connected devices are less statistically reliable. Treat scores for small sites or SSIDs with caution.
For a more granular view, use your mouse to highlight and expand the chart to show more incremental time periods.

Hover over the metrics and click View Users to open the Site User List side panel and see the User, Device, and User Wi-Fi Score information.
Tip
Use the Export button to download this page in PDF or CSV format.
You can use the user’s email address to reach out to them if you want to get more details.
- Frequent Disconnects: Devices with disconnects, grouped into 5-minute windows. The time series charts have 2 layers, metrics and issues annotations. The chart shows the raw metric being plotted, with no thresholds; whereas, issues occur when a flag is triggered, with platform caveats. Click the down arrow to Export a CSV file with this data.
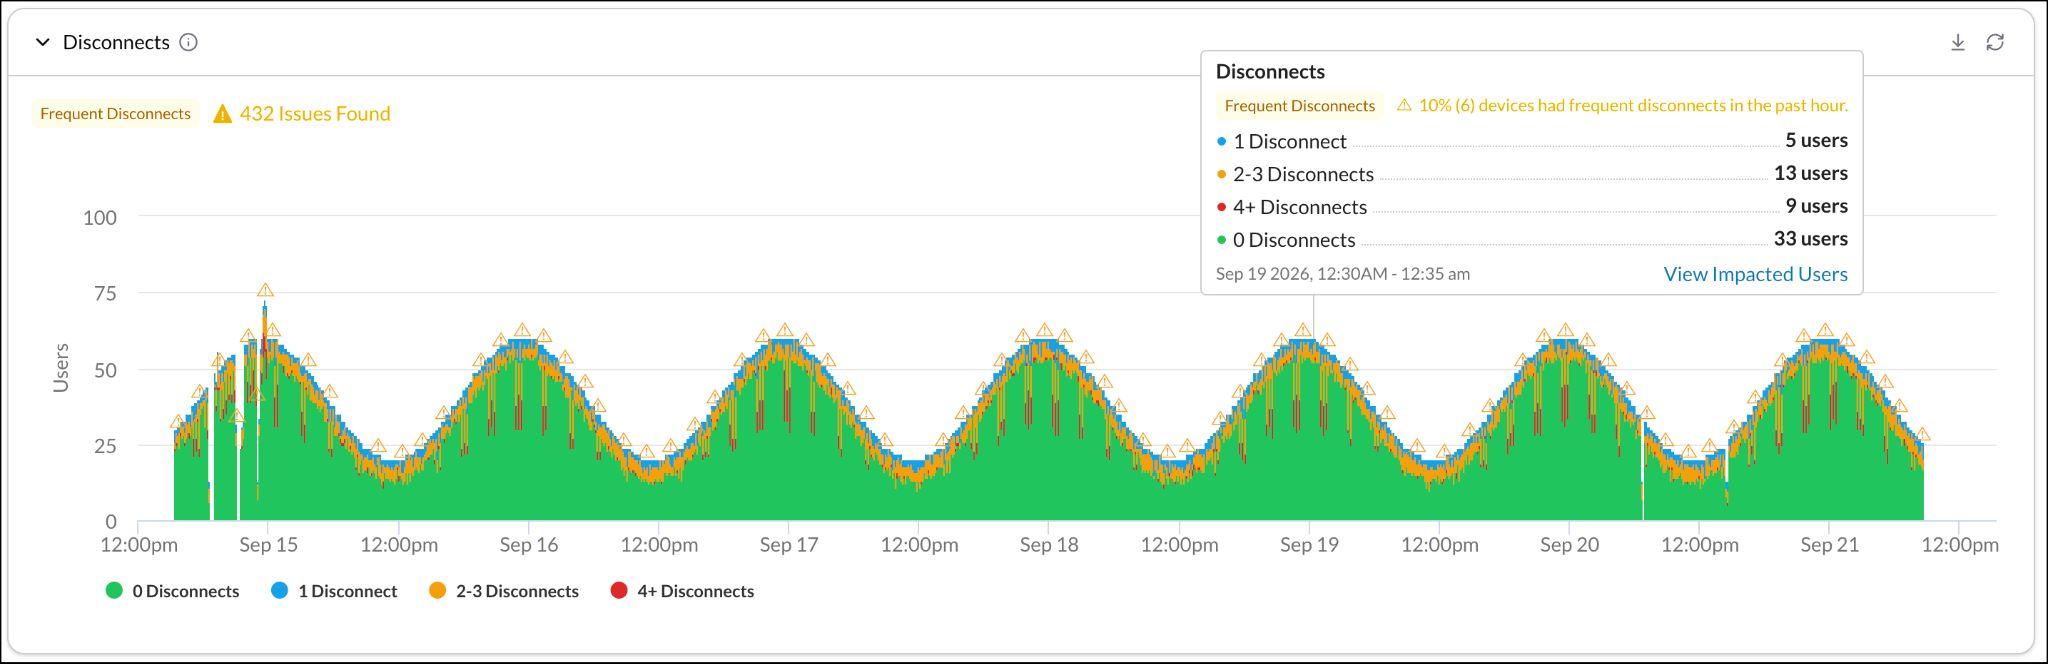
The chart groups the users by the number of disconnects they encounter, such as 5 users with 1 disconnect, 13 users with 2-3 disconnects, 9 users with 4+ disconnects, etc. Each bar quantifies disconnects within a 5 minute time period.An Issue is flagged when more than 10% of devices (minimum 5) have frequent disconnects in a 5-minute window within the past hour, or when 3 new disconnect windows occur since the last issue was detected. On Windows, only non-user-initiated disconnects count toward this metric.When a metric supports issue flagging and an issue is currently active, an Info icon appears above a bar on the chart. Hover over it for a plain-language description of the condition that was met. See Understanding Wi-Fi Issues for more details.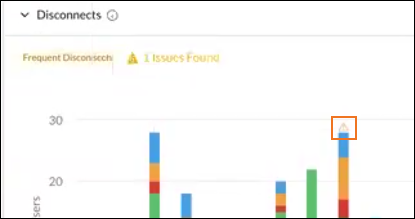
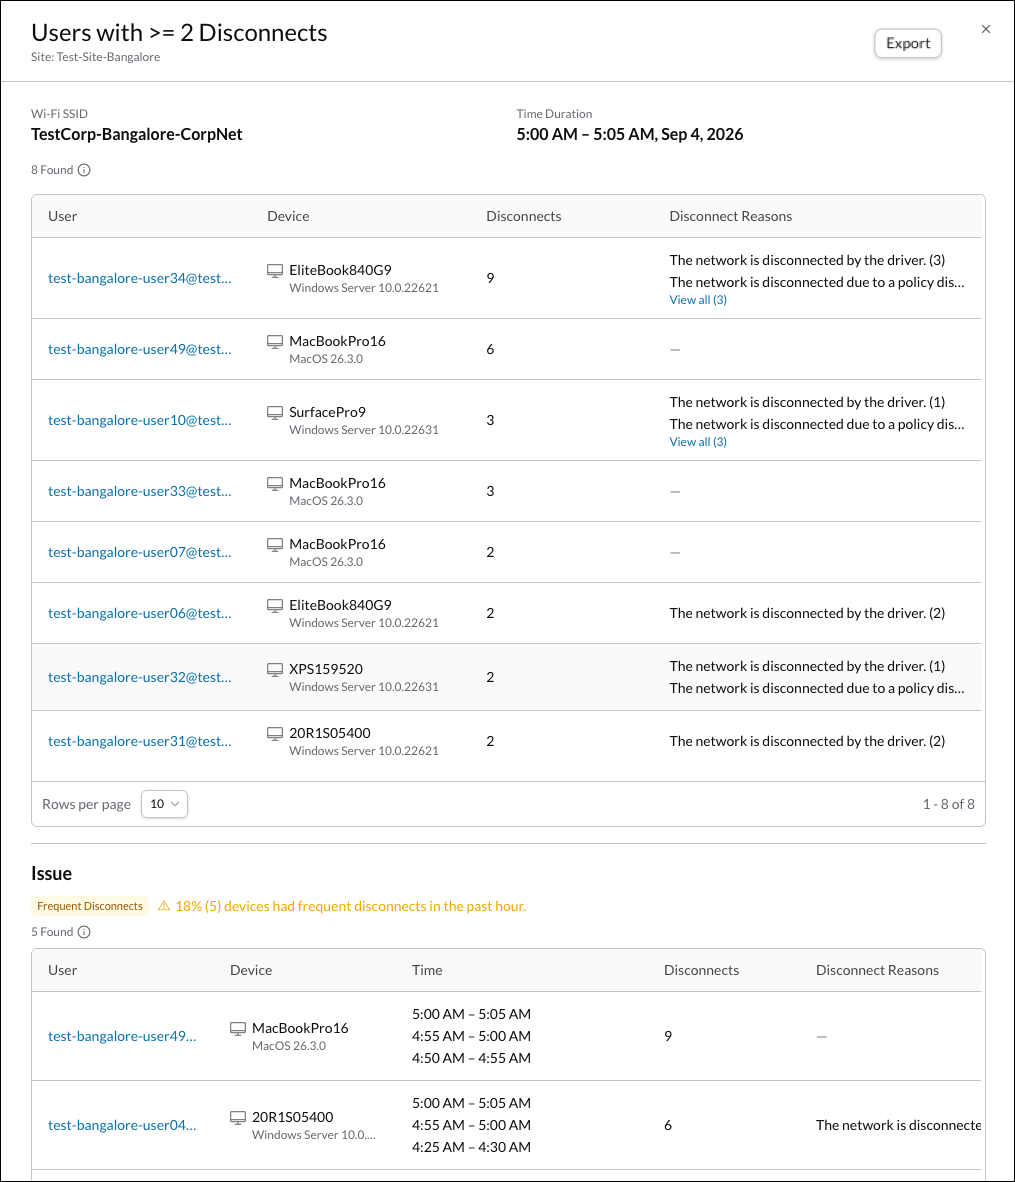
Hover over the metrics and click View Impacted Users to open the Users with Disconnects side panel and see the User, Device, Disconnects, and Disconnect Reasons information. This panel only shows users with more than 2 disconnects since those are the users worth investigating.
If there are issues, there’s an Issue section that shows User, Device, Time, Disconnects, and Disconnect Reasons information.
Note
Disconnect Reasons are only available on Windows devices. On Mac devices, this field is blank because macOS doesn’t report a reason for the disconnect the way Windows does.
Tip
Use the Export button to download this page in PDF or CSV format.
- Signal Strength: Devices grouped by signal strength quality. The time series charts have 2 layers, metrics and issues annotations. The chart shows the raw metric being plotted, with no thresholds; whereas, issues occur when a flag is triggered, with platform caveats. Click the down arrow to Export a CSV file with this data.
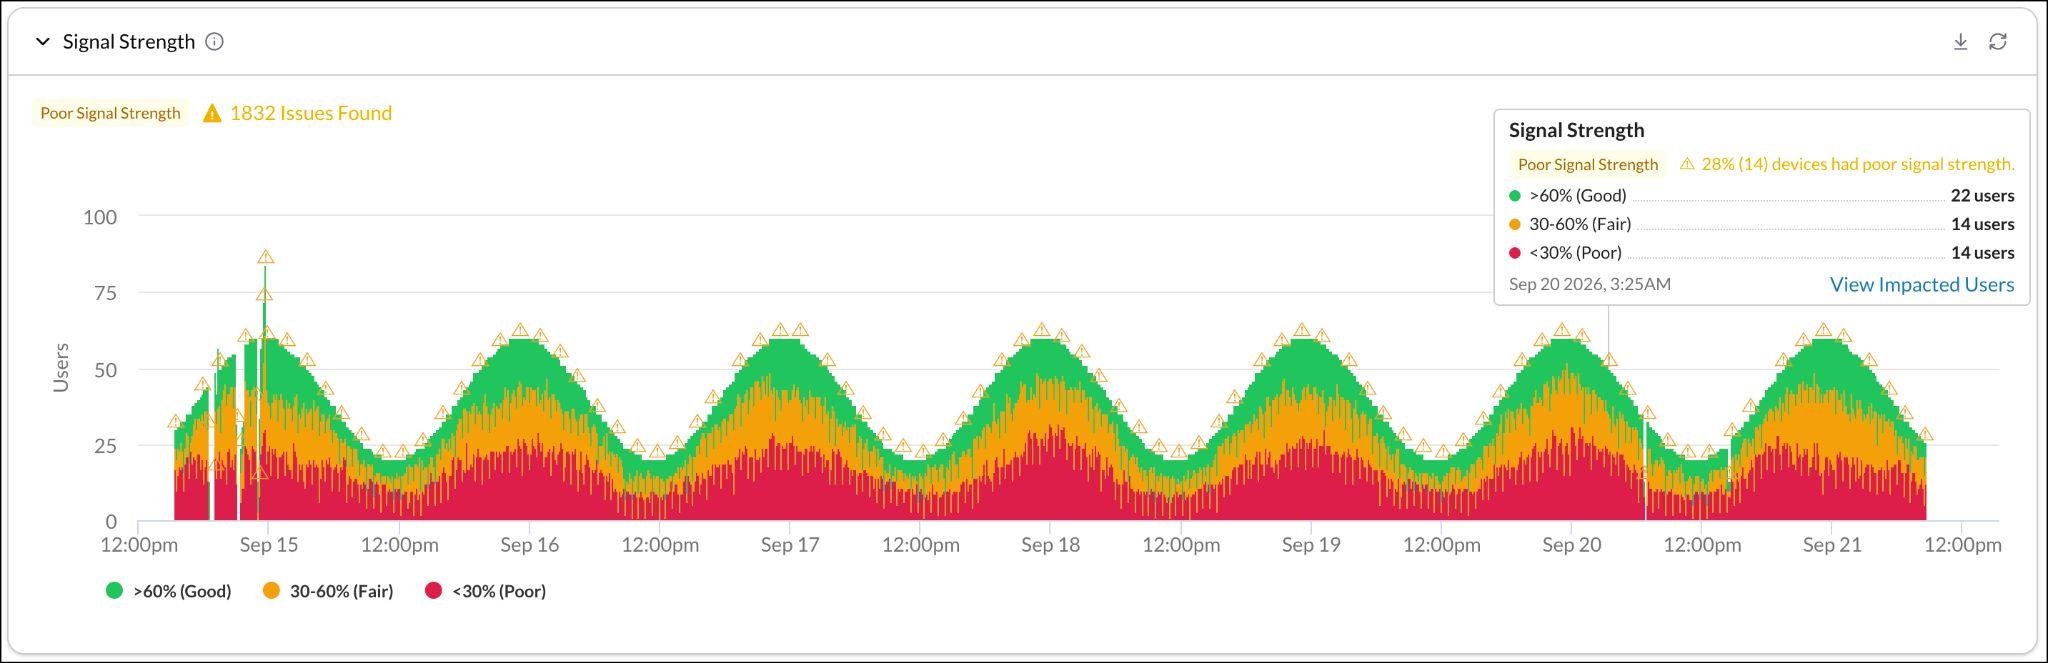
The chart groups the users by the level of signal strength they encounter, such as 22 users with good signal strength, 14 users with fair signal strength, 14 users with poor signal strength. Each bar quantifies signal strength within a 5 minute time period.An issue is flagged when more than 15% of devices (minimum 5) have a poor signal, or when the percentage of devices with poor signals rises 10 or more percentage points above the past hour baseline.When a metric supports issue flagging and an issue is currently active, an Info icon appears above a bar on the chart. Hover over it for a plain-language description of the condition that was met. See Understanding Wi-Fi Issues for more details.
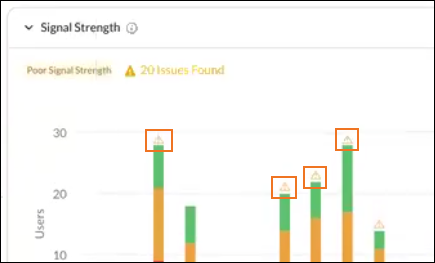 Hover over the metrics and click View Impacted Users to open the Users with Poor Signal Strength side panel and see the User, Device, Signal Strength, Noise, Tx Rate, and BSSID information. This panel only shows users with only poor (<30%) signal strength.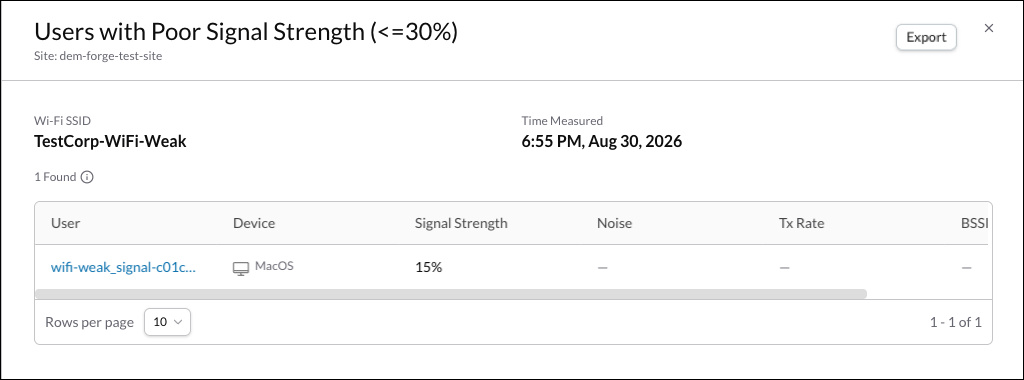
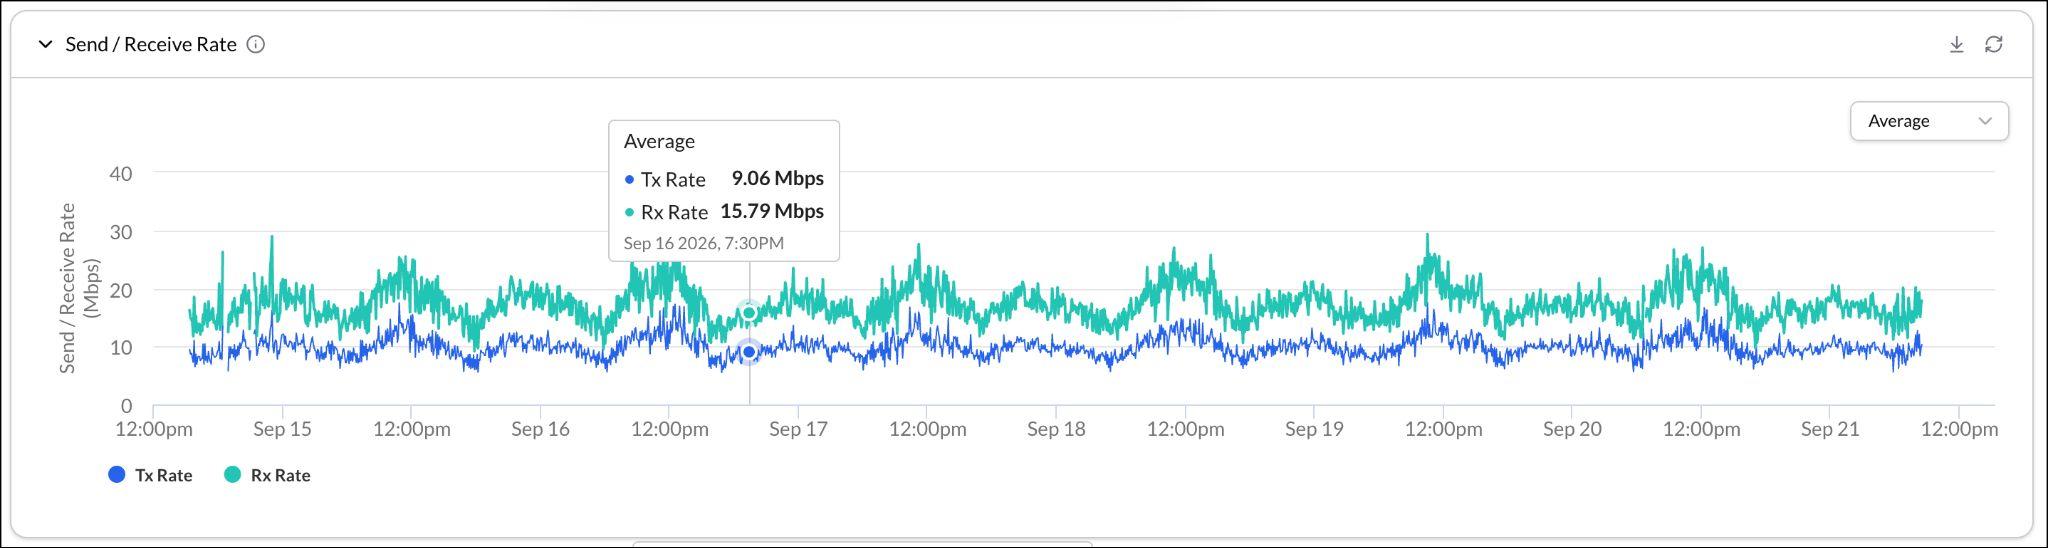
- TX (Send/Receive) Rate: Device Wi-Fi upload and download speeds over time, in Mbps. Each point is a 5-minute average. Click the down arrow to Export a CSV file with this data.
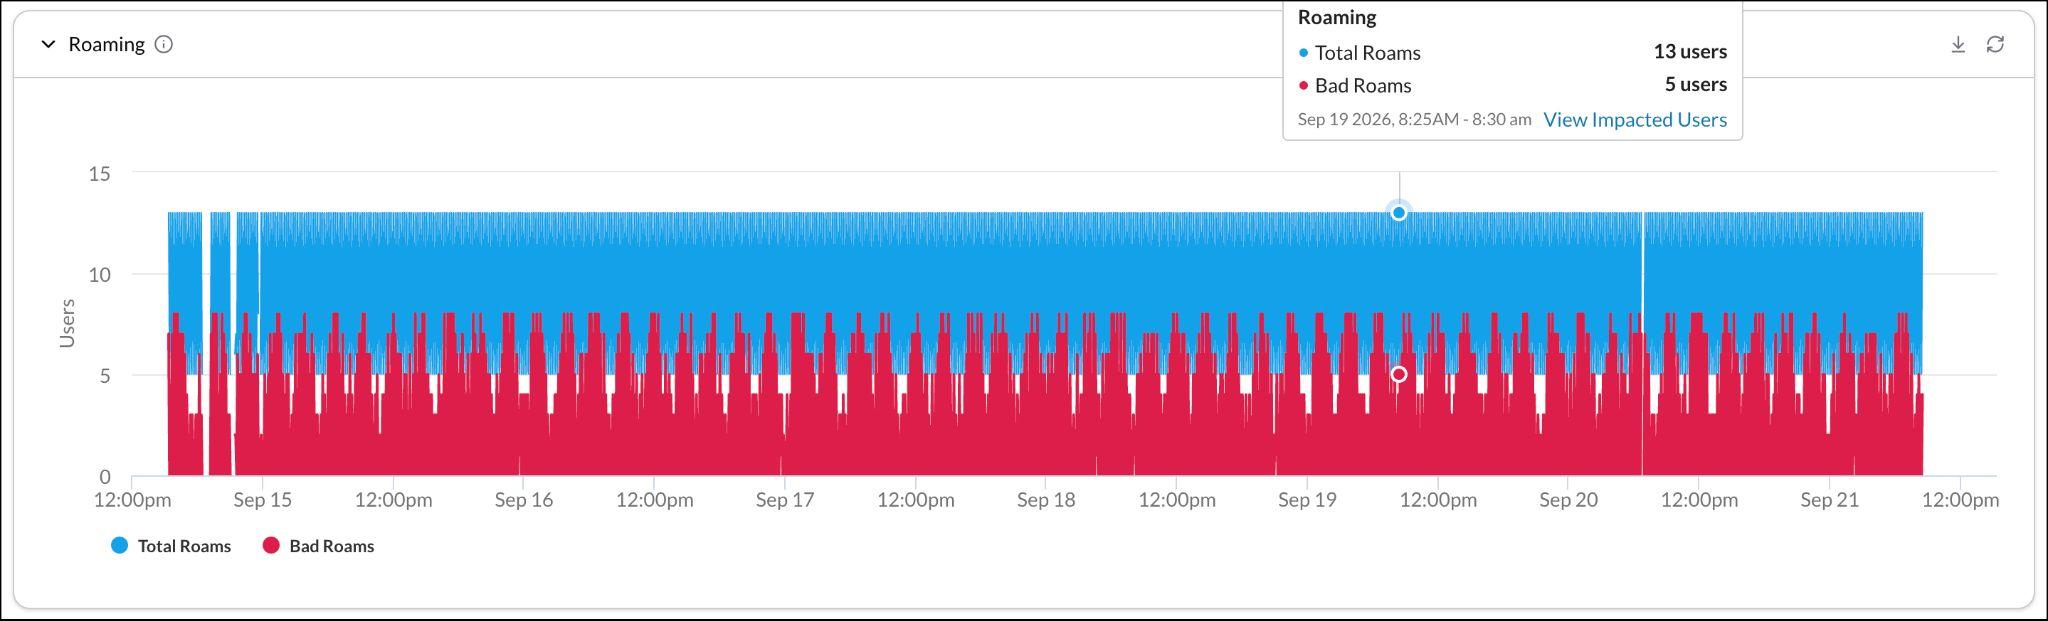
- Roaming: Tracks devices switching between access points on the network. A bad roam is flagged when signal quality drops from Good (more than 60%) to Bad (less than 30%). On Windows, Location Services must be enabled to detect this. Click the down arrow to Export a CSV file with this data.
- When a metric supports issue flagging and an issue is currently active, an Info icon appears above a bar on the chart. Hover over it for a plain-language description of the condition that was met. See Understanding Wi-Fi Issues for more details.
- Wi-Fi Score: A 0–100 score for Wi-Fi quality, recalculated every 5 minutes. Hover over a point on the chart to see which users contributed to that 5-minute score and who was actually connected during that window, and then click to open a side panel with the same list, from which you can click through to an individual user’s Wi-Fi details. The score for an SSID reflects the combined experience of everyone connected to it, and drops further when an issue is actively detected. See Understanding Wi-Fi Issues for more details. Click the down arrow
- Review the Other Wi-Fi Metrics section:

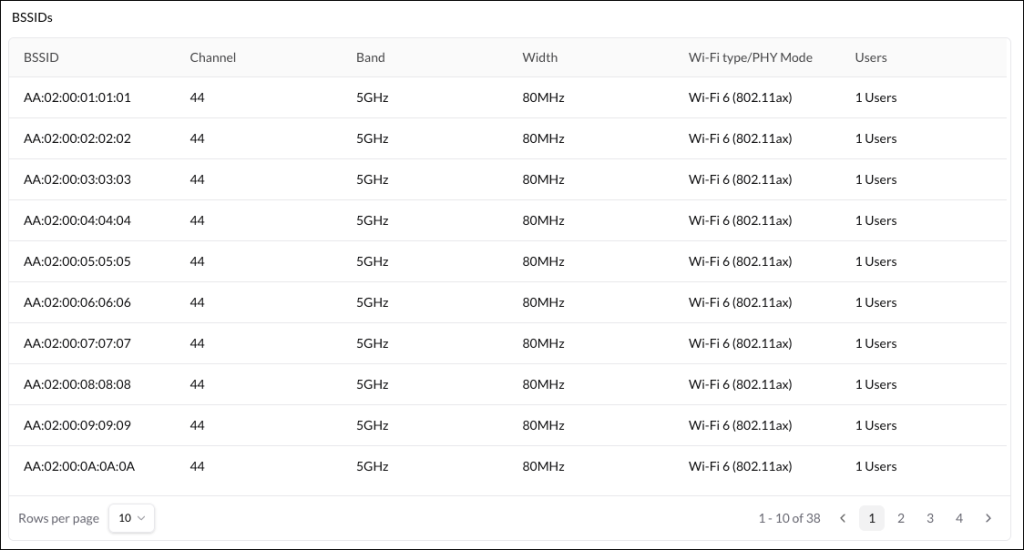
- BSSIDs: Lists every access point (BSSID) devices have connected to on the network. On Windows, Location Services must be enabled to collect this.
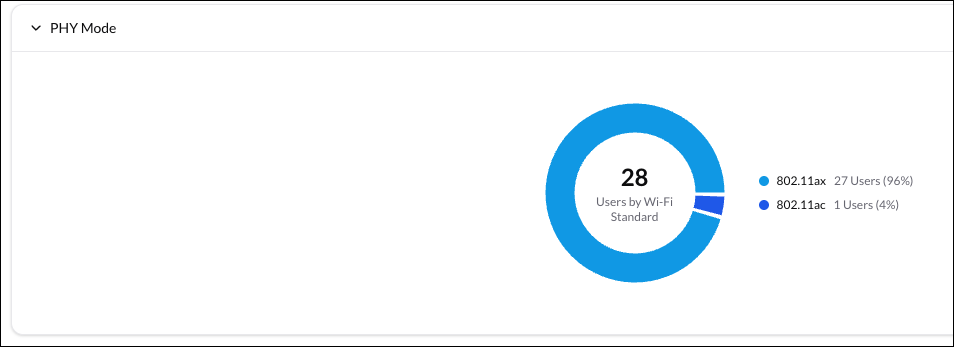
- PHY Mode: Breakdown of connected devices by Wi-Fi generation — for example, Wi-Fi 5 (802.11ac) or Wi-Fi 6 (802.11ax).
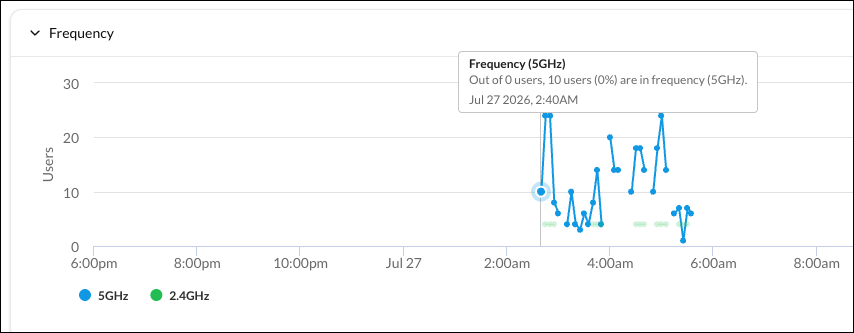
- Frequency: Number of users connected on each radio band (2.4GHz or 5GHz) over time.
- BSSIDs: Lists every access point (BSSID) devices have connected to on the network. On Windows, Location Services must be enabled to collect this.
- Use the filters at the top of the page to narrow the metrics shown.

- Use the Export button to download the Wi-Fi page in PDF or CSV format.
Viewing Recommended Sites Wi-Fi Information
Recommended Sites detection runs weekly and only surfaces networks used by 10 or more people over the past 7 days. This helps admins identify and track the sites users go to that may be useful and are worth reviewing. To review recommended sites: and decide whether to add them as sites in DEM:
- In your Netskope tenant, go to Digital Experience Management > Advanced Wi-Fi in the left panel.
- Select the Recommended Sites tab to see locations where enough Wi-Fi activity has been detected, but that hasn’t been specified yet.
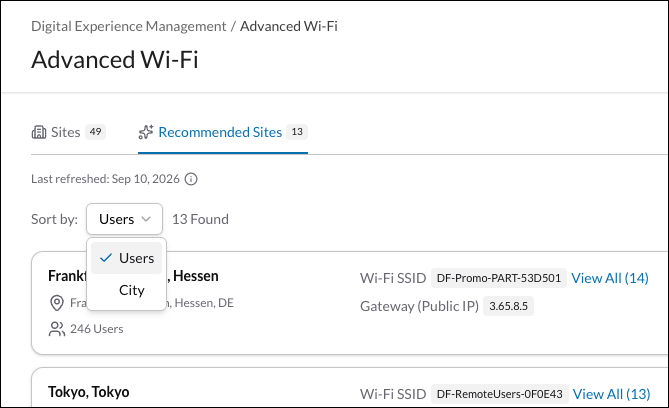
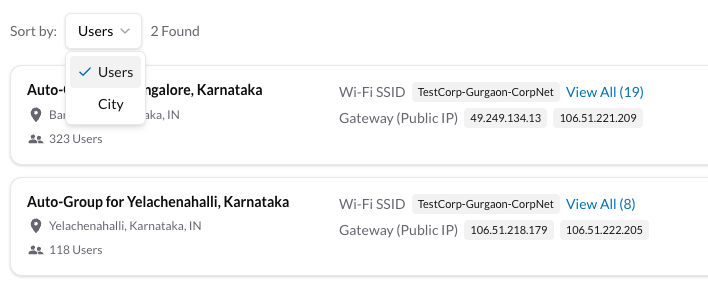
- Sort the list by User or City.
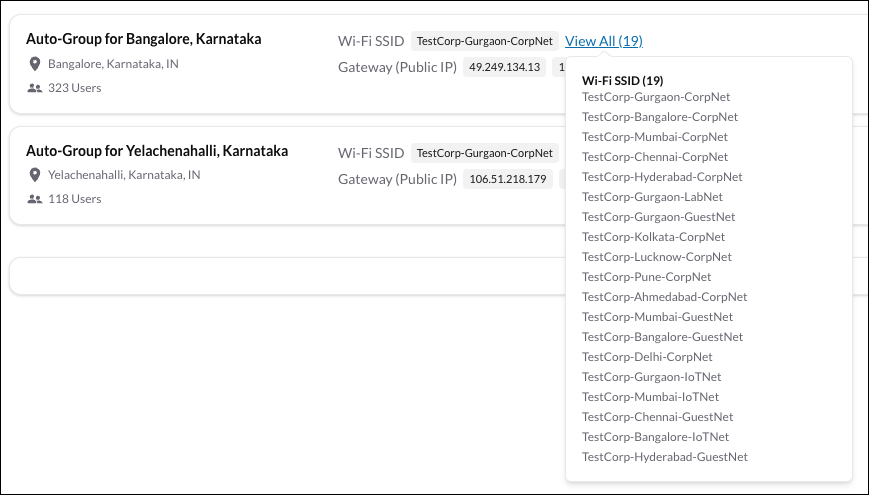
- You can also view all users and cities associated with a recommended site.
- To turn a recommended site into an active site, copy its Public IP(s) and city name, and then go to the Sites tab and click set up a new site.

- On the Sites page, click Create and follow the instructions here.
Understanding Wi-Fi Issues
Advanced Wi-Fi Diagnostics flags an issue when a metric crosses a defined threshold, so you can tell at a glance which users or sites need attention, instead of having to interpret raw trend data yourself. Issues currently appear on two metrics: Frequent Disconnects and Poor Signal Strength.
| Issue | Trigger Condition |
|---|---|
| Frequent Disconnects | Users: Device disconnects per 5-minute window, broken down by reason. Flagged as an issue if disconnect was observed in 3+ windows in the past hour, or 3 new windows since the last issue. Only Windows devices include Reason codes and exclude user-initiated disconnects Sites: More than 10% of devices (minimum 5) have frequent disconnects in a 5-minute window within the past hour, or 3 new disconnect windows have occurred since the last issue was detected. |
| Poor Signal Strength | Users: Device’s Wi-Fi signal strength over time. Flagged as an issue when signal drops to 30% or below. Sites: More than 10% of devices ( min 5) have a poor signal or when the percentage of devices with poor signals rises 10 or more percentage points above the past hour baseline. |
When an issue is flagged, click View Users or View Impacted Users to open a side panel with two parts:
- Impacted users: Filtered to show only users with more than 2 disconnects in the window (users with 0 or 1 disconnect aren’t shown, since that’s considered normal). For each user, this lists the username, device, and time period.
- Issue detail: The specific users, device, time period(s), total number of disconnects, and disconnect reason that triggered the flagged issue.
Note
Disconnect Reasons are only available on Windows devices. On Mac devices, this field is blank because macOS doesn’t report a reason for the disconnect the way Windows does.