

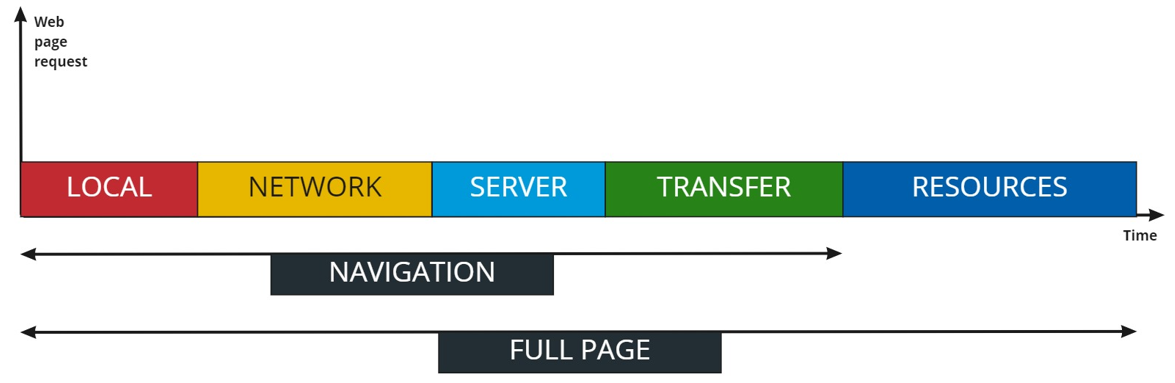
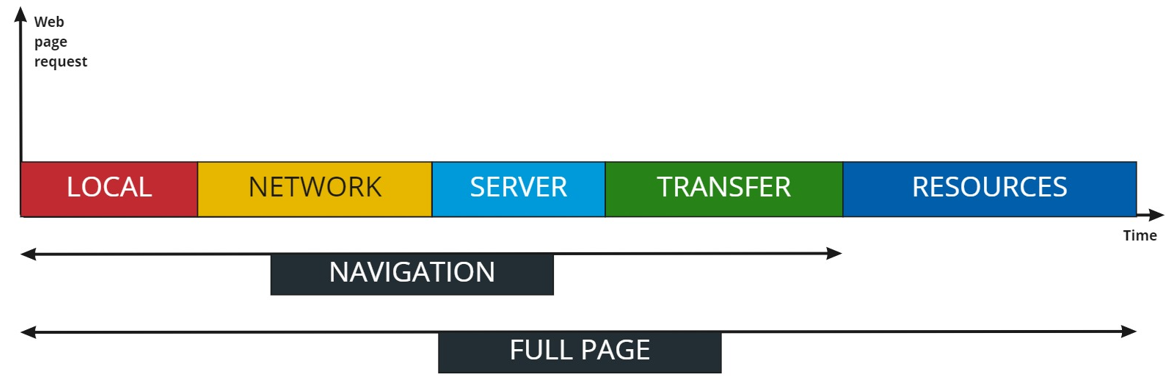
The process of loading a web page can be split into the following main steps:
- The browser processes the request locally, checking for example for local cached data, before performing any network request.
- If the resource is not available locally, it is requested on the network.
- The server receives the request and processes it.
- The data required to build the structure of the page are transferred from the server to the browser through the network.
- The additional resources required to render the page are being fetched and the page is finally rendered on the user’s browser.
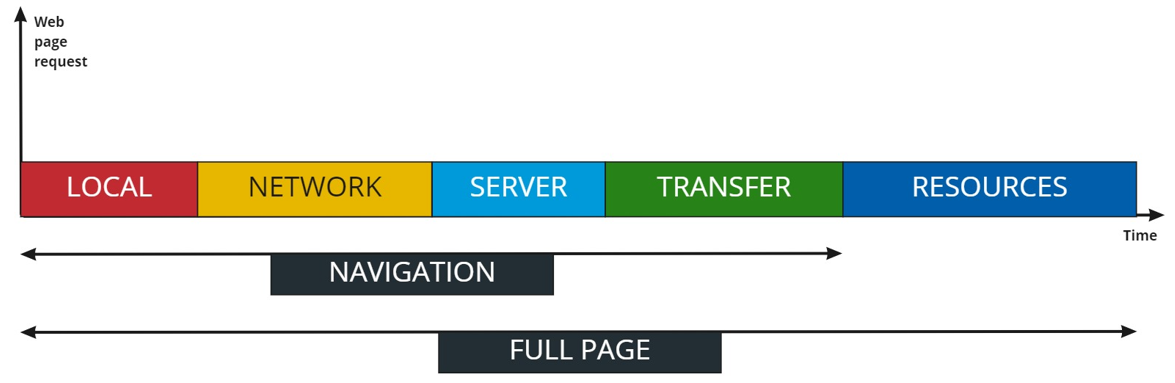
Subsequently we’ll address each part mentioned above in more detail. We first define some of the generic components like pages, hits, protocols and resources.
Page URL
A Page URL is defined as any URL that triggers parsing an HTML file that is then rendered on the client’s browser.
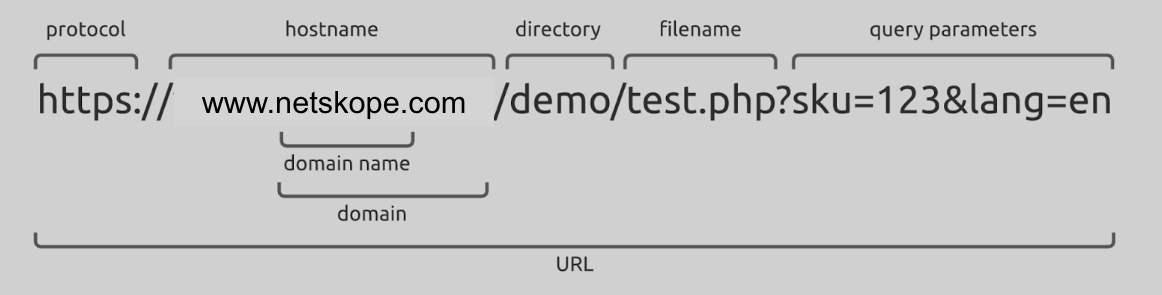
From a W3C Time Navigation API standpoint, when the browser requests a page, a new Navigation calculation is triggered.
API Call URL
An API Call URL is defined as any URL that triggers an API call to be made to a target server on behalf of a browser. This differs from a Page URL based on the type of data / content that is received from the target server. Typically API Call URLs will return data in XML or JSON formats, whereas Page URLs will return web resources such as CSS, javascript, and images.
Page Loads and Requests
When a browser requests a web page and related web resources (JavaScripts, images, stylesheets, …), it sends HTTP requests to the different servers on which these resources reside. A call to a web resource is called a “Page Load” or “Request” depending upon the type of web request made, web resources or API calls respectively.
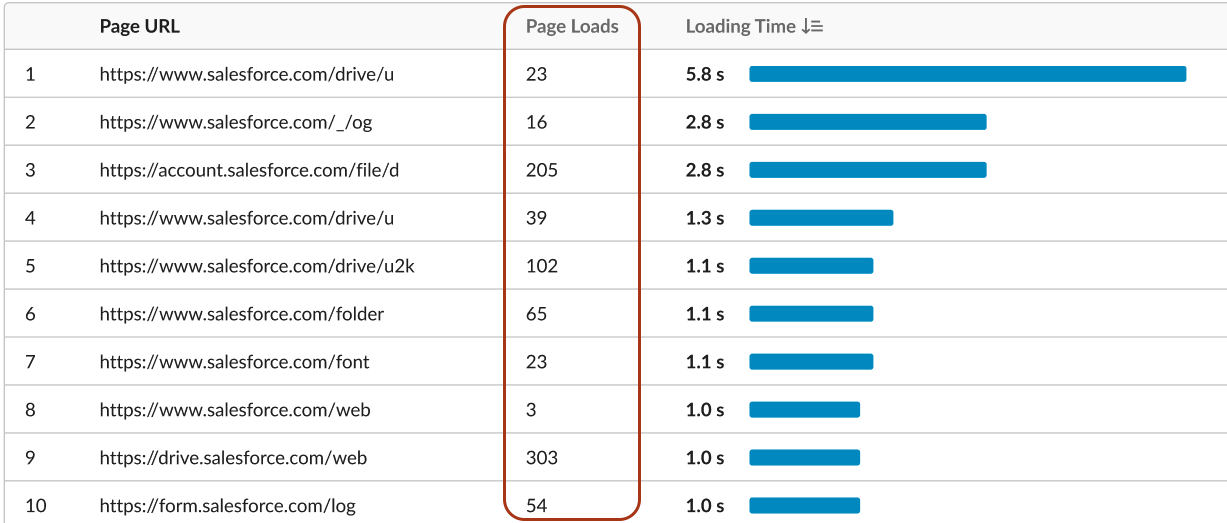
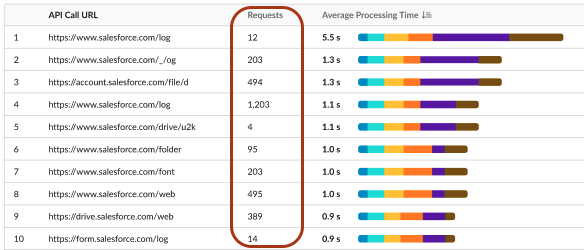
The Netskope DEM platform distinguishes three types of page loads:
- The “navigation” page load is the one that triggers the initial web page request.
- A “resource” page load triggers the query of all types of resources, with the exception of the “navigation” page load itself.
- A “request” page load is a subpart of the “resource” page load category. It only includes requests initiated by the following initiator types: xmlhttprequest, fetch and beacon. This type of hit is critical to the context of “Single Page Applications”.
MIME Type
MIME stands for Multipurpose Internet Mail Extensions. The “MIME Type” actually identifies the type of resource that is loaded. So regarding the example above, the MIME type is “css”, as the file style.css is loaded.
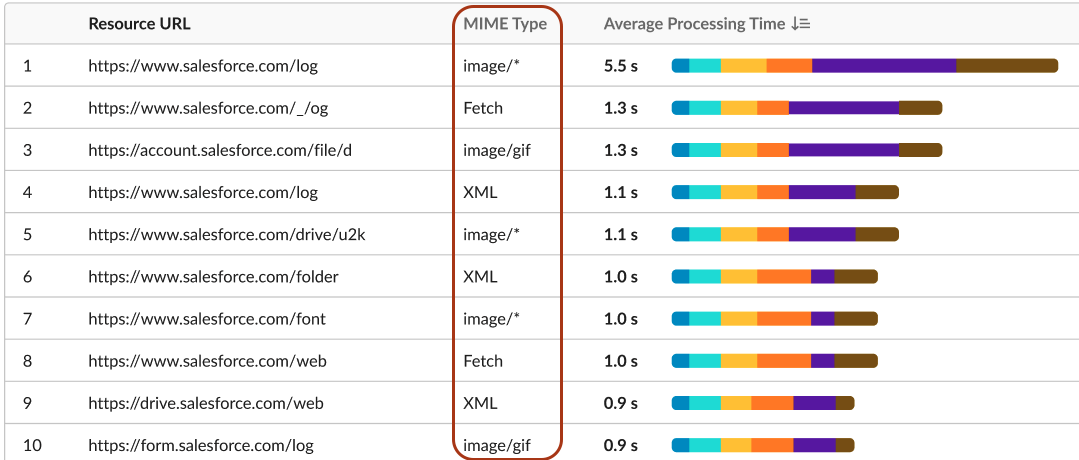
This information is not provided by the browser. Netskope has built specific heuristics to map filenames to corresponding MIME types.
Processing Time
The process of loading a web page can be split into the following main steps:
- The browser processes the request locally, checking for local cached data for example, before performing any network request
- If the resource is not available locally, it is requested on the network
- The server receives the request and processes it
- The requested data are transferred from the server to the browser through the network
- The web page is being rendered on the user’s browser
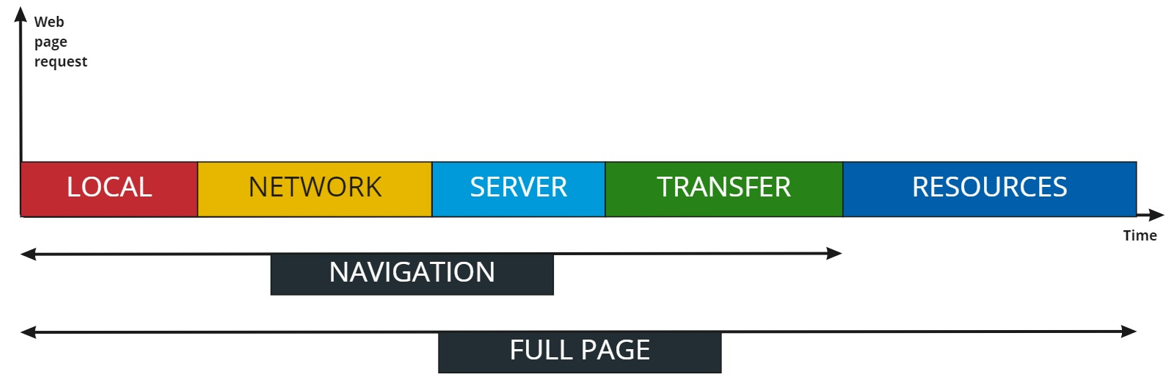
The time it takes for this whole process to be completed corresponds to the Loading Time metric. The navigation timing includes all steps that occur before the web page structure is ready and the resources timing includes fetching all resources that compose the page, so that “Loading Time = Navigation + Resources”.
From a W3C Time Navigation API standpoint, the resources time is defined as the time between the moment the browser has completed parsing the entire HTML file and constructed the DOM (domContentLoadedEventStart) and the moment the whole web page is completely rendered on the user’s screen (domComplete).
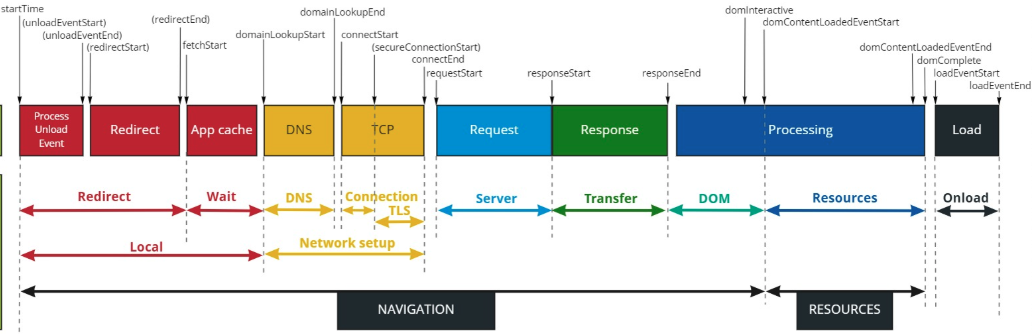
When the domContentLoadedEventStart point is reached, the DOM is ready. Nevertheless, this does not mean that the next step is just about rendering/painting all elements on the screen. Some resources (images, asynchronous JavaScripts, videos, …) may still have to be requested and loaded. This whole process of requesting and getting additional resources is included in this resources phase.
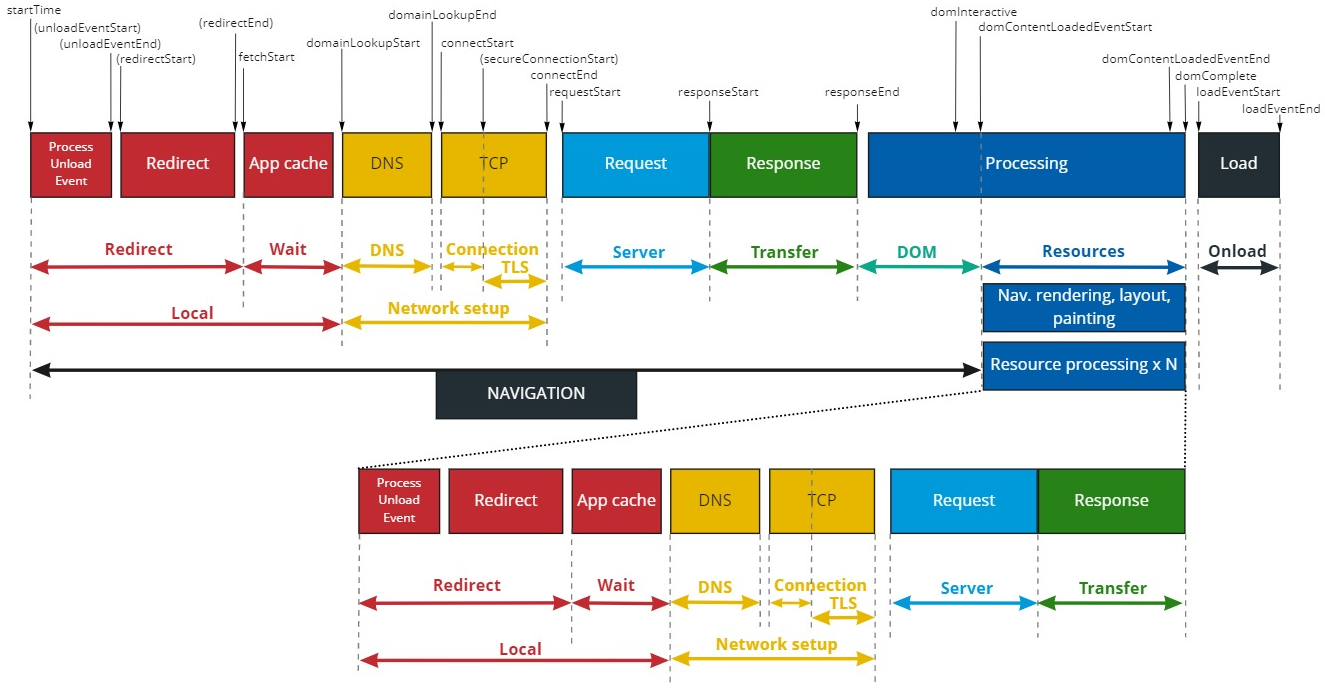
So resources represent different processes that occur in parallel: calculating the page render tree, the corresponding layout, painting the elements, as well as requesting (possibly through new network requests) remaining resources.
Loading Time
The “Loading Time” metric corresponds to Page Load Time (PLT) that has been in use for years. It is sometimes still considered to be the primary performance metric that measures web services performance. It represents the time needed for a web page to be fully loaded.
The main phases that are part of a web page loading are shown hereunder:
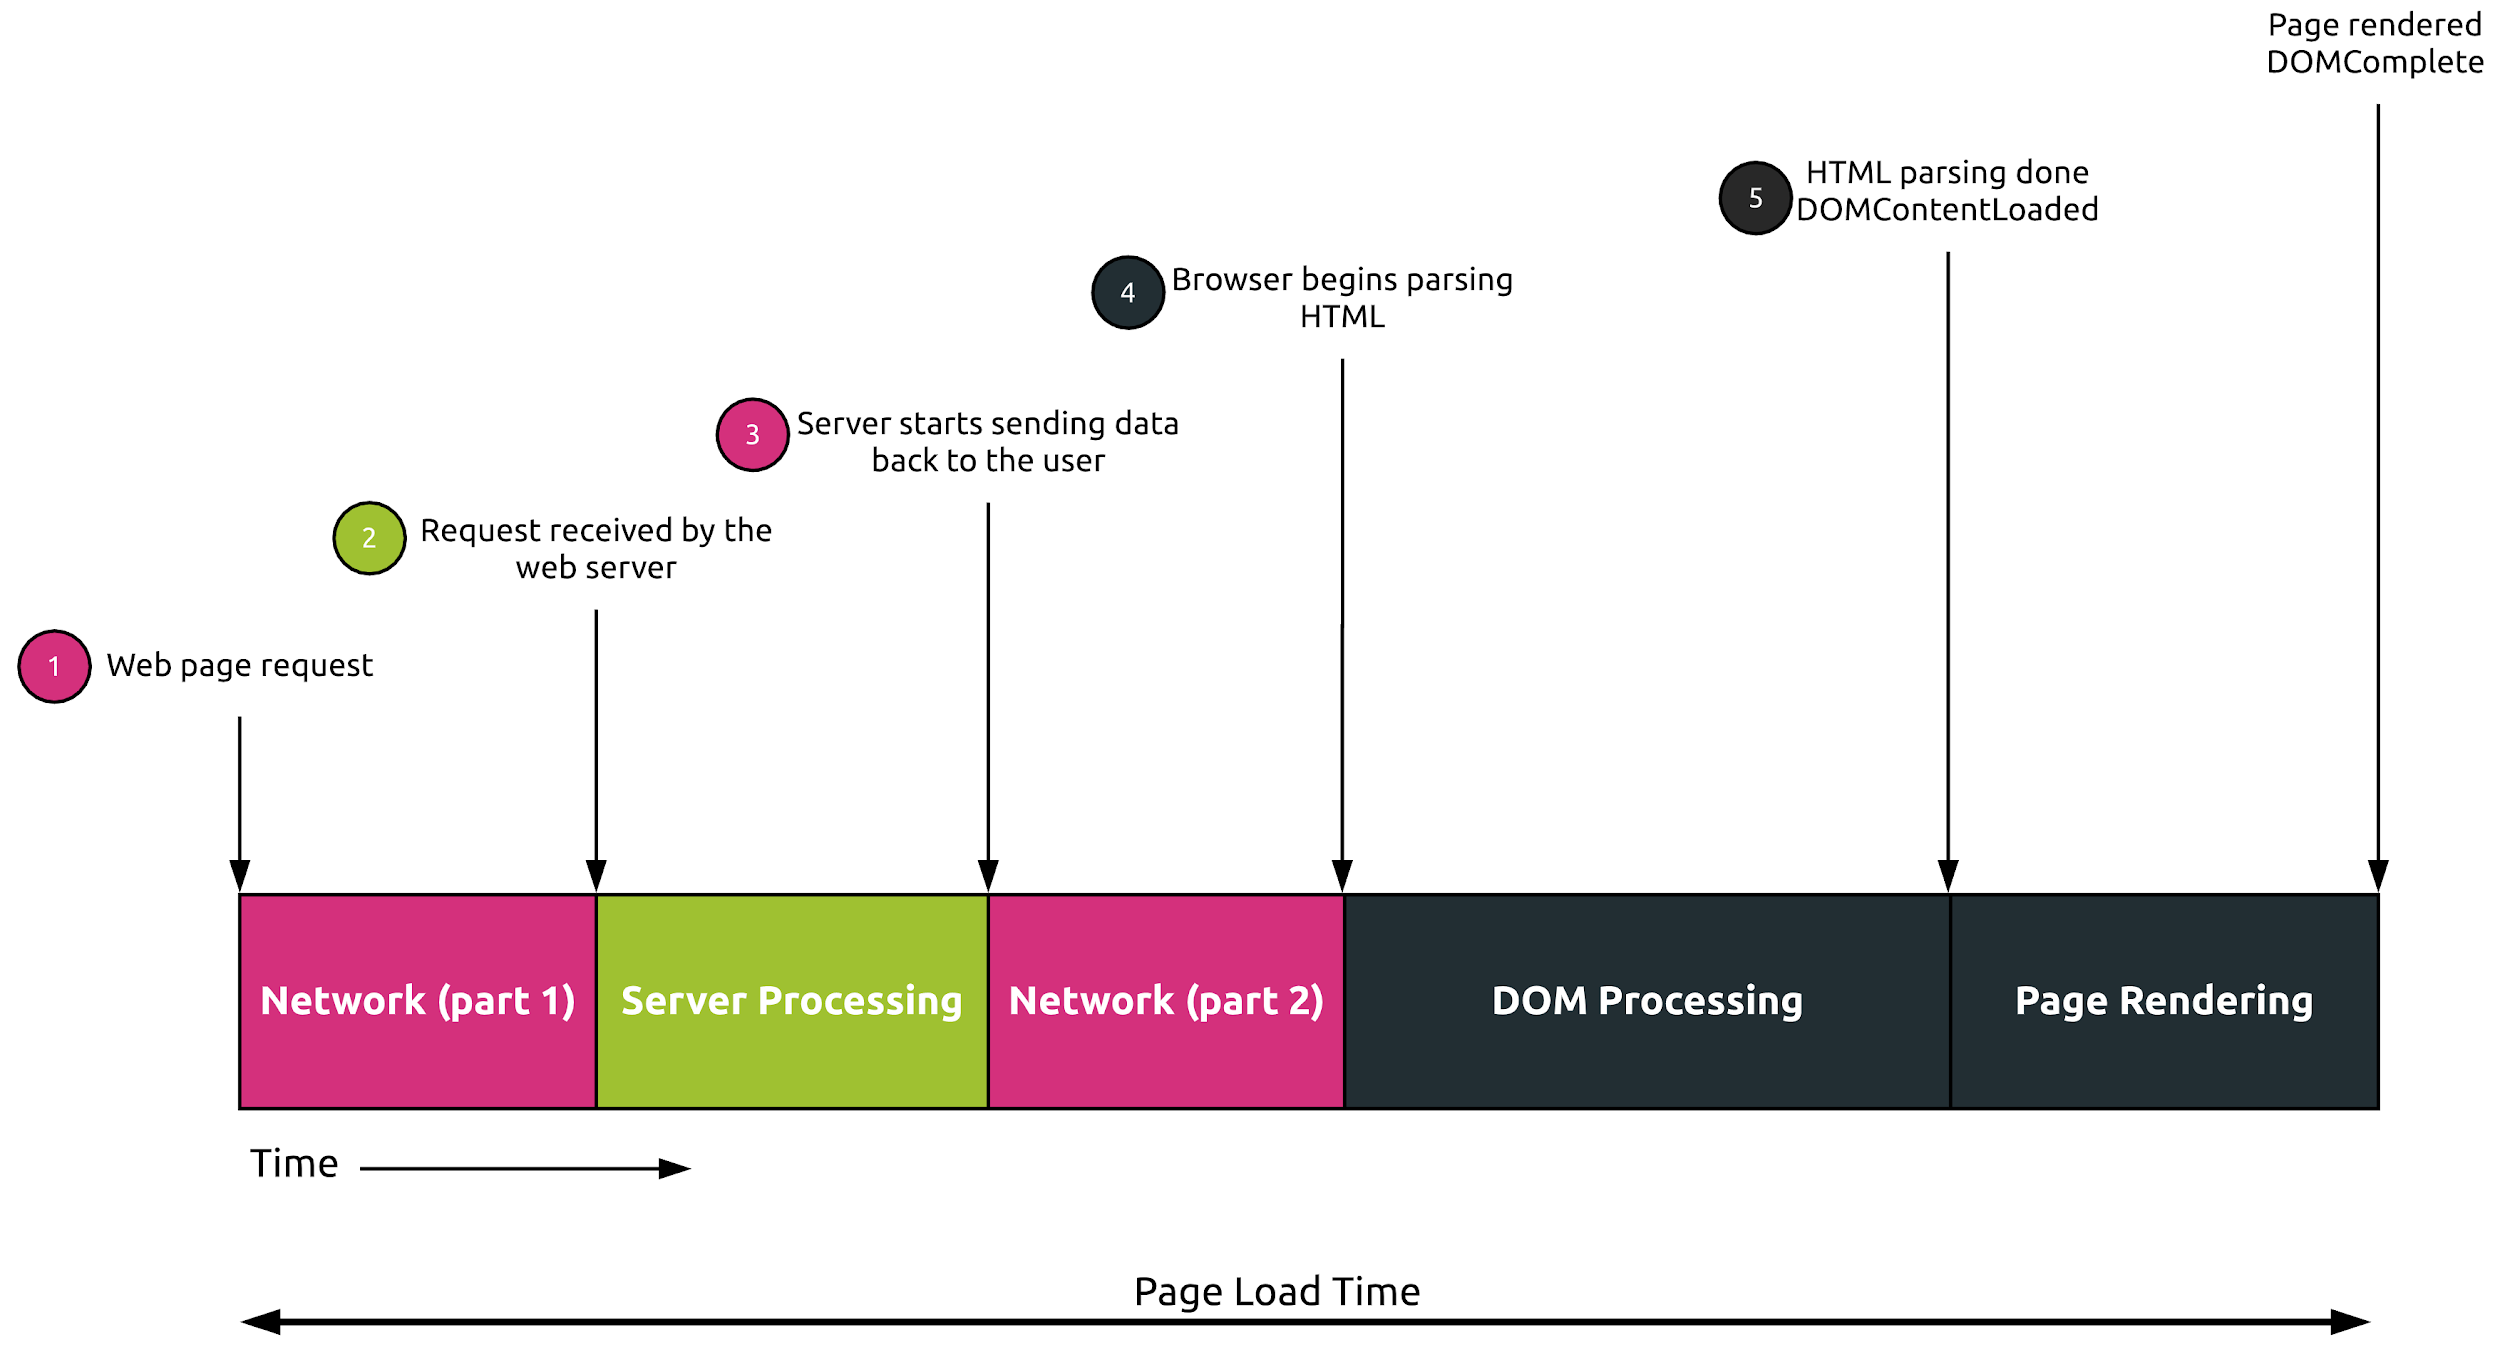
- The user clicks on a web page link or enters a valid URL The browser performs different steps like resolving the URL if not available in cache (DNS request) and establishing a TCP/TLS session with the server
- The server receives the request and processes it
- The server sends requested data to the user’s browser
- The browser starts parsing the HTML code and potentially requests additional resources (CSS, JS, …)
- All elements composing the web page are fully loaded. The browser can start rendering the page on the screen.
As you can see, the Loading Time is measured from the user’s request time up to the moment the web page is fully loaded and rendered on the screen. At this point, the browser’s spinner stops.
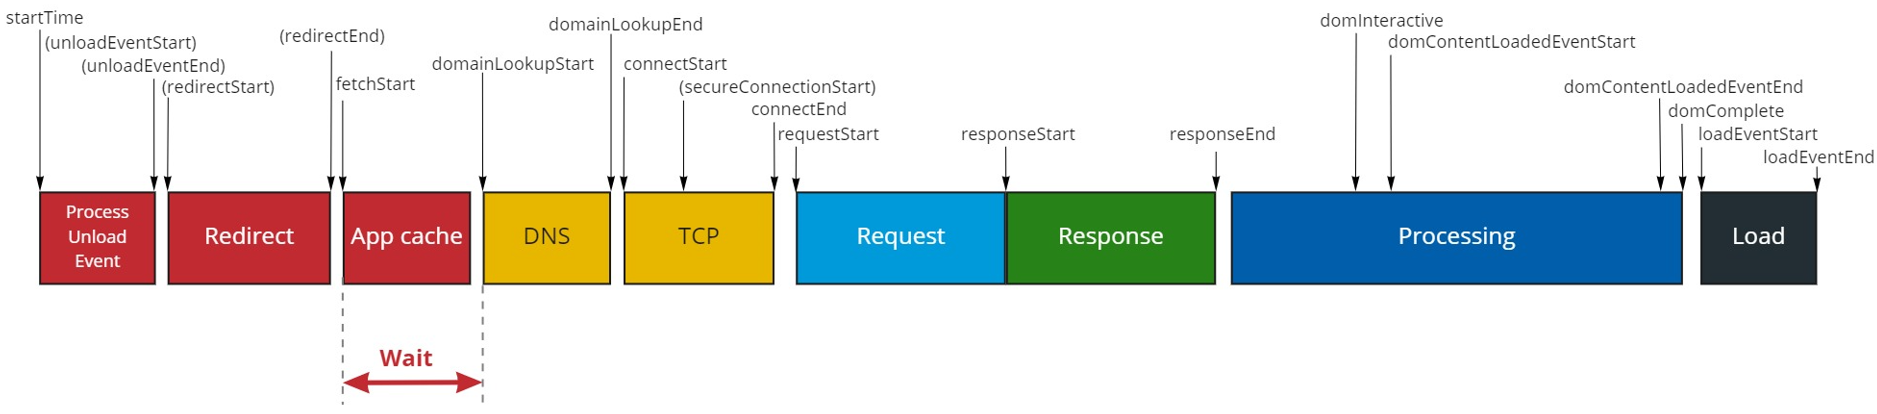
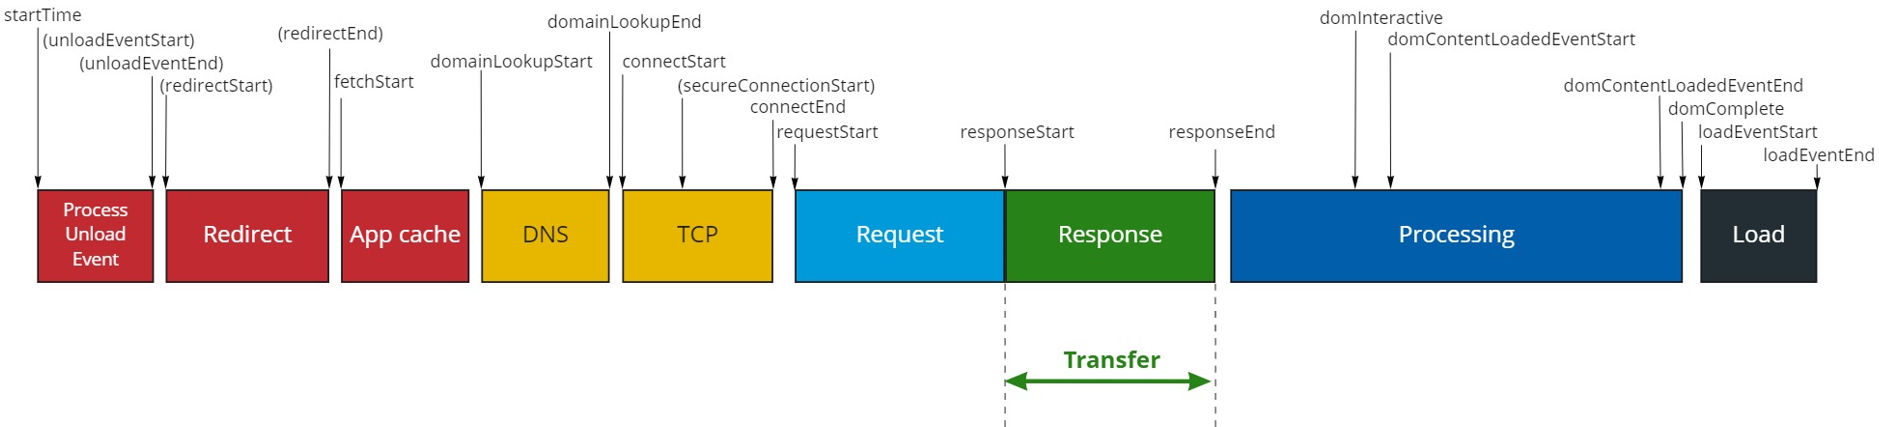
A more detailed view of the sequence of events is shown hereunder:
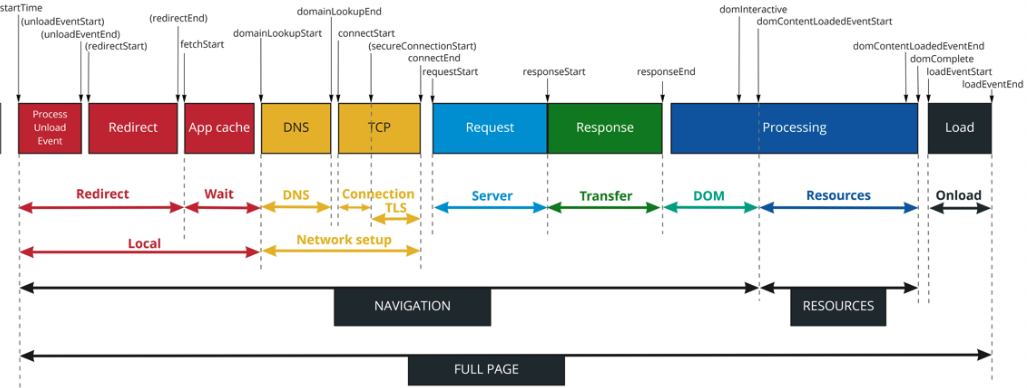
Our metrics computation is based on the Time Navigation API from W3C.
The Loading Time metric value calculation corresponds to loadEventEnd-startTime.
This calculates the time between the web page request by the browser (startTime) and the point in time all the components are fully loaded (loadEventEnd).
Redirect
HTTP redirections can impact your web services performance. Hence, important to monitor.
Let’s take the example of an HTTP session (http://www.netskope.com) redirection to the corresponding secure HTTPS session (https://www.netskope.com). From a timeframe standpoint, you see on the picture below that the first HTTP connection is fully embedded in the Redirect time of the HTTPS connection. It means that the initial HTTP session metrics (DNS, TCP, Server and Transfer) are not available as such. Their potential impact on performance is included in the Redirect time of the corresponding secure connection. The initial HTTP connection is not reported.
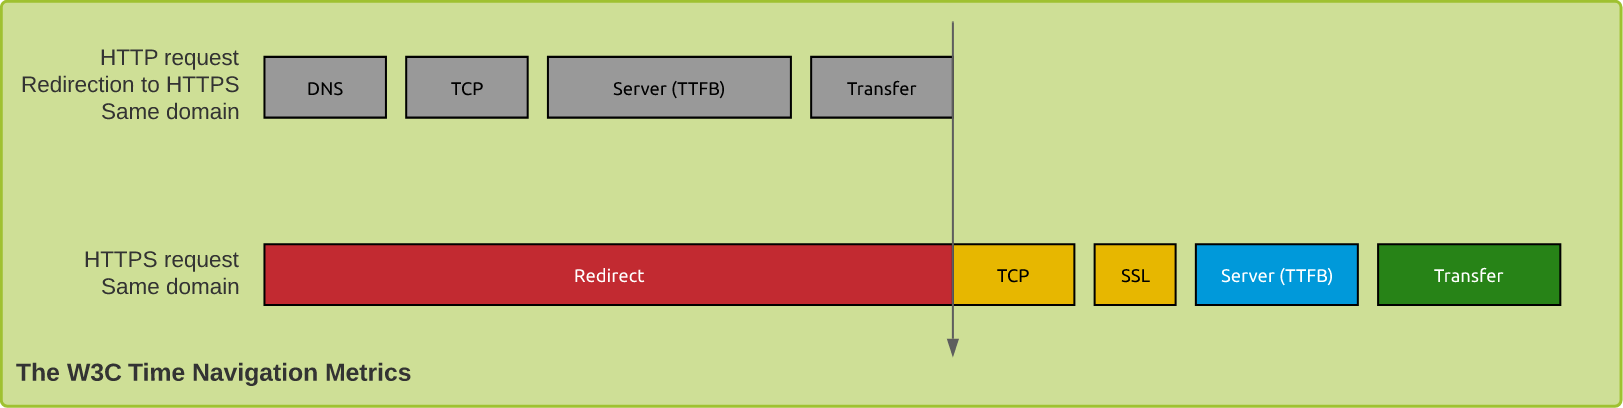
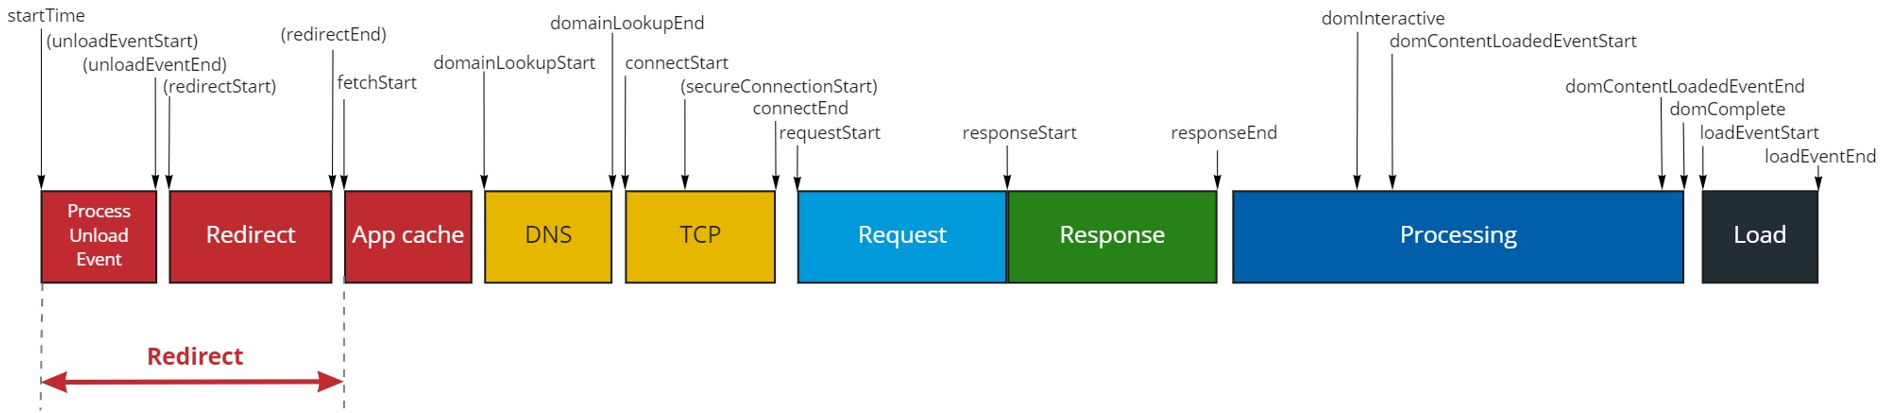
The time it takes for the browser to perform a redirection corresponds to the Netskope Redirect metric. As shown on the W3C Time Navigation API view hereunder, Redirect time = fetchStart – startTime.
Wait
The process of loading a web page can be split into the following main steps:
- The browser processes the request locally, checking for local cached data for example, before performing any network request
- If the resource is not available locally, it is requested on the network
- The server receives the request and processes it
- The requested data are transferred from the server to the browser through the network
- The web page is being rendered on the user’s browser
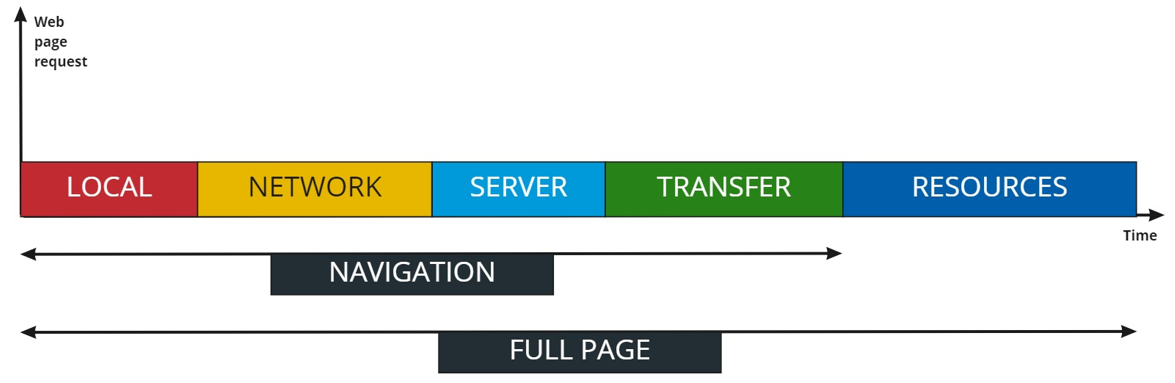
The Netskope Wait metric is part of the first step. When a browser has to fetch a resource, it performs two basic checks before launching any request on the network:
- The browser checks if the resource is available locally in its cache
- If the resource is not available locally, the browser checks whether it is allowed to fetch the resource
The duration of the second step is mainly dependent on the following:
- HTTP protocol used:
For example, in HTTP/1.1, most of the browsers cannot establish more than 6 concurrent TCP sessions to the same hostname/domain. When the browser reaches this limit, it has to wait for new available slots. - Higher priority requests:
The browser may have to wait for render-blocking JS or CSS to be fetched and executed first before being allowed to proceed with other operations - Allocating space in the disk cache:
During the brief disk cache space allocation process, the browser cannot perform any other task.
The time it takes for the browser to perform these basic checks corresponds to the Netskope Wait metric. As shown on the W3C Time Navigation API view hereunder, Wait time = domainLookupStart – fetchStart.
Network & Proxy Setup
The process of loading a web page can be split into the following main steps:
- The browser processes the request locally, checking for local cached data for example, before performing any network request
- If the resource is not available locally, it is requested on the network
- The server receives the request and processes it
- The requested data are transferred from the server to the browser through the network
- The web page is being rendered on the user’s browser
As shown on the W3C Time Navigation API view hereunder, the Network part includes the FQDN (Fully Qualified Domain Name) resolution process as well as TCP/TLS session establishment, so that “Network Setup = DNS time + Connection Time + TLS time“.
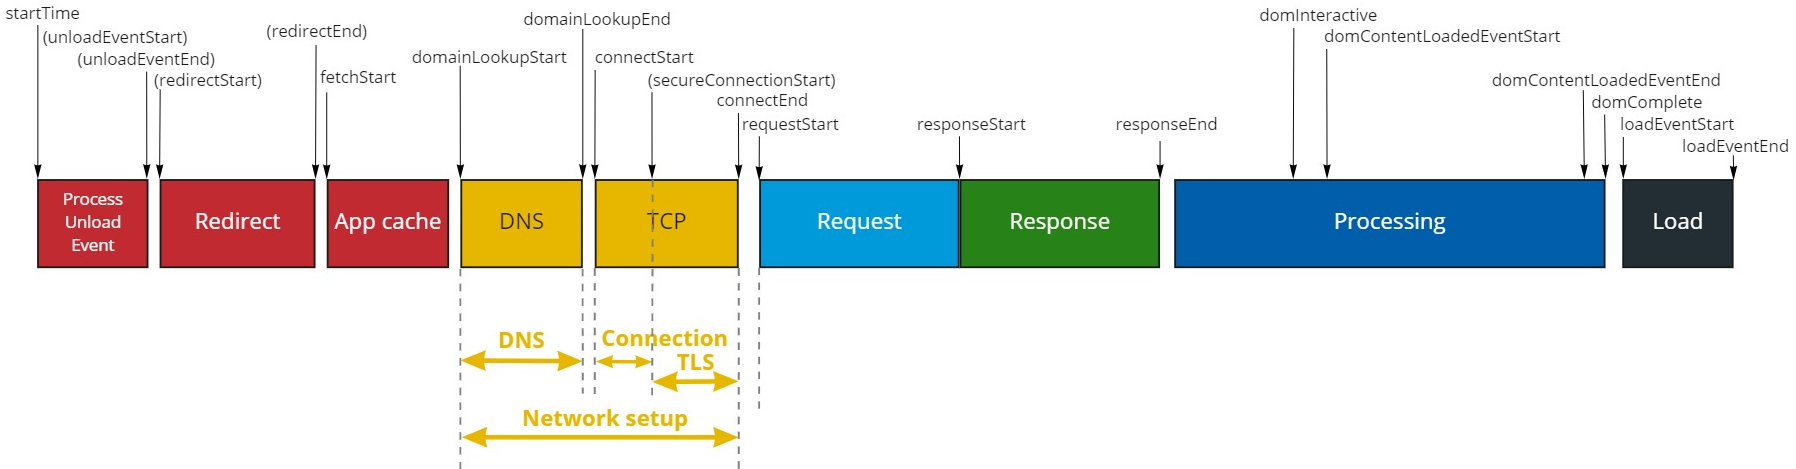
Network Setup time as a metric is present for both steered and bypassed traffic. In both scenarios the browser instance must establish a TCP session and negotiate TLS, the difference when steering traffic to Netskope is the browser builds a connection to the Netskope proxy service first and the proxy service then builds a connection to the target application for the browser after applying all relevant policies, hence you will then see a subsequent Proxy Setup time metric (which represents the TCP connection time and SSL negotiation time between the Netskope proxy service and the target web application). For bypassed traffic the Network Setup time represents the DNS, TCP connection, and SSL negotiation setup time directly to the application target, hence NO Proxy Setup time will be present.
Server Response Time
The process of loading a web page can be split into the following main steps:
- The browser processes the request locally, checking for local cached data for example, before performing any network request
- If the resource is not available locally, it is requested on the network
- The server receives the request and processes it
- The requested data are transferred from the server to the browser through the network
- The web page is being rendered on the user’s browser
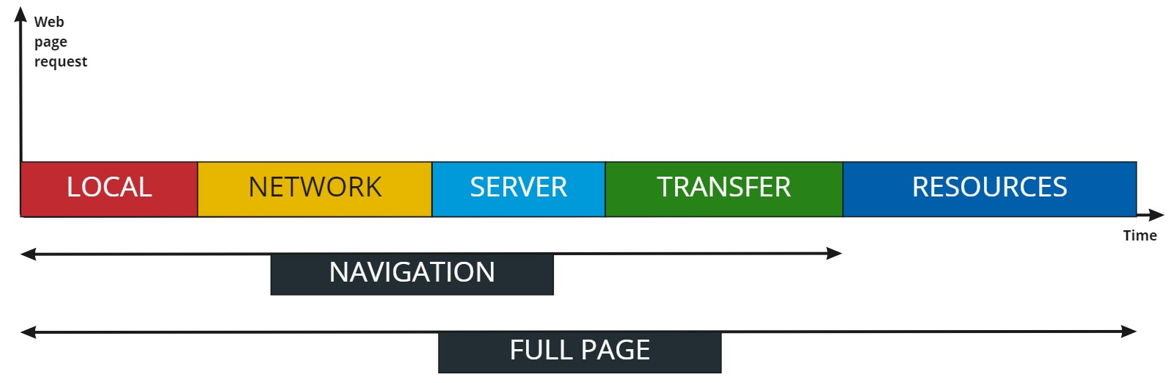
As shown on the W3C Time Navigation API view hereunder, Server time = responseStart – requestStart. It is equivalent to what is commonly called TTFB (Time To First Byte). Once the client has sent a web request to the server, the Server metric corresponds to the time it takes for the server to send the first packet (which includes the response status code) back to the client.
This is a very important performance metric as it directly relates to the server performance!
Data Transfer
The process of loading a web page can be split into the following main steps:
- The browser processes the request locally, checking for local cached data for example, before performing any network request
- If the resource is not available locally, it is requested on the network
- The server receives the request and processes it
- The requested data are transferred from the server to the browser through the network
- The web page is being rendered on the user’s browser
The Netskope Transfer metric corresponds to the fourth step. When a browser fetches a resource from a server, Transfer corresponds to the time it takes for the server to send the resource back to the browser once it has computed the request (the server has sent the status code 200 back to the browser). This metric is directly driven by the size of the resource to load as well as network conditions (latency and packet loss).
As shown on the W3C Time Navigation API view hereunder, Transfer time = responseEnd – responseStart.
Errors
When a browser requests a webpage and related web resources (JavaScripts, images, stylesheets, …), it sends HTTP requests to the different servers on which these resources reside. A request to a web resource is called a “Page Load” or “Request”. There may be many “Page Load” or “Request” per page view since an HTML page can contain multiple files.
For each “Page Load” or “Request”, the browser sends an HTTP request to the server, which responds back with an HTTP response. The HTTP response header contains a status code, which indicates whether the HTTP request has been successfully completed. Responses are grouped in five classes:
- Informational responses (100 to 199)
- Successful responses (200 to 299)
- Redirects (300 to 399)
- Client errors (400 to 499)
- Server errors (500 to 599)
As you can see, all status codes below 400 are related to successful requests. The main client errors you may encounter are the following:
| Status Code | Description |
|---|---|
| 400 – Bad Request | The server could not understand the request due to invalid syntax |
| 401 – Unauthorized | Although the HTTP standard specifies “unauthorized”, semantically this response means “unauthenticated”. That is, the client must authenticate itself to get the requested response. |
| 403 – Forbidden | The client does not have access rights to the content; that is, it is unauthorized, so the server is refusing to give the requested resource. Unlike 401, the client’s identity is known to the server. |
| 404 – Not Found | The server cannot find the requested resource |
The common server errors you may encounter are the following:
| Status Code | Description |
|---|---|
| 500 – Internal Server Error | The server has encountered a situation it doesn’t know how to handle |
| 502 – Bad Gateway | This error response means that the server, while working as a gateway to get a response needed to handle the request, got an invalid response. |
| 503 – Service Unavailable | The server is not ready to handle the request. Common causes are a server that is down for maintenance or that is overloaded. |
| 504 – Gateway Timeout | This error response is given when the server is acting as a gateway and cannot get a response in time. |
| 505 – HTTP Version Not Supported | The HTTP version used in the request is not supported by the server. |
The number of “Page Load” or “Request” with errors reported by Netskope corresponds to all HTTP requests for which the HTTP response status codes are above 399 as well as all resources fetch processes that fail without the server responding to the client at all.
CORS
CORS is a mechanism that allows a server to indicate any other origins than its own from which a browser should permit loading of resources.
As explained in detail in the article “What is the impact of CORS on performance monitoring”, CORS significantly influences how W3C Time Navigation API metrics are being reported.

When requesting cross-origin resources, from all metrics shown on the figure above, only the following attributes are being correctly reported:
- startTime
- fetchStart
- responseEnd
- duration
Furthermore, cross-origin resources that are redirected will have a startTime that only reflects the final resource — startTime will equal fetchStart instead of redirectStart. This means the time of any redirect(s) will be hidden from the resource timing.
As stated above, despite the limitations that CORS introduces, we are still able to calculate the whole duration of a resource fetch.
Concretely, this means that you can easily identify resources that significantly impact overall application performance.