

The Netskope One DEM Data Intelligence Agent offers a natural language based conversational interface built into Netskope Digital Experience Management (DEM). Instead of building queries or navigating multiple dashboards, you ask questions in plain English, such as “Which applications are slow?”, and the agent analyzes and processed your organization’s DEM data and granular telemetry, and then responds with a written summary, key findings, actionable insights, and the supporting data.
The agent draws on the same telemetry that powers the rest of DEM, including real user transaction measurements, synthetic probe results, and the experience scores DEM computes for users, devices, networks, and applications. This makes it a fast way to triage user experience complaints, identify the root causes of performance degradation, and reduce mean time to detect (MTTD) and mean time to resolve (MTTR).
The Data Intelligence Agent is part of the Insights, User Overview, and Sites/Applications pages of the Advanced Diagnostics section in Digital Experience Management, and access follows the permissions of that page. To review or manage admin roles in the Netskope tenant, go to Settings > Administration > Roles.
Key Capabilities
With the Data Intelligence Agent, you can investigate digital experience across several dimensions of your environment in a single conversation:
- Application Performance: Identify slow applications, rank them by latency, and surface applications with elevated error rates, including how those rates trend over time.
- User Experience: Find users with poor or degraded experience scores, and track how scores change week over week.
- Device Health: Highlight device-related errors affecting user experience and correlate device health with device scores.
- Network and Site Analysis: Compare network performance across sites, countries, and ISPs, and analyze which Netskope points of presence (POPs) perform best for specific applications.
- Root Cause Correlation: Correlate signals across applications, networks, and devices to point you toward a likely root cause.
Every answer combines a natural language narrative with the underlying data. Each response ends with suggested next steps and follow-up questions, so you can keep drilling down without starting over.
Prerequisites
To use the Data Intelligence Agent, you need:
- A Netskope tenant with Digital Experience Management enabled.
- The appropriate DEM licensing for your organization. The Data Intelligence Agent is available with specific DEM subscription tiers: DEM Enterprise Starter and DEM Enterprise. Contact your Netskope account team if you do not see it in your tenant.
- The Netskope Client, DEM Browser Extension, or DEM Enterprise Stations deployed and active on user devices or hosts, with DEM data collection configured for your organization. Meaningful answers depend on data being collected.
- An admin account with sufficient privileges to view the Digital Experience Management section of the Netskope tenant.
Accessing the Data Intelligence Agent
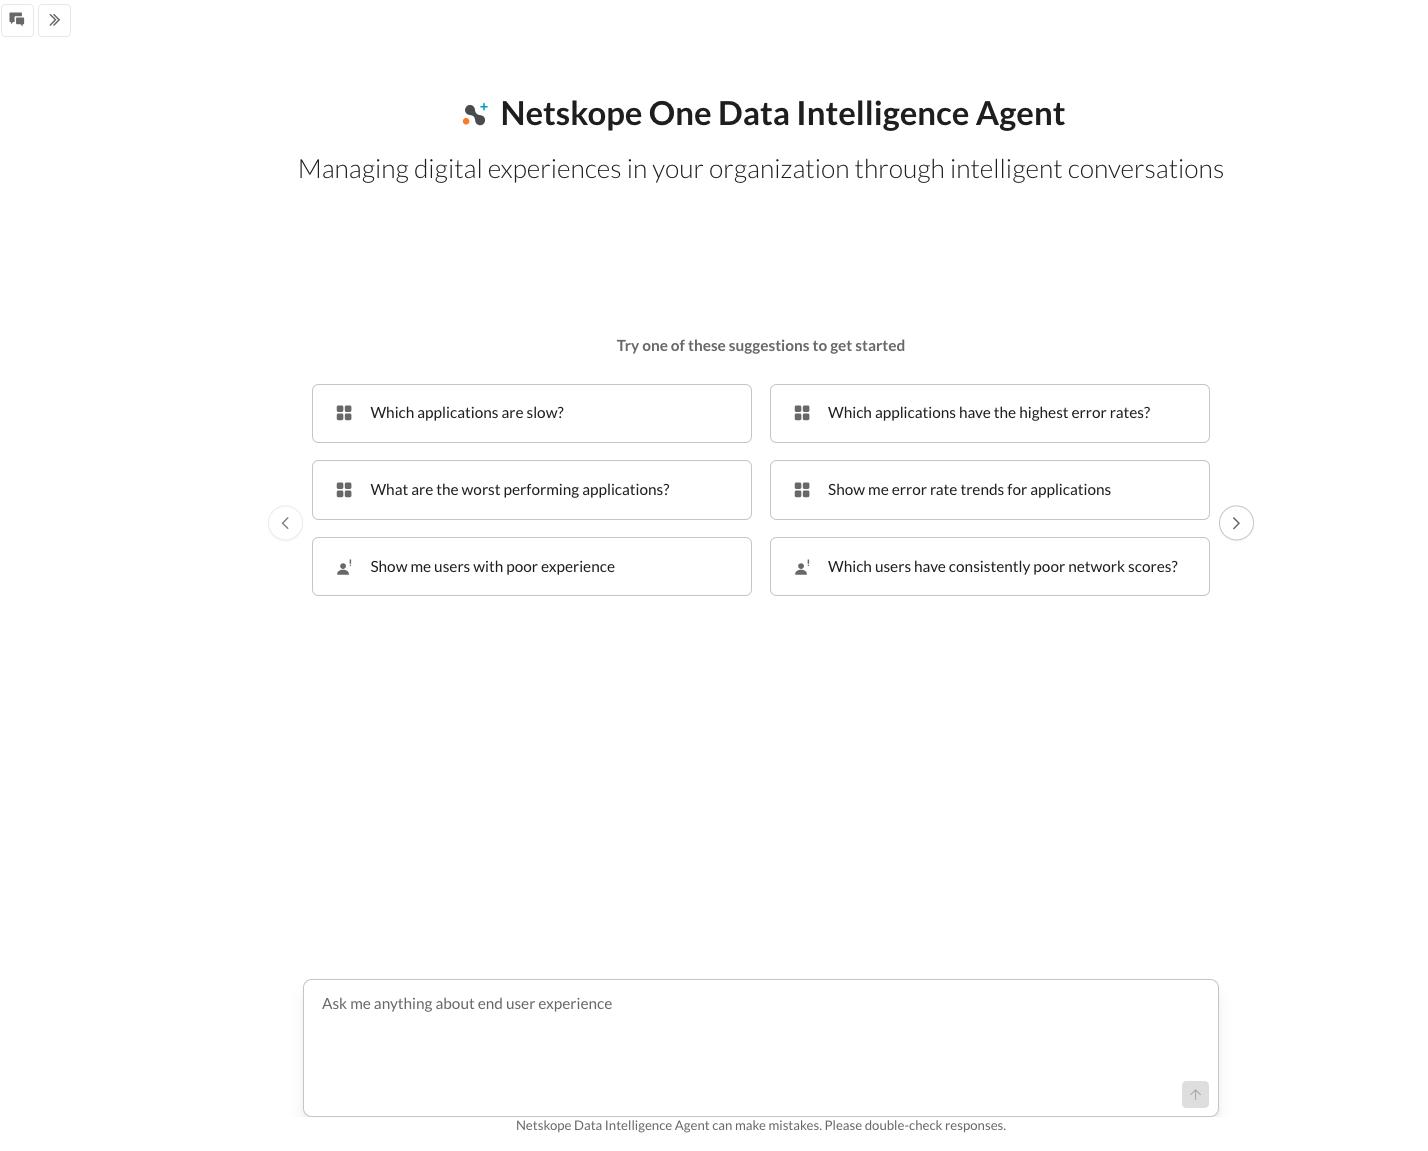
Go to Digital Experience Management > Insights / User Overview / Sites / Applications. The Data Intelligence Agent opens as a conversational workspace with a prompt box at the bottom of the page (“Ask me anything about end user experience”) and a carousel of suggested questions to get you started.
Asking Your First Question
You can start in either of two ways:
- Click one of the suggested question chips. The suggestions cover applications, users, devices, networks, and sites.
- Type your own question in the prompt box and press Enter. Questions are free-form natural language; no query syntax is required.
While the agent works, it displays an “Analyzing data…” indicator. Supporting data tables often appear first, followed by the full written analysis. A Stop button lets you cancel a response that is still being generated. Answers typically arrive in well under a minute.
Unless you specify otherwise, the agent analyzes recent data (for example, the last 24 hours). You can name your own time window in the question itself, for instance, “Show me devices having very poor performance over the last 7 days”.
Example Prompts
The following examples, drawn from the agent’s built-in suggestions, illustrate the kinds of questions it can answer.
Applications
- Which applications are slow?
- Which applications have the highest error rates?
- Show me applications with performance degradation over time.
- Show me error rate trends for applications.
- Show me the trend of application latency for specific apps.
Users
- Show me users with poor experience.
- Show me users with composite scores below 50.
- What percentage of users have excellent experience scores above 90?
- Show me users whose scores improved over the last week.
Devices
- What are the device-related errors affecting user experience?
- Show me devices having very poor performance over the last 24 hours.
- Show me correlation between device health and device scores.
Networks and Sites
- Users at which sites are experiencing the most issues over the last 24 hours?
- Show me network latency metrics.
- Compare network performance for users in different countries.
- Which ISPs are used by the most users?
- Which POPs have the best performance for specific applications?
Trends and Distribution
- Show me geographic distribution trends of users.
- Show me application performance metrics.
- Which applications have both transaction and probe data available?
Understanding Responses
Responses follow a consistent structure designed to take you from the headline to the root cause quickly:
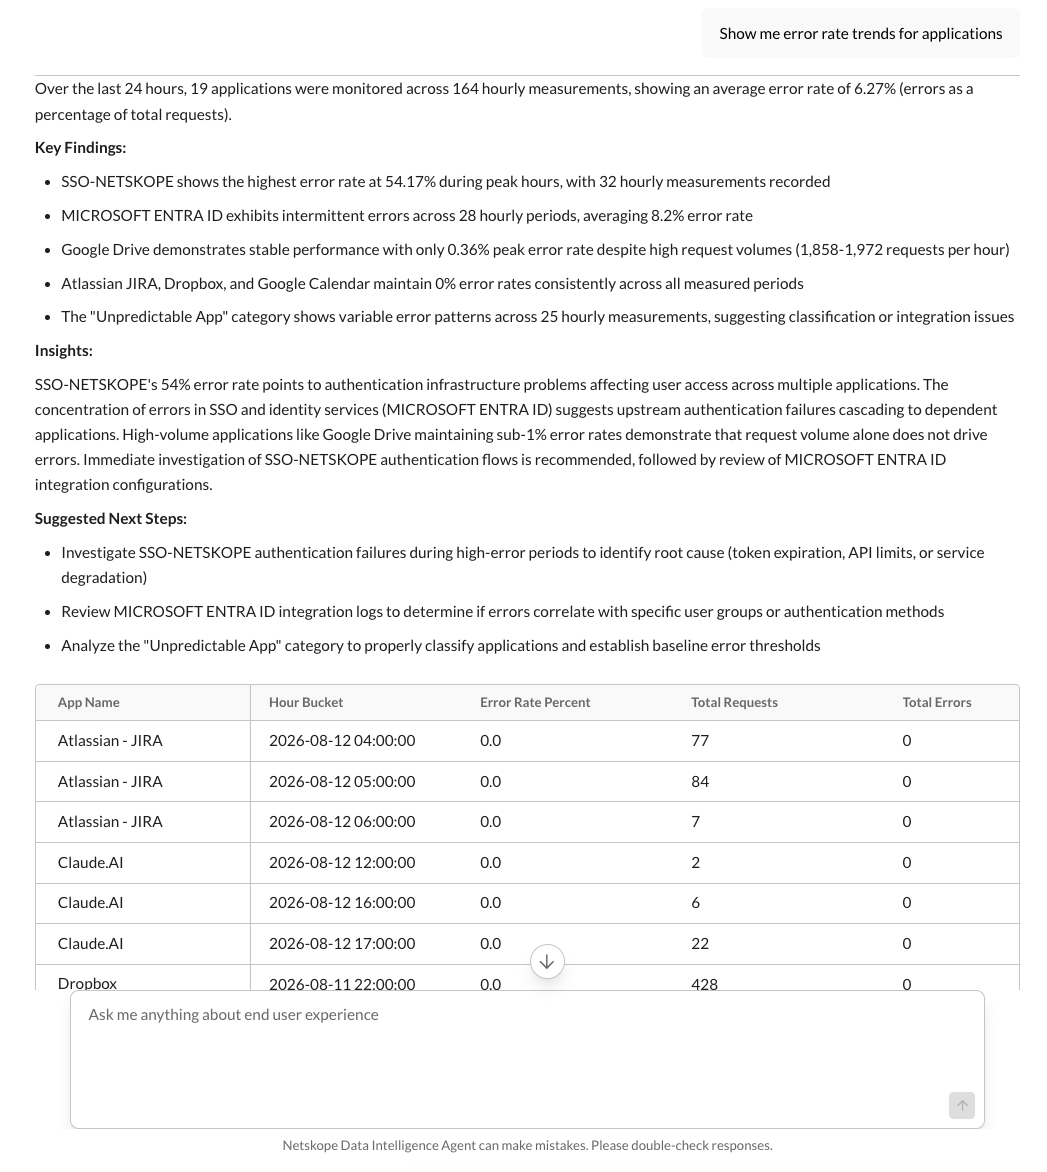
- Summary: A one-paragraph answer to your question, including the time range analyzed and the scope of data used (for example, real user transactions and synthetic probes).
- Key Findings: The most important facts pulled from the data, such as top offenders, notable outliers, and how widespread an issue is.
- Insights: The agent’s interpretation of what the data means: whether an issue looks isolated or systemic, what the likely cause is, and what deserves priority.
- Suggested Next Steps: Concrete follow-up actions, such as investigating a specific user’s network path, or expanding the time range to check whether an issue is persistent.
- Data table: The supporting records behind the analysis (for example, application name, average latency, and affected users). Tables are paginated, and you can change the number of rows shown per page.
- Follow-up questions: Clickable, context-aware suggestions for continuing the investigation. Click View More to see additional suggestions.
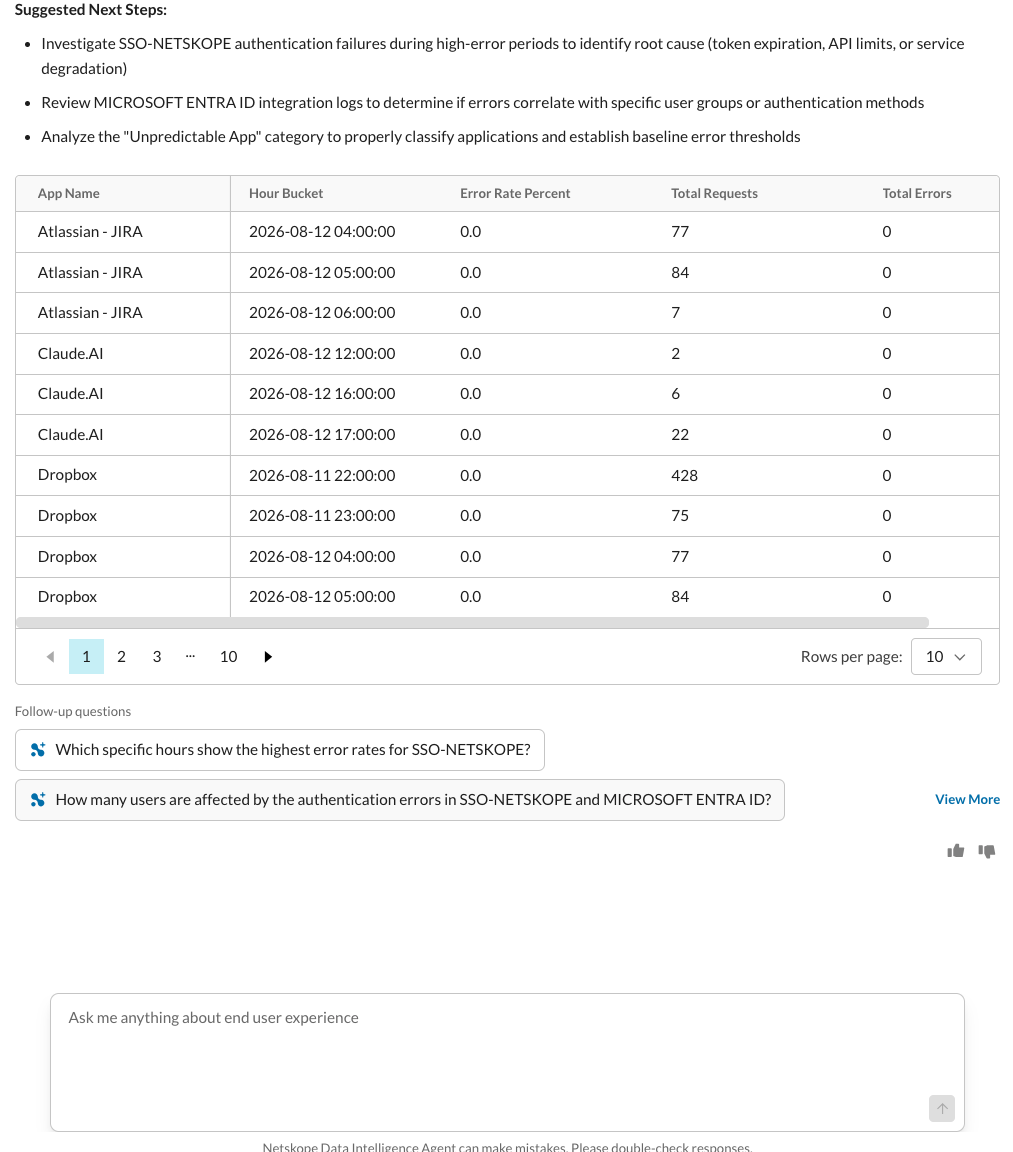
Each response also includes thumbs-up and thumbs-down buttons. Using them helps improve answer quality over time.
Managing Conversations
Conversations are persistent. Use the two controls at the top left of the workspace to manage them:
- New: Starts a fresh conversation.
- Show conversations: Opens a searchable history panel, grouped by date, from which you can reopen any previous conversation. Start a new conversation when you switch to an unrelated investigation. This keeps each conversation’s context clean and your history easy to search.
Best Practices
Be specific about scope and time. Naming the application, user, site, or time window you care about (“Show me the trend of application latency for Microsoft Teams over the last 7 days”) produces sharper answers than a broad question. Follow the thread with the suggested chips. The follow-up questions at the end of each response are generated from your actual data and phrased as complete questions. They usually point at the fastest route to the root cause, like, from a slow application to the network and device scores of the users affected by it.
Phrase follow-ups as complete questions. Short fragments that rely on the previous answer for meaning (such as “What about over the last 7 days?”) can be misinterpreted. Restate the subject instead: “Which applications have the highest error rates over the last 7 days?”
Widen the window to test persistence. If something looks wrong in the last 24 hours, ask again over 7 days to distinguish a one-off incident from an ongoing problem.
Verify before acting. As with any AI assistant, double-check important findings against the underlying data table in the response or the corresponding DEM dashboards before making changes in your environment.
Data Privacy and AI Usage
The DEM Data Intelligence Agent uses large language models to support conversational interaction with your organization’s DEM telemetry and metrics. Per Netskope’s published AI governance documentation, customer data is not logged by the third-party model provider and is not used to train their models. AI/ML use in Netskope products is overseen by Netskope’s internal AI Governance Committee. For details, see AI/ML Usage and Governance in Netskope Products.
Limitations
Answers are only as good as the telemetry available. If the Netskope Client is not deployed, or data collection is not configured, the agent will tell you that no user experience data is available and suggest how to fix it, rather than returning results.
The agent is scoped to digital experience data. It answers questions about end-user experience, application performance, and network health, not general questions or other product areas.
Note
The DEM Data Intelligence Agent can make mistakes. Double-check responses before acting on them.
Frequently Asked Questions
Do I need to know a query language?
No. Questions are plain natural language. Suggested prompts and follow-up questions mean you can often complete an entire investigation without typing at all.
What data does the agent analyze?
DEM telemetry from your own tenant: real user transaction measurements, synthetic probe results, and the experience scores DEM computes for users, devices, networks, and applications.
What time range do answers cover?
By default, the agent analyzes recent data (typically the last 24 hours). Specify a different window in your question, for example, “over the last week”, to change the range.
Are my conversations saved?
Yes. Use Show Conversations to browse and search your conversation history, and use New to start a fresh one.
Why does the agent say no data is available?
This usually means DEM has not collected telemetry for the requested scope and time range. For example, the Netskope Client is not installed or active on user devices, or data collection has not been configured. The agent’s response will include suggested steps to resolve it.
Can the agent change my configuration?
No. The DEM Data Intelligence Agent is a read-only analysis assistant. It surfaces findings and recommendations; any changes to your environment are yours to make through the normal admin workflows.