

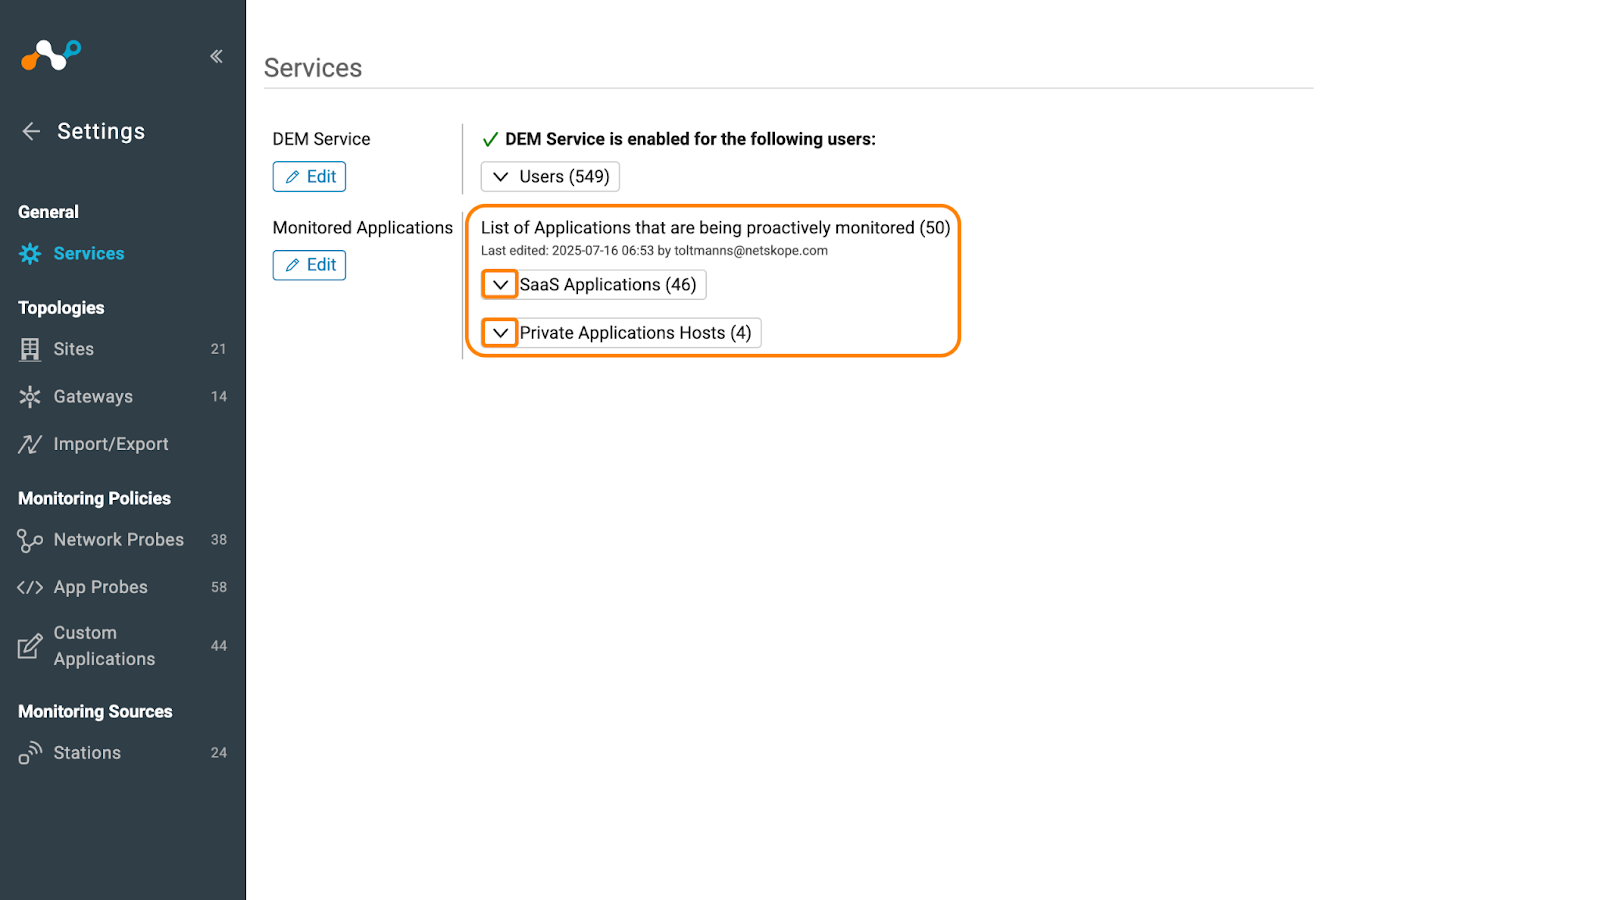
The Digital Experience Management (DEM) Enterprise “Settings” page allows you to configure and view DEM settings. The “General” section of the “Settings” page includes lists of users who have the DEM Service enabled and lists of SaaS applications and private applications hosts that are being proactively monitored. This section also includes tools that allow you to edit which users have the DEM Service enabled and to select the applications that you want to monitor.
Permissions
Two permissions are dedicated to the DEM Enterprise configuration and data visualization. These are found in the “Digital Experience Management” tab of the Administrative roles.
The “Settings” page permissions section is used to allow the user accessing the configuration part of the DEM Enterprise service and monitored items (DEM Enterprise service scope, Enterprise Stations, Sites/Gateways, Network/App Probes, Applications):
- “View” permission allows users to view the different configurations
- “Manage” permission allows users to manage all configurations (view/edit)
The “Advanced Diagnostics” permission is used to control who to grant access to for the data visualization (dashboards).
The “View” and “Manage” permissions settings for the “Advanced Diagnostics” field will have the same effect. These are used to grant access to users to collected performance metrics (dashboards).
Services
DEM Service
By default, when the DEM service is activated, it is applied to all NSClients and Enterprise Stations deployed from your tenant.
- The complete DEM service can be enabled or disabled. When disabled, the DEM service is deactivated for both NSClients and Enterprise Stations.
- You can select the NSClients you want to monitor by using inclusion criteria. You can select specific users, user groups, organization units, operating systems and devices based on their classification.
- In addition to inclusion criteria, you can fine tune the monitoring scope by adding exclusion criteria. Exclusions can be configured per users, user groups, organization units, operating systems and devices based on their classification. For example, you can include all users within a specific user group, then exclude all machines running on Windows operating system from this monitoring scope.
- You can also deactivate specific Enterprise Stations from the monitoring scope. Just select the Enterprise Station(s) you want to deactivate from the corresponding dropdown list.
- To save your service setting selections, click the Apply button.
Monitored Applications
The “Monitored Applications” section of the Services configuration main menu lets you select the applications for which you can collect RUM (Real User Monitoring) data, that is performance metrics based on real users traffic.
Your monitored applications are grouped into two categories:
- SaaS Applications
- Private Applications Hosts
How to View Monitored Applications
You can view your currently monitored applications by clicking on the dropdown carrots next to SaaS Applications and Private Applications Hosts.
How to Edit Monitored Applications
By default, all SaaS applications are monitored. You can change this to include Private Applications based on your use case.
You change your selected monitored applications by doing the following:
- Click the Edit button beneath Monitored Applications.
- The Monitored Applications window will open and display a list showing 50 SaaS applications that are selected by default and 500 private applications/hosts.
- You can use the search field to narrow down the list and click the View All button to select to view a list of only SaaS Applications or Private Applications Hosts.
- To make your selections check or uncheck the boxes next to the associated applications/hosts.
- To save your changes, click the Apply button.
Configuring Private Applications with Publisher DNS Enabled
When configuring monitoring for private applications with Publisher DNS enabled, select only the FQDN. You do not need to select resolved IP addresses shown in the list —DEM will automatically monitor all resolved IPs by default. DNS traffic performance will be shown against the FQDN while user traffic performance will be shown against the resolved IP addresses on the user details page.