

Netskope Digital Experience Management (DEM) reduces a user’s digital experience to a single number from 0 to 100. This article explains what that number represents, which metrics each part of it is built from, how measurement differs between the Netskope Client and the Browser Extension, and how to act on a score when you are troubleshooting.
Related Article
This article covers how scores are calculated. For the specific conditions a contribution needs in order to be produced at all, and what to check when a score is unavailable, see Understanding Digital Experience Management (DEM) Scores. These two articles are designed to be used together.
What the Experience Score is
The DEM user experience score answers one question: how good is this user’s digital experience right now? It is expressed as a number from 0 to 100, where 100 is excellent and 0 is unusable.
The score is calculated per user, in five-minute windows. Each window is scored independently from the measurements collected during it, so the score tracks a user’s experience through the day rather than flattening it into a daily average.
To make the number actionable at a glance, every score falls into one of these bands:
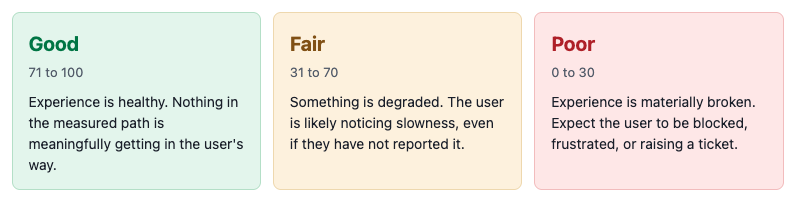
Band boundaries are inclusive of the values shown. A score of exactly 71 is Good, and a score of exactly 31 is Fair. If you are writing alert expressions, use 71 and above for Good, and 30 and below for Poor.
Longer Time Ranges Average the Windows
When you view a score over a period longer than five minutes, the number shown is the average of the five-minute window in that range. A sharp fifteen-minute incident inside an eight-hour view is diluted to near invisibility. If a user reports a problem you cannot see, narrow the time range until the individual windows are visible before concluding the score contradicts with them.
The bands matter more than the exact digits. A score moving from 78 to 74 is noise. A score moving from 74 to 62 has crossed from Good into Fair and is worth investigating. Treat the score as a triage signal that tells you where to look, rather than as a service-level measurement in its own right.
The Four Contributions
A single number is only useful if you can decompose it. The headline score is built from four contributions, each covering a different part of the path between the user and the object they are trying to use.
Use devicelaptop / desktopNetskope POPpoint of presenceSaaS & customapplicationsPrivate appsvia publisherDeviceOn-Rampdevice to POPSaaS / Custom AppPrivate App when using Netskope Private Access.
Each contribution is responsible for a different segment of the path. A given session is scored on either SaaS / Custom App or Private App, depending on what the user is reaching, so a user working only in private applications will not show a SaaS / Custom App contribution for that traffic.
| Contribution | The Question it Answers |
|---|---|
| Device | Is the endpoint itself getting in the user’s way? Covers how much of the machine’s capacity remains available for the work the user is doing. |
| On-Ramp | Is the path from the device to the Netskope point of presence healthy? This is the segment your network team can most directly influence, covering the local network, the ISP link, and the route to the POP. |
| SaaS / Custom App | Is the path onward from the POP to the application performing, and does the application respond well once reached? |
| Private App | For private applications reached through Netskope Private Access, is the path through Netskope infrastructure to the Publisher healthy? |
Each contribution is scored 0 to 100 on the same scale and banded the same way. A contribution is only scored when the measurements it needs were actually collected in that window, and the composite requires more than one contribution before it can be produced. The exact requirements for each are documented in Understanding Digital Experience Management (DEM) Scores.
The Two Ways of Measuring: Active and Passive
Before looking at individual metrics, it helps to understand that DEM gathers data in two fundamentally different ways: Netskope Client and Browser Extension. This difference explains most of the variation you will see between sources, and it is the reason the same user can produce measurements that do not look alike.
| Factor | Netskope Client | Browser Extension |
|---|---|---|
| Measurement model | Active. The Client generates its own measurements on a schedule, sending network path probes and, where configured, application probes. | Passive. The extension observes what really happened during the user’s own browsing and reports the browser’s own performance timings. |
| When data appears | On a regular cadence, whether or not the user is doing anything. | Only when the user actually loads pages or the application makes requests. |
| What it reflects | The condition of the path and the endpoint, measured directly. | What the user genuinely experienced, including the application’s own rendering behavior. |
| Scope | The whole device and all steered traffic, including private applications. | Recognized web applications in supported browsers only. |
| Main limitation | Measures the path rather than the user’s perception. It cannot see how long a page took to render. | Goes quiet when the user is idle, and can see far less of the device than the Client can. |
Neither model is a substitute for the other. Active measurement tells you the path was healthy at 3 a.m. when nobody was working. Passive measurement tells you the page took nine seconds to appear even though every network measurement looked fine. Running both gives you the fullest picture.
What Each Contribution Measures
The sections below list the signals behind each contribution and note how the two sources differ. Where a source is not listed for a contribution, it does not feed that contribution.
Device
Netskope Client
Reads operating-system telemetry directly from the endpoint on a schedule, so it produces data continuously regardless of user activity. The signals it scores are:
- Processor Headroom: How much processing capacity remains unused across the device’s cores.
- Available Memory: Memory still available to applications, judged against the device’s installed memory.
- Available Disk Space: Free capacity on the system volume.
- Wireless Signal Strength: The quality of the device’s wireless link, where the endpoint reports it.
The Client also collects additional endpoint telemetry, including disk and network throughput and battery level, which is available for investigation but does not currently drive the Device score.
Browser Extension
Reads only what the browser makes available to it, sampled while the browser is open. The signals it scores are:
- Processor Utilization: Judged against the number of logical processors the browser reports.
- Free System Memory: Judged against the device’s total memory.
The extension has no visibility of disk capacity, wireless signal strength, thermal state, or memory paging. It also reports battery level, which is available for context but is not scored. An extension-based Device score is therefore a narrower view than a Client-based one, and a device with a full disk or a weak wireless link can look healthy to the extension.
On-Ramp
Netskope Client
Actively probes the network path from the device to the Netskope POP on a schedule and measures round-trip time along it. Because these are generated measurements rather than observations of user traffic, they continue during idle periods. Path probing depends on intermediate networks responding to probe traffic, so networks that drop or deprioritise ICMP and UDP can prevent this data being produced.
Browser Extension
Derives its view of this segment from the browser’s own timing data for real requests, principally:
- TCP connection time. How long establishing the connection took.
- TLS handshake time. How long securing the connection took.
This is connection setup timing observed from real traffic rather than a probe of the path, so it only exists when the user is active, and it reflects the specific destinations the user happened to reach.
SaaS / Custom App
Netskope Client
Measures the path onward from the POP to the application, using round-trip time from the POP to the application. Where application probes are configured in your DEM settings, scheduled HTTPS tests to those targets also contribute to this measurement, which is what allows the contribution to keep reporting outside working hours. Application probes additionally break the request down into DNS resolution, connection setup, TLS handshake, time to first byte, and content transfer, which is available when you drill in.
Browser Extension
Measures what the browser actually experienced. The primary signal depends on the application type:
- Traditional multi-page applications: Scored on Largest Contentful Paint, the time until the main content of the page has appeared. This is the closest available proxy for “the page is ready to use”.
- Single-page applications: Scored on the duration of the application’s own requests, meaning the fetch, XHR, and beacon calls the application as the user works. These scores are calculated by ranking a session against other sessions in your tenant over a rolling three-day window, so an individual score can move when the rest of your population moves.
The extension collects a considerably wider set of timings that are available for diagnosis without directly driving the score, including DNS resolution, time to first byte, content transfer time, redirect and wait time, page load time, DOM processing time, and the remaining Web Vitals (First Contentful Paint, Cumulative Layout Shift, and Interaction to Next Paint). It also records request counts, error counts, cached and compressed response counts, and transfer sizes.
Private App
Netskope Client
Measured only by the Client. It covers round-trip time across the segments of the private access path, specifically from the device to the Netskope gateway and from Netskope infrastructure to the Publisher fronting the private application. Where a user holds several connections at once, busier connections carry proportionally more weight, so the score reflects the sessions the user is actually depending on.
Browser Extension
Does not contribute to this score.
Coverage at a Glance
| Signal | Netskope Client | Browser Extension |
|---|---|---|
| Processor | Yes | Yes |
| Memory | Yes | Yes |
| Disk capacity | Yes | Not visible |
| Wireless signal strength | Yes | Not visible |
| Device to POP path | Active probe | Connection timing only |
| POP to application path | Yes | Not measured |
| Page rendering and Web Vitals | Not visible | Yes |
| Private application path | Yes | Not measured |
| Measures while user is idle | Yes | No |
A user may currently have more than one score
The Netskope Client and the Browser Extension are separate collection mechanisms, and today they produce their own experience scores independently. A user running both may therefore appear with two scores that do not match. The Client score reflects the whole device and all steered traffic, while the Extension Browser score reflects real browser sessions for specific web applications. Neither is wrong, because they are measuring different things. When you see both, read them as two views of the same user rather than as a contradiction.
How a Measurement Becomes a Score
Raw measurements are not scores. A round-trip time of 90 ms is not inherently good or bad. It is excellent for a user in a remote region reaching a distant application, and poor for a user sitting next to a metropolitan POP. DEM therefore converts each measurement into a 0 to 100 score in two steps.
First, the measurement is mapped onto the 0 to 100 range using a curve calibrated for the region the user’s POP is in. The same latency will not produce the same score everywhere, because what constitutes a healthy path differs by geography.
Second, that result is adjusted for drift. DEM compares the measurement against the recent typical performance of that same path, roughly the last week of its own history, and reduces the score when performance has clearly deteriorated relative to that norm. This is what lets the score surface change, which is usually what you can act on, rather than geography, which usually you cannot.
Two consequences are worth factoring:
- A structurally slow path still scores low: The drift adjustment moderates a score rather than rescuing one. On paths that are inherently high-latency, read the trend rather than the absolute value.
- Contributions are calibrated independently of one another: Compare a contribution against its own history and against peers in the same location, rather than reading two different contribution scores as equally severe.
Why your Scores May Differ by Region
Because each region uses its own calibration curve, two users experiencing identical latency in different parts of the world may not receive identical scores. This is deliberate. If you are comparing users in different locations, compare each against its own trend over time rather than against each other in absolute terms.
How Contributions Become the Headline Score
When each contribution has its own value, they are combined into the single headline score shown against the user. Only contributions that were actually measured in that window take part.
Raw measurementsendpoint, path,page and probe dataContributionscores0 to 100 eachHeadline scoreone number per user,per path, per 5 minBandGoodFairPoor, what you triage on regional calibration, plus drift adjustment, and combines the contributions measured in that window.
Contributions that were not measured in a window do not take part in that window’s headline score.
Always open the Breakdown
The headline is a summary, and summaries lose information. A user can show a headline in the Fair band while one contribution is deeply in the Poor band and the others are healthy, because the healthy contributions offset the unhealthy one. Before concluding that a user is fine, open the contribution breakdown and check whether any single contribution is in Poor. That is where the actionable problem usually is.
This is the single most important habit when working with experience scores. The headline tells you that something is worth attention, the contribution breakdown tells you what, and the underlying metrics tell you why.
Headline and Detail Views May Summarize Differently
The headline user score and the detailed insights surfaces do not always summarise a period the same way. The headline reflects the average across the period, while some insights surfaces emphasise the worse end of the distribution to make sustained problems easier to find. As a result you may see a Good headline alongside a Fair or Poor entry in a device or application insight for the same user and period. That is expected, and the insight is usually the better guide to whether something needs attention.
Using the Score to Troubleshoot
The score is designed to shorten the path from “a user is complaining” to “here is the segment at fault”. A reliable sequence:
- Start at the band, not the number. Identify users sitting in Fair or Poor. Small movements within a band are rarely meaningful.
- Narrow the time range to the period the user reported, because longer ranges average five-minute windows together and hide short incidents.
- Open the contribution breakdown and determine which contribution is dragging. This is the step that most often gets skipped, and the one that most often supplies the answer.
- Check whether the problem is shared. If several users in the same location degrade together, the cause is upstream of any individual, such as a local network, an ISP, or a POP path. If a single user degrades alone, look at their device and their local connection first. Today this comparison is a manual filter across users.
- Compare against the user’s own recent history. A user who has always run in the low Fair band has a different problem from one who dropped out of Good this morning. The second is an incident, the first is a standing condition.
- Drill into the underlying metrics for the failing contribution to identify the specific segment and confirm the cause before you act.
What Each Contribution Usually Implicates
| Contribution in Poor | Where to Look First |
|---|---|
| Device | The endpoint itself: resource exhaustion, an overloaded machine, insufficient free disk, or a weak wireless connection. Frequently a single-user issue. If the score came from the browser extension, remember it cannot see disk or wireless signal, so check the Client view before ruling those out. |
| On-Ramp | The path from the user to the POP: the office LAN, the ISP link, tunnel behaviour, or POP selection. Often shared across a location. Wireless quality affects this path indirectly through latency, but wireless signal strength itself is scored under Device. |
| SaaS / Custom App | The path onward from the POP, the application’s hosting region, or the route from the POP to it. Often shared across everyone using that application. If Client measurements look healthy but extension measurements do not, suspect the application’s own rendering rather than the network. |
| Private App | The private application path: Publisher health, Publisher placement relative to users, or capacity of the private application itself. |
Why a Score Changes
Scores move for reasons that are not always incidents. The common ones are:
- Real degradation: Latency rose, the device came under pressure, or the application slowed. This is the case the score exists to surface.
- A change in what the user is doing: Heavier applications, a different network, or a move between office and home will legitimately move the score.
- A change in what was measured: If a contribution had no data in a window, it does not take part in that window’s headline, so the mix of contributions behind the headline can differ from one window to the next.
- Drift relative to the norm: Because scoring accounts for what is typical for a path over roughly the last week, sudden change is surfaced more sharply than a slow drift.
- Recalculation: A recent window can be recalculated shortly after it was first produced as delayed telemetry arrives, so a very recent score may shift slightly without anything having happened to the user.
If a score is missing rather than changed, that is a different situation with its own set of causes. See Understanding Digital Experience Management (DEM) Scores for the requirements each contribution must meet and what to verify when a score is unavailable.
What the Score Does Not Measure
Knowing the boundaries of the score prevents it from being trusted for things it was not built for.
- It is not an application uptime measurement: On Client scores, if an application is unreachable and users therefore stop generating traffic to it, the result is typically an absence of data rather than a low score. On Browser Extension scores, failed requests are recorded as extreme latency, so an unreachable application can instead appear as a very low SaaS / Custom App or On-Ramp contribution. Neither behavior makes the experience score a reliable availability signal, so use application probes, which test reachability on a schedule, to monitor whether an application is up.
- It is not a per-transaction measurement: Scores summarize in a five-minute window, so a single slow request inside an otherwise healthy window may not move the score.
- It does not cover unsteered traffic: Traffic that bypasses Netskope is largely invisible to Client-based measurement. Where the Browser Extension is deployed, it can still observe browser-based experience for recognized web applications.
- It does not diagnose root cause: The score localizes a problem to a segment. It does not tell you which device driver, which ISP peering point, or which application tier is responsible, and that still requires drill-down and, often, a corroborating source.
- It is not a security or compliance signal: Experience scoring is a performance measurement and carries no verdict about policy, threat, or data protection.
How this Model Evolves
Netskope periodically improves the experience-scoring methodology as measurement coverage broadens and as we learn more about which signals best predict what users actually feel. Improvements of this kind can shift the distribution of Good, Fair, and Poor across your tenant even when nothing about your environment has changed.
Changes that affect scoring are announced in the release notes. If you have built internal thresholds, reports or alert rules on top of DEM scores, re-baseline them after a scoring change rather than assuming a shift represents a real change in user experience.
Glossary
| Term | Meaning |
|---|---|
| Experience Score | The 0 to 100 headline number representing a user’s digital experience in a five-minute window. |
| Contribution | A component score covering one part of the path: Device, On-Ramp, SaaS / Custom App, or Private App. Also scored 0 to 100. |
| Band | The Good, Fair, or Poor classification applied to a score for triage. |
| On-Ramp | The network path between the user’s device and the Netskope point of presence it is connected to. |
| POP | Point of presence. The Netskope location a user’s traffic is steered through. |
| Netskope Private Access | The Netskope service that provides users with access to private applications without placing them on the corporate network. |
| Publisher | The component deployed next to a private application that Brokers access to it for Netskope Private Access users. |
| Round-trip time (RTT) | The time for a packet to travel to a destination and back. The primary latency measurement behind the On-Ramp, SaaS / Custom App and Private App contributions. |
| Active measurement | Measurement generated on a schedule by Netskope components, independent of whether the user is doing anything. |
| Passive measurement | Measurement observed from the user’s own real traffic, also known as real-user monitoring. |
| Application probe | A scheduled, automated HTTPS test to a target application, configured in your DEM settings. |
| Largest Contentful Paint (LCP) | A standard web performance metric measuring how long until the main content of a page has appeared. |
| Single-page application (SPA) | A web application that loads once and then updates in place by calling APIs, rather than loading a new page for each action. |
| Steered traffic | Traffic directed through the Netskope platform by policy, and therefore visible to Netskope measurement. |
Digital Experience Management score behavior and available contributions depend on which DEM components are deployed in your tenant, and on your product entitlements.