

The details section contains a wide range of metrics that provide you with insights into the user experience of the selected user.
DEM Experience Score
The Netskope DEM Experience Score is a time series view of the experience for the selected user and the monitored application. By default, this is the experience score of the user across all applications used on a particular device in a given time period. You can view the experience score trends for a particular application on a device over time by clicking on the application. You can use the tabs to view the cumulative experience score or view the experience score by application.
View Cumulative Experience Score

You can view the cumulative experience score by clicking the View Cumulative Exp Score tab. This tab displays information about the overall experience of the selected use, selected device, and all applications. Each Device with the selected app combination has an Experience Score. When a device is selected, and then an application is selected, the experience score for that specific combination is displayed as Exp Score Per App, which takes the RTT (Round Trip Time) of that application into account. The Cumulative Experience Score takes into account the RTT of all applications when calculating the Application Contribution Score. This provides an overall user experience across all applications.
Average Experience Score: The average Cumulative Experience Score for the selected user, selected device, and all applications running during the selected timeframe.
Average Device Contribution Score: The average Device Contribution Score for the selected device during the selected timeframe.
Average Network Contribution Score: The average Network Contribution Score for the selected user and device during the selected timeframe.
Average Application Contribution Score: The average Application Contribution Score for all applications running during the selected timeframe.
User Experience Automated RCA
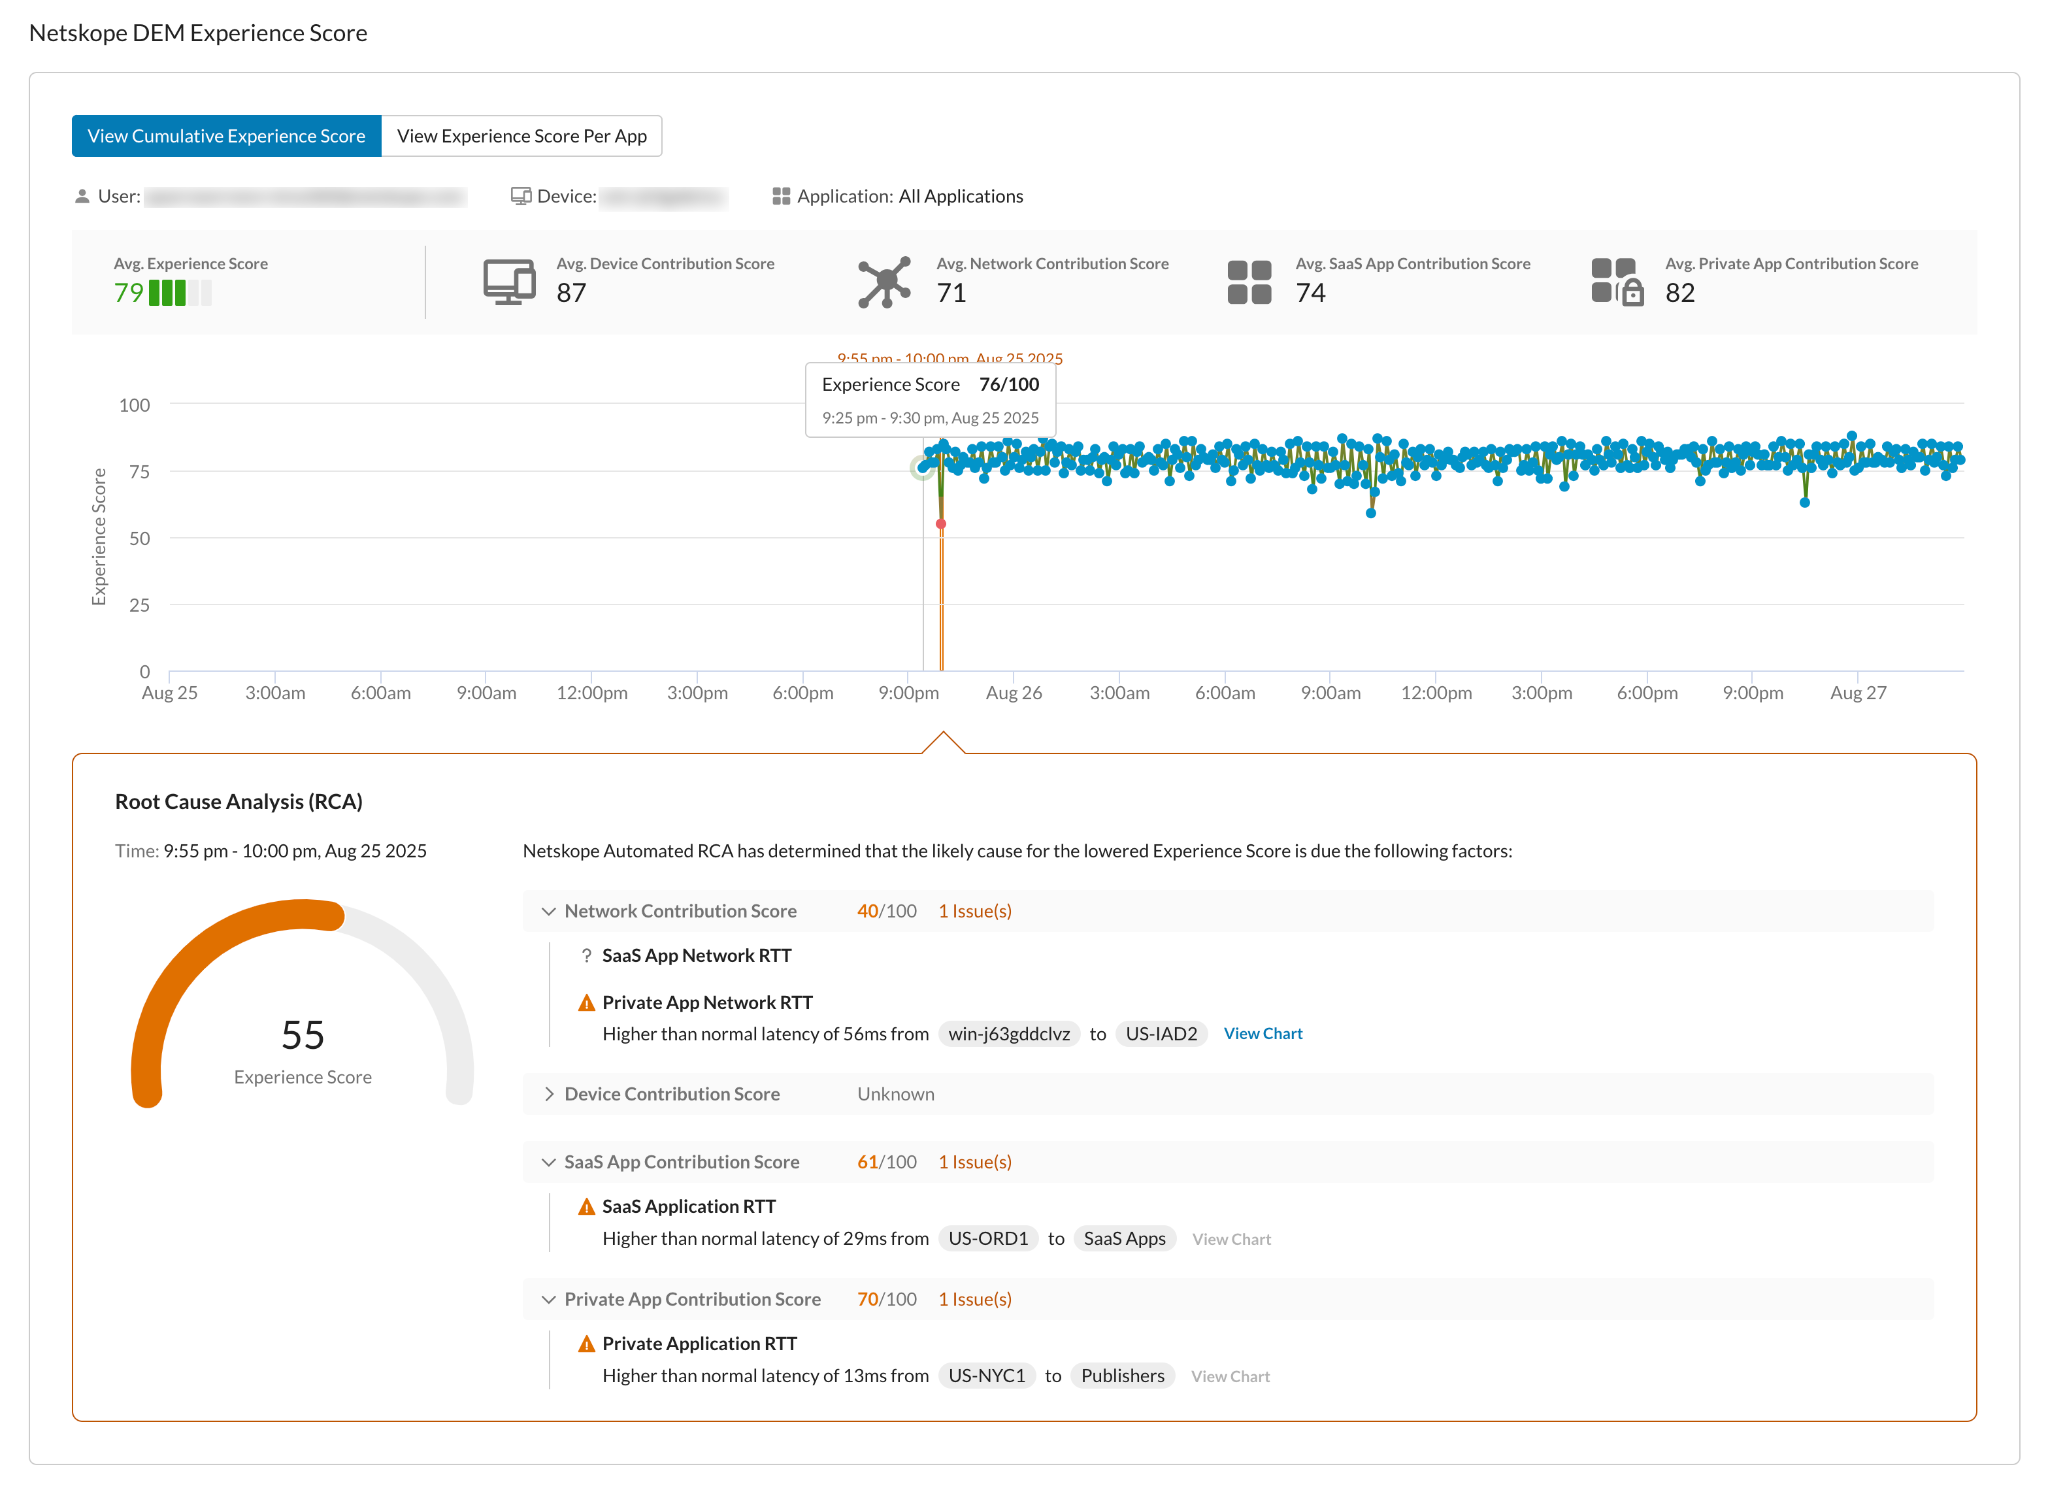
The user experience automated RCA (root cause analysis) tool is a machine learning based algorithm that is used to generate a summary report of the contributing issues and factors which led to a low user experience score. To view a RCA summary report, please do the following:
- Hover your mouse over any of the DEM experience score data points in the DEM Experience Score time series chart.
- The Experience Score window will appear.
- Click on the Root Cause Analysis button to generate an RCA summary report for that respective data point.
View Experience Score Per App

You can view the experience score per application by clicking the “View Exp Score Per App” tab. These metrics show the experience score evolution during the selected timeframe. You can select an application card from the Monitored Applications section to filter this view to only show data for a specific application. The cumulative experience scores include following factors: device metrics, network metrics, and application metrics during a specific range of time.
Filtering Data for Experience Score Per App

The View Experience Score Per App metric includes the following capabilities to view and filter app experience score data:
A. You can filter experience score data using the application type filter by selecting from SaaS and Private Applications using the associated checkboxes.
B. You can hover over data points to view the specific experience score data for apps at a specific time.
C. You can select and deselect apps to customize the data points that are displayed in this metric. Each app has a different color associated with it. The colored circle next to each app corresponds to the color of the data points displayed in the metric. To reselect the app to display the data points, click the app name and the circle will change from grey to a color.