

Les métriques de performance sont les données clés que vous pouvez utiliser pour surveiller la performance des réseaux et des applications, ainsi que pour dépanner les dégradations de performance. Par défaut, toutes les métriques sont exprimées en valeurs moyennes, en tenant compte de toutes les mesures effectuées durant la période sélectionnée. D’autres modèles d’agrégation (percentiles 50, 75, 90 et 99) peuvent être sélectionnés dans le menu déroulant en haut à gauche.
Télémétrie des sondes de réseau
POP Connectivity and Network Latency (E2E)
La mesure "POP Connectivity" correspond au temps d'aller-retour mesuré entre la station d'entreprise ou le NSClient et les POP de Netskope auxquels la station d'entreprise ou le NSClient est connecté.
Il correspond au temps nécessaire pour envoyer un paquet d'une station d'entreprise / d'un client NSC à un POP Netskope et recevoir la réponse en retour.
La mesure "Network Latency (E2E)" correspond à la mesure du temps d'aller-retour entre la station d'entreprise et les cibles personnalisées configurées.
Il correspond au temps nécessaire pour envoyer un paquet d'une station d'entreprise à la cible et recevoir la réponse en retour.
Lorsque vous effectuez des tests Network Probe à partir d'une station Enterprise, veillez à régler le paramètre "Routing" sur le mode approprié afin de cibler les POP Netskope ou les cibles personnalisées :
- “Steered” mode to target Netskope POPs
- “Bypassed” mode to target custom destinations.
Reportez-vous à la section suivante pour plus de détails.
Exemple de calcul du RTT à l'aide d'UDP (test de sonde réseau à partir d'une station d'entreprise)
In the context of Netskope Network Probe, RTT is the time elapsed between the following events:
- The Enterprise Station sends a Network Probe test to the Netskope POP
- Le Netskope POP répond par un message d'erreur ICMP (Destination Unreachable - Port Unreachable) à la station d'entreprise.
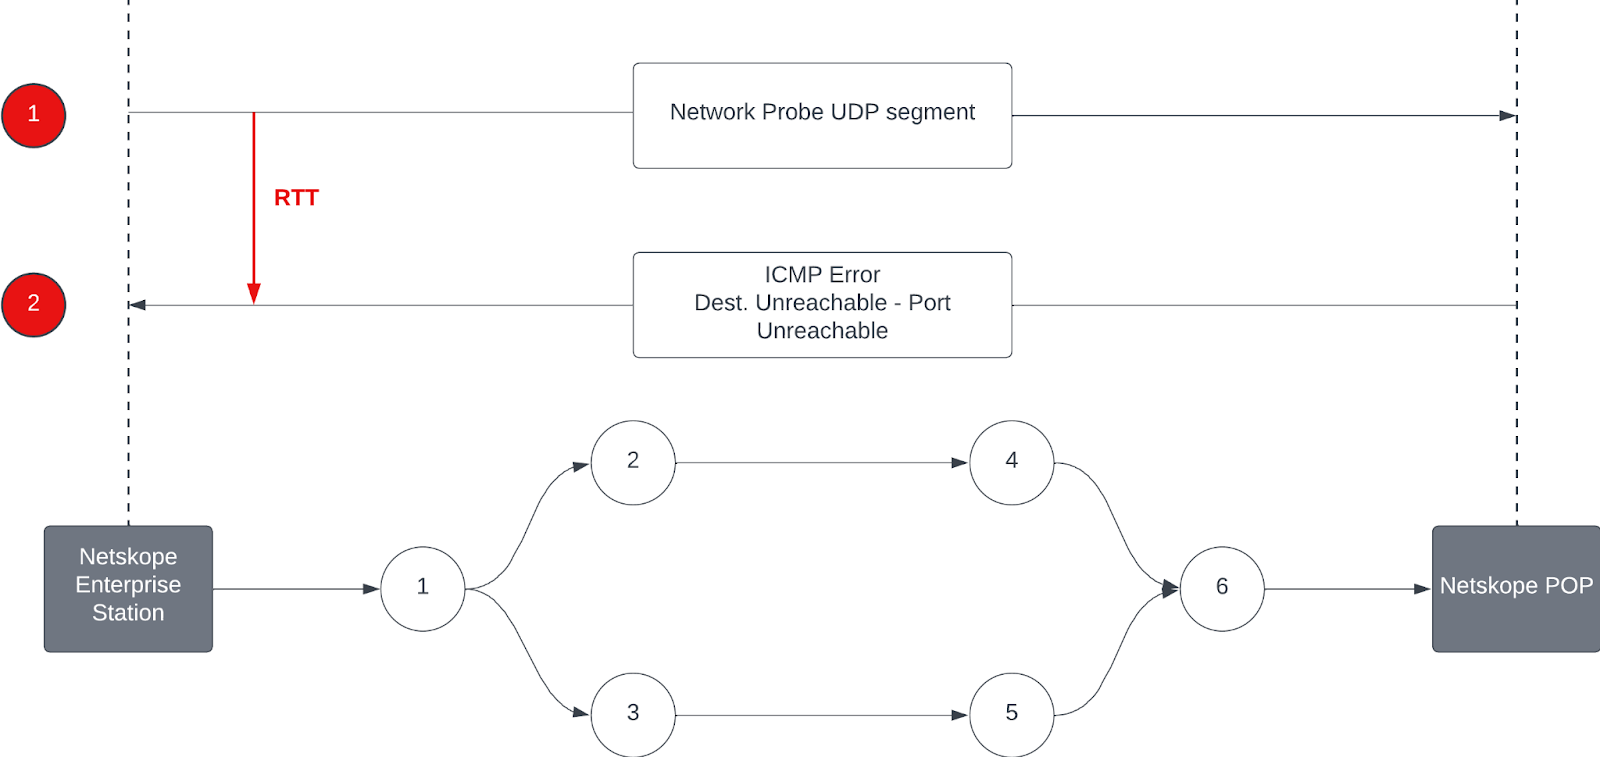
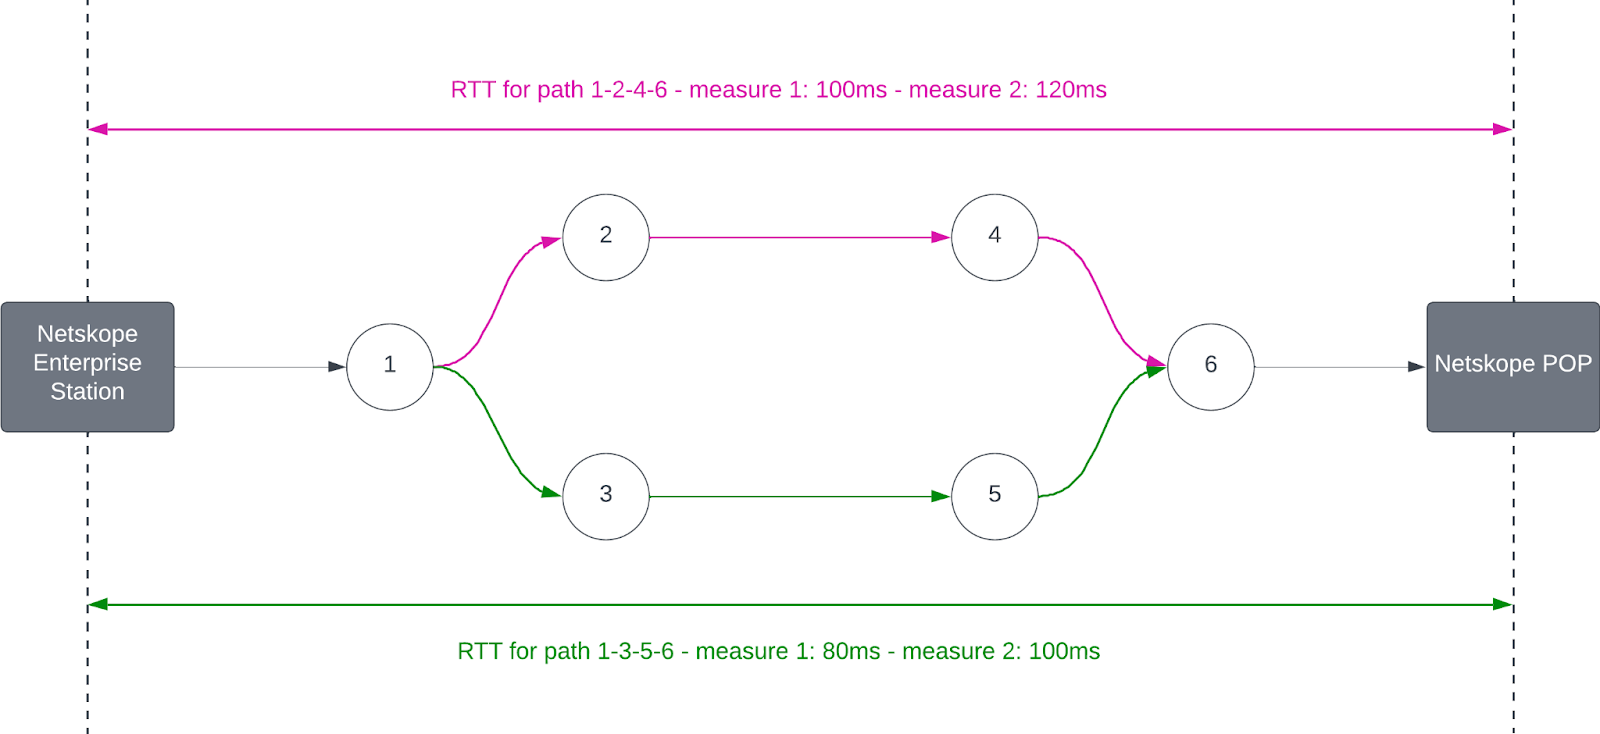
Pour calculer le RTT, Netskope prend en compte tous les tests Network Probe ainsi que tous les chemins possibles et calcule la valeur moyenne :
RTT = (∑RTT Network Probe tests) / #tests
In the example below, RTT = measure 1 for path 1-2-4-6 (100ms) + measure 2 for path 1-2-4-6 (120ms) + measure 1 for path 1-3-5-6 (80ms) + measure 2 for path 1-3-5-6 (100ms) / 4 = 100ms.
Packet loss
In steering mode, the “Packet loss” metric corresponds to the end-to-end packet loss measures from the Enterprise Station or the NSClient to the Netskope POPs the Enterprise Station / the NSClient is connected to.
En mode contourné, la métrique "Perte de paquets" correspond aux mesures de perte de paquets de bout en bout entre la station d'entreprise et le domaine/IP ciblé.
Packet loss = #No response from the target / #Network Probe tests to the target
The method is configurable for Network Probe tests issued from Enterprise Stations.
Visualisation des chemins d'accès au réseau
Packet Loss (Node Level)
Packet loss = #No response from the node / #Network Probe tests to the node.
Delay
Le délai fait référence au calcul du RTT effectué au niveau des nœuds intermédiaires.
It corresponds to the time elapsed between the following events:
- The Enterprise Station sends a Network Probe test to the node
- The node responds with an ICMP error message (TTL Exceeded in Transit) back to the Enterprise Station
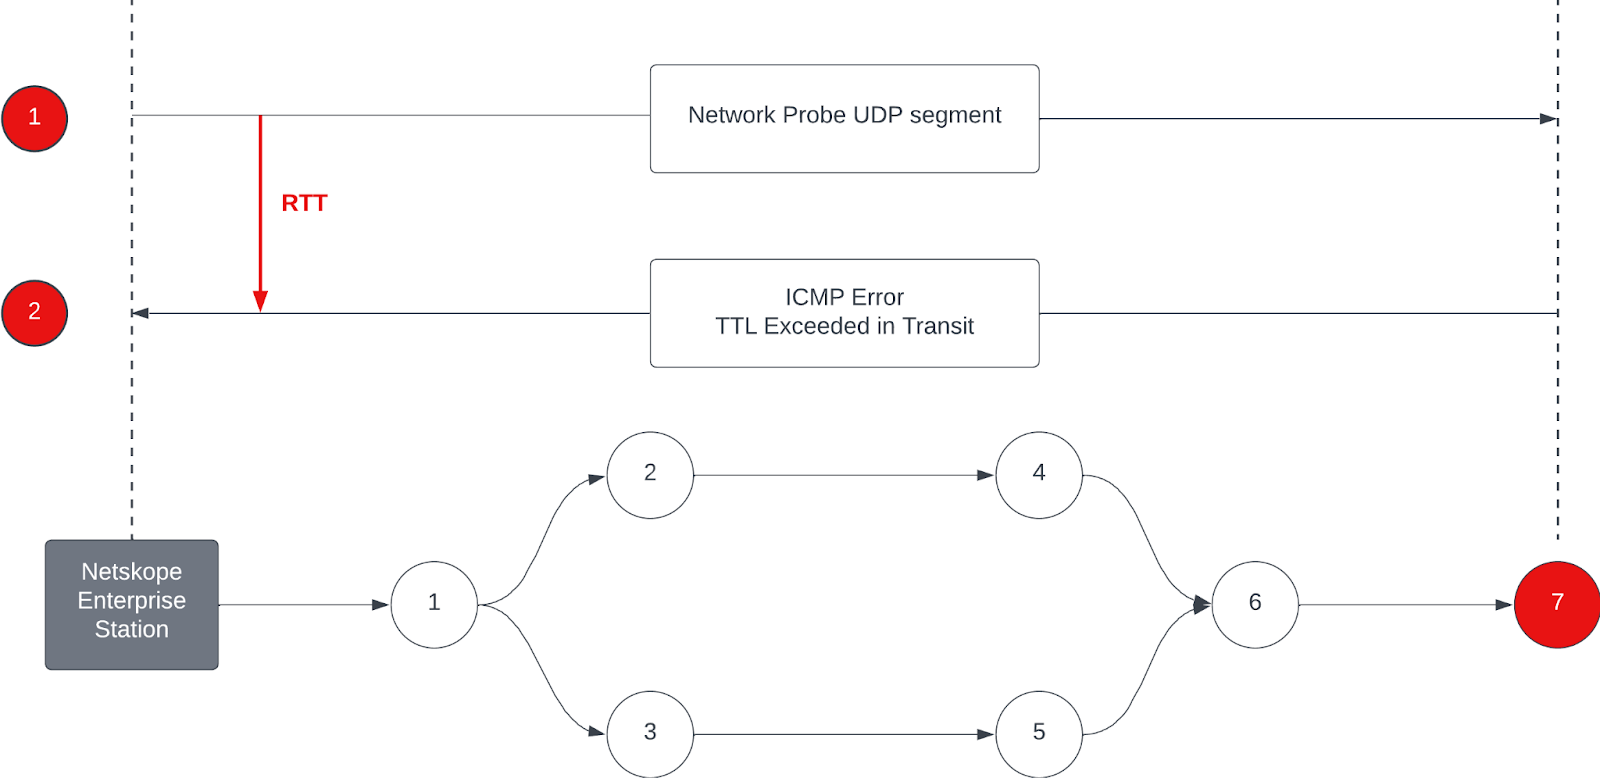
So this RTT value is calculated at each node level. This is computed based on all values from all Network Probe tests and all Enterprise Stations (in case multiple Enterprise stations share the same node in their respective network paths):
RTT = (∑RTT Network Probe tests from all Enterprise Stations) / #tests
Link Delay
The link delay refers to the network latency between two consecutive nodes in a network path.
Il est calculé en soustrayant la valeur minimale du RTT mesurée au niveau de deux nœuds consécutifs.
To explain how this delay is calculated, let’s take the following example:
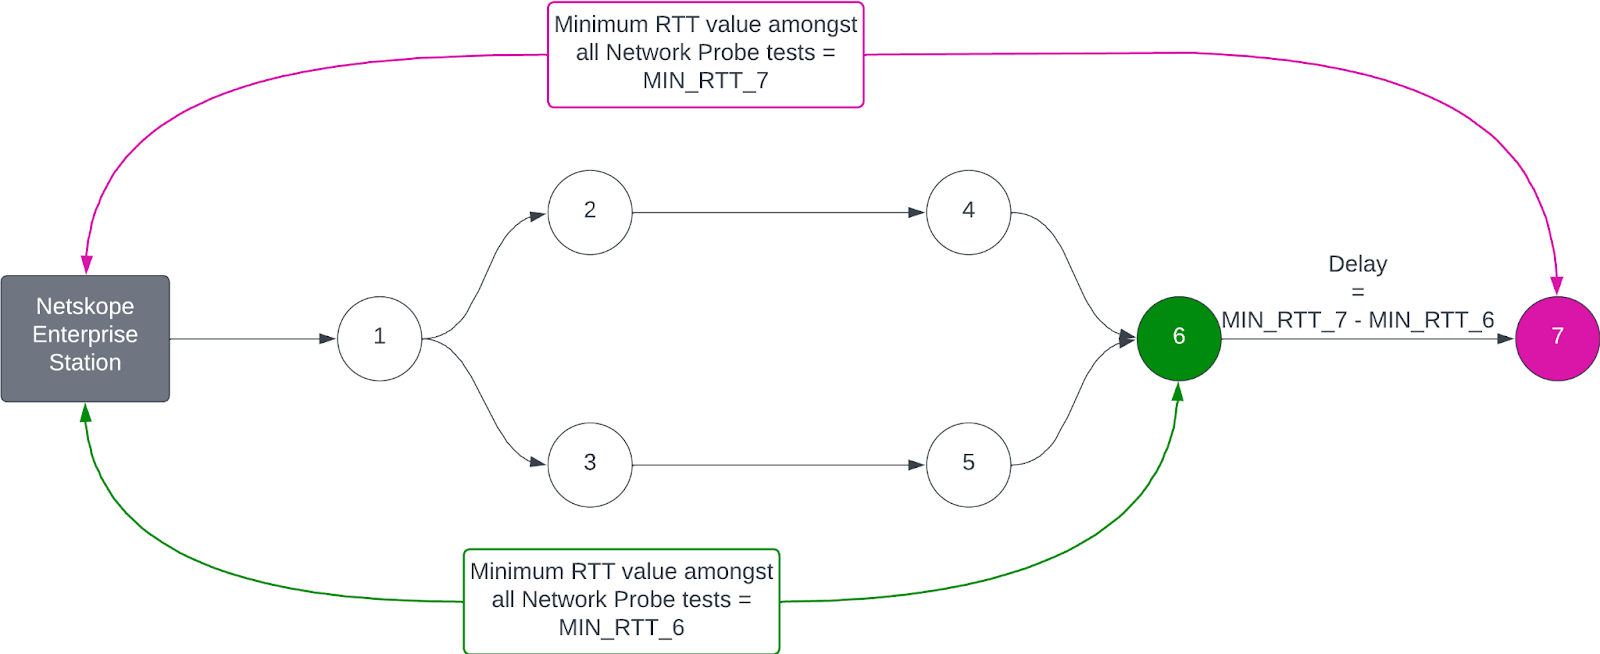
Le retard du réseau introduit par le lien entre les nœuds 6 et 7 est calculé comme suit :
- Parmi toutes les valeurs RTT (Round Trip Time) calculées par les tests Network Probe entre la Station Enterprise et le nœud 7, Netskope conserve la plus petite valeur (MIN_RTT_7)
- Parmi toutes les valeurs RTT entre la station Enterprise et le nœud 6, Netskope conserve également la plus petite valeur (MIN_RTT_6)
- The network delay between node 6 and node 7 is then calculated by subtracting MIN_RTT_6 from the MIN_RTT_7 value, that is Delay = MIN_RTT_7 – MIN_RTT_6.
Dans certains cas, en fonction de la configuration du routeur (par ex. Le protocole ICMP est traité avec une priorité plus faible) et l'état (congestion temporaire), les routeurs peuvent envoyer des messages d'erreur ICMP plus rapidement que les autres. Dans ce cas, comme dans l'exemple précédent, le nœud 7 peut répondre plus rapidement que le nœud 6, ce qui se traduit par une valeur négative du retard du réseau. Dans ce cas, l'interface Netskope n'indiquera aucune valeur sur la visualisation du chemin du réseau.
Perte de paquets (niveau de liaison)
La mesure de la perte de paquets au niveau d'une liaison correspond à la valeur moyenne de la perte de paquets (au niveau du nœud), en tenant compte de tous les chemins qui ont emprunté la ou les routes traversant la liaison en question.
Path Length
In steering mode, the “Packet length” metric corresponds to the average number of hops between consecutive nodes/routers, from the Enterprise Station or NSClient to the target (Netskope POP).
En mode contourné, la métrique "Longueur du paquet" correspond au nombre moyen de sauts entre les nœuds/routeurs consécutifs, depuis le poste d'entreprise jusqu'à la cible (destination personnalisée).
App Probe Telemetry
The App Probe telemetry depends on the mode in which App Probe tests are being performed. Please refer to the following section for more details about these routing modes.
Application Availability
La disponibilité d'une cible de test App Probe est le pourcentage de tests App Probe pour lesquels la cible a répondu au NSClient dans la plage 200-299 ou à l'Enterprise Station dans la plage de codes de réponse configurée (cette plage de codes de réponse est définie dans la définition de l'application personnalisée).
Une erreur de test App Probe sera toujours considérée comme un "service indisponible".
DNS
The “DNS” metric corresponds to the time needed to resolve the App Probe test target FQDN (Fully Qualified Domain Name) into an IP address.
Connection
The “Connection” time corresponds to the time spent by the NSClient/Enterprise Station to establish a TCP connection with the targeted server.
TLS
The “TLS” time corresponds to the time spent by the NSClient/Enterprise Station to perform the TLS handshake process with the targeted server.
Serveur
Le temps "serveur" correspond au temps écoulé entre le premier octet de la requête du NSClient/de la station d'entreprise au serveur ciblé et le premier octet de la réponse reçue par le NSClient/la station d'entreprise.
Ce temps de serveur est le principal indicateur de performance du serveur, car il prend principalement en compte le temps de traitement du serveur. Notez cependant qu'il y a également un RTT (entre le NSClient/Enterprise Station et le serveur) inclus. Ainsi, de mauvaises conditions de réseau entre le NSClient/Enterprise Station et le serveur peuvent également avoir un impact sur la valeur du temps du serveur.
Redirects et Redirect
The “Redirects” metric provides the number of redirections that occurred before reaching the final target delivering the monitored application(s).
Cette mesure peut apparaître sous la forme d'une valeur ou d'une fourchette de valeurs. Par exemple, une fourchette "0 - 5" indique que parmi tous les tests App Probe considérés, il y a eu entre 0 et 5 redirections.
The “Redirect” metric provides the time spent in all the redirections (so it does not include metrics related to testing the final server that delivers the application).
TTFB
The TTFB (Time To First Byte) corresponds to the time between the Enterprise Station / NSClient sending the HTTPS request (aka first byte of the request is sent) and when it receives the first byte of data payload (aka the response) from the targeted server.
This TTFB is a good indicator of global application performance as its value is primarily affected by the:
- Conditions du réseau
Des réseaux dégradés peuvent entraîner une latence élevée ou une perte de paquets, ce qui affecte la TTFB en retardant la demande et/ou la réponse. - Le serveur lui-même
La capacité du serveur à calculer efficacement la demande et à envoyer une réponse aura une incidence directe sur la valeur TTFB.
TTLB
The TTLB (Time To Last Byte) corresponds to the time between the Enterprise Station / NSClient sending the HTTPS request (aka first byte of the request is sent) and when it receives the last byte of data payload (aka the response) from the targeted server.
Transfert de données
The “Data Transfer” time corresponds to the time needed to transfer the full payload from the server to the Enterprise Station / NSClient.
Data Transfer = TTLB – TTFB
Duration
The “Duration” metric corresponds to the time taken for the whole App Probe test process to be processed and completed.
Taille du transfert
The “Transfer size” corresponds to the total response payload transmitted over the network.
Sites/utilisateurs de Netskope POP
The following metrics are processed at the NSClient and/or Enterprise Station level.
DNS
The “DNS” metric corresponds to the time needed to resolve the App Probe test target FQDN (Fully Qualified Domain Name) into an IP address.
Connection
The “Connection” time from the sites/users to Netskope POPs section corresponds to the time spent by the NSClient/Enterprise Station to establish a TCP connection with the NSProxy.
TLS
The “TLS” time from the sites/users to Netskope POPs section corresponds to the time spent by the NSClient/Enterprise Station to perform the TLS handshake process with the NSProxy.
Inside Netskope POPs
The following metric is processed at the NSProxy level.
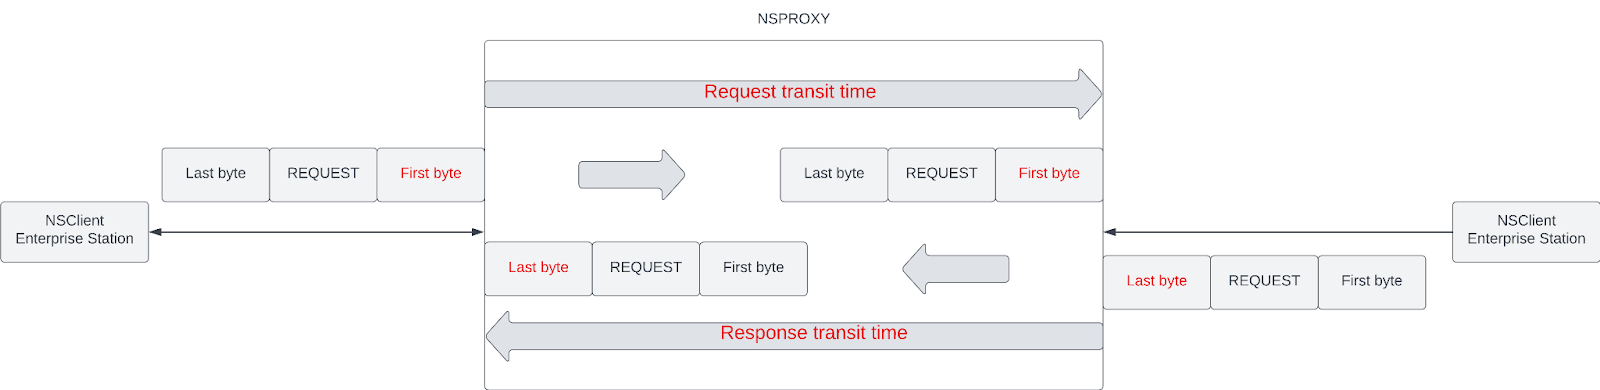
Temps de transit du POP
The POP Transit Time provides the total time spent within the NSProxy.
Il s'agit de l'addition du "temps de transit de la demande" et du "temps de transit de la réponse". Ils sont définis comme suit :
- Temps de transit de la demande
Temps écoulé entre le premier octet de la demande atteignant le NSProxy et ce premier octet de la demande quittant le NSProxy.
- Response transit time
Time elapsed between the first byte of response reaching the NSProxy and this first byte of response leaving the NSProxy
Netskope POPs to Applications
Les mesures suivantes sont traitées au niveau du NSProxy.
Connection
Le temps de "connexion" de la section Netskope POPs to Applications correspond au temps passé par le NSProxy pour établir une connexion TCP avec le serveur ciblé.
TLS
The “TLS” time from the Netskope POPs to Applications section corresponds to the time spent by the NSProxy to perform the TLS handshake process with the targeted server.
Serveur
The “Server” time corresponds to the time between the first byte of NSProxy request to the targeted server and the first byte of response received by the NSProxy.
This Server time is the main server performance indicator, as it mainly takes the server processing time into account. Note though that there is also one RTT (between the NSProxy and the server) included. So bad network conditions between the NSProxy and the server may also impact the Server time value.
Mesures de bout en bout
The following metrics are processed at the NSClient and/or Enterprise Station level.
Redirects et Redirect
The “Redirects” metric provides the number of redirections that occurred before reaching the final target delivering the monitored application(s).
Cette mesure peut apparaître sous la forme d'une valeur ou d'une fourchette de valeurs. Par exemple, une fourchette "0 - 5" indique que parmi tous les tests App Probe considérés, il y a eu entre 0 et 5 redirections.
The “Redirect” metric provides the time spent in all the redirections (so it does not include metrics related to testing the final server that delivers the application).
TTFB
The TTFB (Time To First Byte) corresponds to the time between the Enterprise Station / NSClient sending the HTTPS request (aka first byte of the request is sent) and when it receives the first byte of data payload (aka the response) from the NSProxy.
This TTFB is a good indicator of global application performance as its value is primarily affected by the:
- Conditions du réseau
Des réseaux dégradés peuvent entraîner une latence élevée ou une perte de paquets, ce qui affecte à son tour le TTFB en retardant la requête et/ou la réponse. - POPs réseau
Un temps de transit lent au sein des POPs Netskope peut impacter la requête et/ou la transmission de réponse sur le réseau. - Le serveur lui-même
La capacité du serveur à calculer efficacement la demande et à envoyer une réponse aura une incidence directe sur la valeur TTFB.
TTLB
The TTLB (Time To Last Byte) corresponds to the time between the Enterprise Station / NSClient sending the HTTPS request (aka first byte of the request is sent) and when it receives the last byte of data payload (aka the response) from the NSProxy.
Transfert de données
The “Data Transfer” time corresponds to the time needed to transfer the full payload from the server to the Enterprise Station / NSClient.
Data Transfer = TTLB – TTFB
Duration
The “Duration” metric corresponds to the time taken for the whole App Probe test process to be processed and completed.
Taille du transfert
The “Transfer size” corresponds to the total response payload transmitted over the network.