

The Overview page provides a centralized, high-level view of AI usage across your organization. This page is designed for security teams monitoring AI-related risks and administrators responsible for assessing adoption and governance. It enables quick identification of anomalies and high-risk activities across the environment.
Navigate to the Overview page to monitor AI adoption trends, identify unsanctioned usage, detect high-risk signals, and determine where to focus investigation efforts.
Use the time range filter in the top-right corner to select a time frame. All metrics and data on the page update dynamically based on the selected range. Available options:
- Last 24 hours
- Last 7 days
- Last 14 days
- Last 30 days
- Last 90 days
The Overview page UI is organized into two primary sections: Discovery and Alerts.
Discovery
The Discovery section provides a comprehensive view of AI usage across your organization by surfacing key metrics, trends, and top entities.
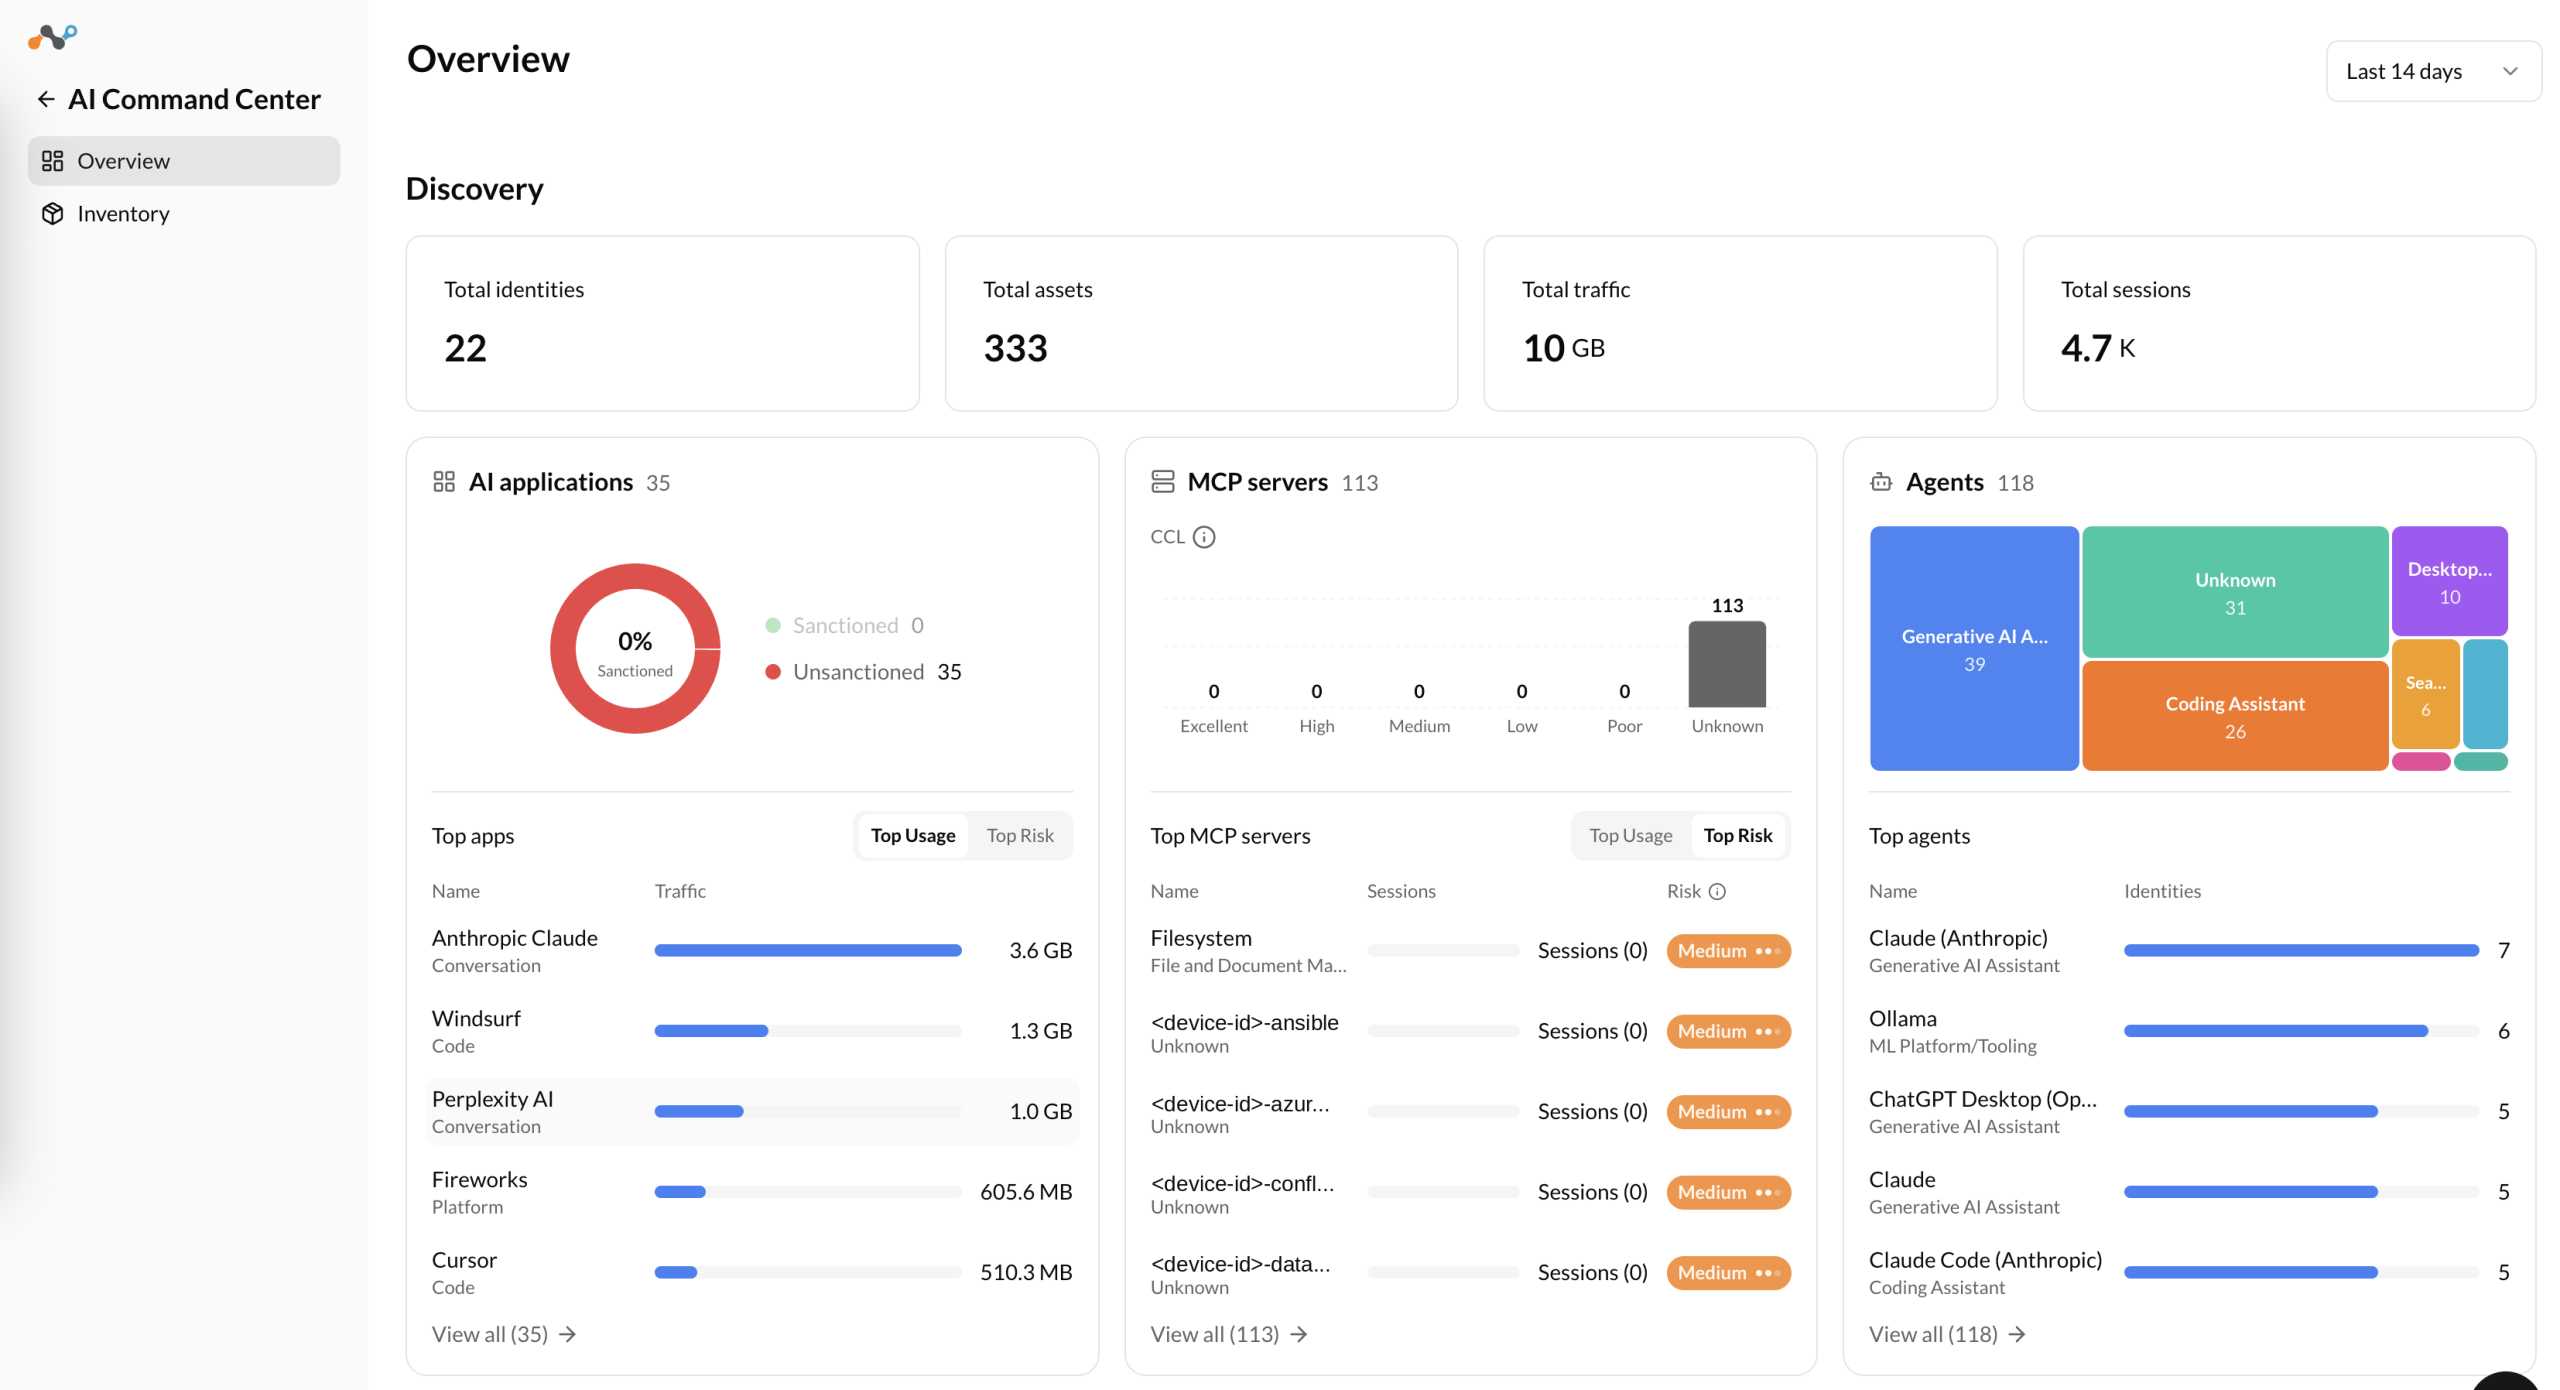
At top, you see a high-level metrics that summarize overall AI activity within the selected time range:
- Identities – Number of unique users interacting with AI applications.
- Assets – Total number of discovered AI applications and MCP servers.
- Total Traffic – Volume of data exchanged by AI applications (upload and download).
- Sessions – Number of sessions involving AI applications.
Each metric includes a sparkline chart showing the data trend over the selected time range.
AI Applications
The AI Applications panel provides visibility into AI applications used within the organization.
- Displays the total number of discovered applications along with a breakdown of:
- Sanctioned applications (approved for enterprise use).
- Unsanctioned applications (unapproved or potentially risky).
- Includes a list of Top Apps based on traffic volume, allowing you to identify the most actively used applications.
- Click on any app to open a detail panel with metadata, policy violations, traffic charts, identities, and domains.
- Click View in Inventory to navigate to the full AI Applications inventory.
- Toggle between Top Usage and Top Risk to sort the Top Apps list.
- Each app in Top Apps shows a Risk badge with its reconciled risk level and confidence indicator. See What Does the Risk Score and Confidence Level Mean in AICC?.
MCP Servers
The MCP Servers panel provides insights into MCP servers accessed by your organization steered by Netskope.
- Displays the total number of MCP servers along with Cloud Confidence Level (CCL) (for example, Excellent, High, Medium, Low, Poor, Unknown).
- Lists Top MCP Servers based on the number of sessions.
- Click on any MCP server to open a detail panel with metadata, session charts, identities, prompts, tools, and resources.
- Click View in Inventory to navigate to the full MCP Servers inventory.
- Toggle between Top Usage and Top Risk to sort the Top Apps list.
- Each app in Top Apps shows a Risk badge with its reconciled risk level and confidence indicator. See What Does the Risk Score and Confidence Level Mean in AICC?.
Agents
The Agents panel provides visibility into AI agents discovered across your organization, such as browser extensions, editor extensions, and desktop extensions that use AI. These are detected through Netskope Client Endpoint AI Discovery.
- Displays the total number of discovered agents, with a treemap breaking down agents by category.
- Lists Top Agents, with each entry showing the agent name and its type (for example, editor_extension, desktop_extension, browser_extension).
- Click on any agent to open a detail panel with metadata, traffic charts, and the identities and endpoints where the agent was detected.
- Click View all (d) to navigate to the full Agents inventory.
Models
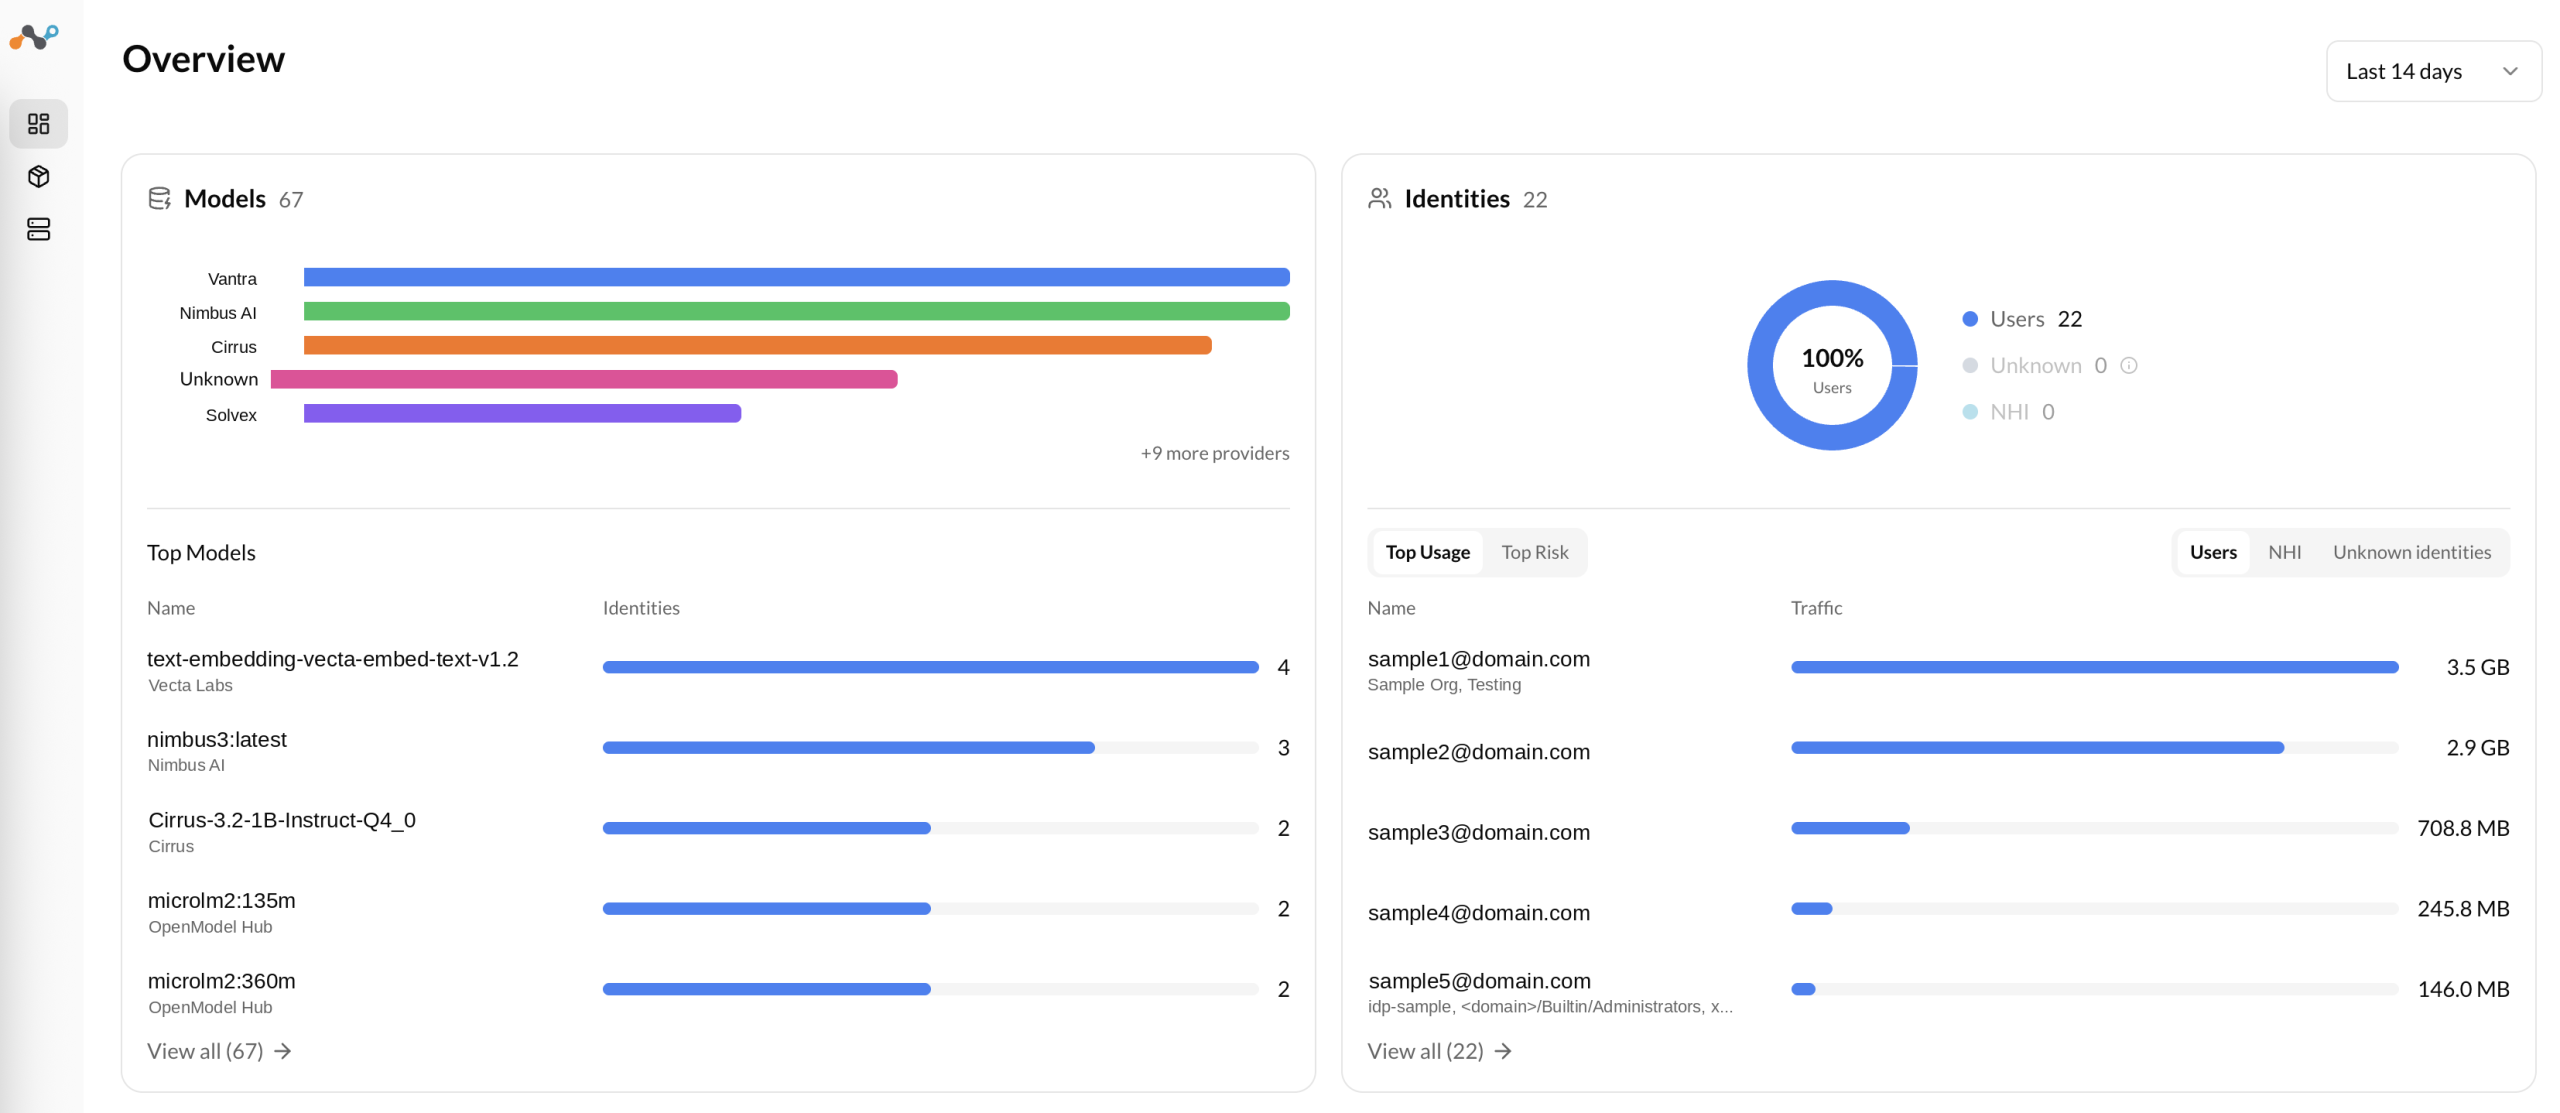
The Models panel provides visibility into AI models discovered on managed endpoints through the Netskope Client Endpoint AI Discovery feature. This includes locally running AI models that do not transit the network and would otherwise be invisible to network-based discovery.
- Displays the total number of discovered models, with a bar chart breaking down models by provider (for example, OpenAI, Anthropic, Mistral, Google, Meta). When more providers are present than the chart displays, a +n more providers link shows the remaining count.
- Lists Top Models based on data volume, with each entry showing the model name and its provider.
- Click on any model to open a detail panel with metadata, and the identities and endpoints where the model was detected.
- Click View all (n) to navigate to the full Models inventory.
Identities
The Identities panel highlights user interaction with AI applications and MCP servers. This provides visibility into who is using AI applications.
- Displays a donut chart showing the proportion of known users and Unknown identities.
- Provides tabbed views for Users and Unknown identities, listing the top identities by usage.
- Click on any identity to open a detail panel with metadata, traffic charts, and connected AI apps and MCP servers.
- Toggle between Top Usage and Top Risk to sort the Top Apps list.
- Each app in Top Apps shows a Risk badge with its reconciled risk level and confidence indicator. See What Does the Risk Score and Confidence Level Mean in AICC?.
Alerts
The Alerts section provides visibility into Netskope alerts for DLP, Threat Protection, and AI Guardrails on Generative AI traffic.

Alert Triage – The Alert Triage section displays a matrix grid showing alert counts organized by detection type and asset type.
- Each cell shows a color-coded count badge, with color intensity based on the number of alerts. Click on individual cells to filter to a specific combination (for example, DLP alerts on AI Apps).
- Clicking a detection type row displays a contextual policy card for that detection type (DLP Profile, Threat Protection, or AI Guardrails), allowing you to quickly navigate to policy configuration.
- Click on applications or assets to open a detail panel with more information.
Navigate to the Inventory page for full analysis.