

Welcome to the Netskope Cloud Exchange (CE) KB Articles page! This page answers common questions about understanding, installing, configuring, managing, and using Cloud Exchange. Our goal is to help you quickly find the information you need. If your question isn’t answered here, refer to our FAQ or the Troubleshooting Guide.
Always consult the latest Netskope Cloud Exchange release notes and product documentation for the most current and detailed information.
Architecture, Installation, and Hosting
High Availability (HA) Setup for Cloud Exchange prior to 6.0.0
Cloud Exchange High Availability
This document describes how High Availability (HA) works in Cloud Exchange. After reviewing the architectural diagram feature list, prerequisites, and sizing guidelines, deploy HA in Cloud Exchange. After the deployment section, there are sections that explain migrating, upgrading, hardening, known limitations, and troubleshooting.
HA Architecture

Features
- Active-Active configurations for Cloud Exchange nodes, enhancing system availability and fault tolerance.
- The Netskope CE Core container is engineered to function as a dedicated worker capable of handling multiple tasks concurrently. For a medium-sized setup, it can manage 10 tasks, while a large setup allows for 20 tasks. These tasks may include operations such as polling, ingestion, and heartbeat monitoring. In a High Availability (HA) cluster with three nodes, the processing power effectively triples, enhancing the system’s execution capacity.
- Task assignments are coordinated through RabbitMQ, which distributes tasks to the core container’s workers based on their current load and the number of tasks they are actively processing. In the event of a core container restart or a node failure, transformation and ingestion tasks are requeued to ensure no data is lost. Meanwhile, data retrieval tasks are reassigned to another node, typically within five minutes of the failure, subject to the workload of the new node.
- To encapsulate, the core container is designed with both task-level and node-level HA to ensure continuous operation and data integrity.
- In a cluster, there will be multiple instances of MongoDB and RabbitMQ. If one node goes down, the other nodes will continue to serve requests, ensuring zero downtime.
- The multiple identical nodes of a Netskope CE will be running concurrently. And all of them are actively processing plugin tasks simultaneously.
To watch a video about Cloud Exchange HA, click play.
UI Dashboard for Cluster Status
Check the current cluster status on the Home page of Cloud Exchange.

Note that the Core service is dependent on the UI services. Because for security reasons, we are not making the core service public. The Core service will be accessible through UI service, and it will be accessed by an internal network. If the UI service is down, the core will show an unknown status on the dashboard.
Prerequisite for HA Deployment on Linux
- The prerequisites for standalone deployment must be met before proceeding for HA.
- Configure and mount the NFS (Network File System) volume on the required machines. Make sure you have permission to Read, Write, and modify the permissions of the files on the NFS server. This NFS volume will serve as a shared storage repository for critical assets, including:
- Mongo authentication key
- SSL certificates
- Environment variables
- Plugins and Custom Plugins
- Repositories
- It is highly recommended to have at least three machines where Netskope CE will be deployed. Refer to Cluster Node Count Requirements to see the minimum required operational nodes in a cluster.
(Ref: https://www.mongodb.com/docs/manual/core/replica-set-members/) - Make sure that all Netskope CE instances have identical physical resources, such as CPU, RAM, and disk space. This uniformity is crucial for achieving Active-Active high availability and consistent performance across the cluster.
- The SELinux must be disabled before running the deployment scripts. This is required to access the NFS volume from the local machine.
- Install the Python3 dependencies.
- For 5.1.0, execute the commands below to install the Python module using the pip package manager.
$ sudo pip3 install "pyyaml>=6.0.0"
$ sudo pip3 install "python-dotenv>=0.20.0,<=1.0.0"
$ sudo pip3 install "pymongo>=4.1.1,<=4.3.3" - For 5.1.1, execute the commands below to install the Python module using the pip package manager.
$ sudo pip3 install "pyyaml>=6.0.0"
$ sudo pip3 install "python-dotenv>=0.20.0,<=1.0.0"
$ sudo pip3 install "pymongo>=4.6.3,<=4.7.3"
- For 5.1.0, execute the commands below to install the Python module using the pip package manager.
- Make sure that every machine can connect to the ports listed below on every machine including the machine itself. The reason for including the current machine is, the API calls will be made to the IP address of the server, and the API call will be made from inside the docker container. So the connectivity of the port using IP address must be allowed. The firewall policies for below listed ports and all the machines should be configured to ensure seamless connection between the machines.
- 4369 (A peer discovery service used by RabbitMQ nodes and CLI tools)
- 5672 (Used by AMQP 0-9-1 and AMQP 1.0 clients without TLS)
- 15672 (HTTP API clients, management UI and rabbitmqadmin without TLS)
- 25672 (Used for inter-node and CLI tools communication)
- 35672 (Used for CLI tools communication)
- 27017 (The default port for mongod and mongos instances.)
- Selected UI port (Default 443 for HTTPS and 80 for HTTP) (To access the UI and internode healthcheck)
Note
If you are using CE as a VM, firewalld is already installed and disabled by default. You will need to enable the firewall by running following commands and restart docker service.
$ sudo systemctl enable firewalld
$ sudo systemctl start firewalld
$ sudo systemctl restart docker
Sample command to open 443 port using firewall:
$ sudo firewall-cmd --permanent --add-port=443/tcp
These ports will be used for the clustering of the MongoDB and RabbitMQ services. Also the UI ports are required to perform a health check from all the machines.
- If you are transitioning from a standalone configuration to a High Availability (HA) setup, you should be knowing your maintenance password, it is required to migrate the Mongo data into the new setup. You can find the maintenance password in the existing standalone configuration.
- If you are using CE as a VM, check this point and make hostname changes accordingly.
Make sure all the machines have different hostnames. Use the below command to change the hostname of a particular machine.$ sudo hostnamectl set-hostname <new_hostname>
Sizing Guideline
- Use the NFS server with a minimum of 5 GB and maximum up to 80 GB of free disk space.
- Other requirements are the same as a standalone deployment.
Deploy HA in Cloud Exchange
- Clone the netskopeoss/ta_cloud_exchange Github repository in all the machines where Netskope CE will be deployed:
$ mkdir netskope
$ cd netskope
$ git clone https://github.com/netskopeoss/ta_cloud_exchange
$ cd ta_cloud_exchange
If you already have the repo cloned, then remove any local changes and pull the latest version.
$ git reset --hard
$ git pull
Note
If you are using CE as a VM, the repo will be available on the /opt/cloudexchange/cloudexchange path. Change the current directory to the cloudexchange directory.
$ cd /opt/cloudexchange/cloudexchange
- Execute the setup script on the primary node and provide the requested information required for the setup:
$ sudo python3 ./setup

- Respond with “yes” when prompted for HA (High Availability) parameters, and additional HA-related parameters will be subsequently requested.
- The script will request further HA-related parameters, such as the Shared Volume path, IP list, and the current node’s IP address.
NOTE: For migration from standalone to HA, ensure that the primary node’s IP address is listed first in the IP list, followed by the secondary nodes. - If you are transitioning from a standalone configuration to a High Availability (HA) setup, it is mandatory to keep the same maintenance password as in the previous configuration. If the password is lost, the data could not be retained.
- Execute the setup script on the remaining nodes with the –location option. Provide the path of the NFS-mounted directory in the –location option. And provide the IP address of the current machine.
$ sudo python3 ./setup --location /path/to/mounted/directory

- If you are migrating from the standalone to HA, and you were using the custom plugins and/or custom repos, copy the plugins to the shared directory. The repos and custom_plugins directories will be created once the previous step is completed.
$ cp <standalone>/data/custom_plugins/ <shared-storage>/custom_plugins
$ cp <standalone>/data/repos/ <shared-storage>/repos - Launch Cloud Exchange on the primary node first. The script will wait until the migrations are complete. Then launch Cloud Exchange on the remaining nodes to join the cluster:
$ sudo ./start
- The UI should be accessible with all the IPs joined in the cluster (
https://<ip>). You can add an external load balancer to the list of IPs in order to distribute the load on all the machines. It is important to note that if the CE UI has a configuration to use TLSv1.3, then we need to use the load balancer which supports the TLSv1.3 for redirecting requests from the HAProxy (Or any other Load Balancer). Make sure your load balancer supports TLSv1.3.
Note
If you want to add your SSL certificate, you can add them to the <path-to-shared-volume>/config/ ssl_certs directory. The name of certificate file should be cte_cert.crt and cte_cert_key.key.
Migrating from Standalone to HA
Go here to see the migration options.
Add a New Node to the Cluster
- Run the setup script in the primary node and update the IP list.
$ sudo python3 ./setup
- Run the setup script in the remaining machines to add the connection information.
$ sudo python3 ./setup --location /path/to/mounted/directory
- Run the start script in the primary node first, and then run the start script for the remaining machines as well. At last run the start script in the new node.
$ sudo ./start
Note
An existing node restart is required; otherwise, there will be inconsistency between the UI dashboards and healthcheck.
Remove a Node from the Cluster
- Make sure the cluster is healthy, all the services should be up and running. Otherwise you may see errors while removing the node from the cluster.
- Execute the
./stopscript on the node, and it will remove the MongoDB and RabbitMQ nodes from the cluster. Identify the new primary node of the MongoDB cluster and update the shared configuration file. When done, stop the running services.
Note
As per the HA proxy list available in the environment variables, the dashboard will show all the IP addresses in the status.
If we want to completely remove the node from the UI dashboard as well, we must run the setup script in the remaining nodes and remove the IP from the HA parameters and run the start script again. This will restart all the services in current node and the IP list will be updated.
Upgrading HA
Upgrade HA to backward compatible version (Rolling Upgrade)
- Fetch the most recent version of the docker compose repository.
- Execute the setup script as outlined in the comprehensive setup section.
- Launch the start script.
- Repeat the above steps for all the remaining nodes in the cluster.
Upgrade HA to non-backward compatible version (Full Stop Upgrade)
- Fetch the most recent version of the docker compose repository.
- Stop all nodes, excluding the primary node.
- Execute the setup script as outlined in the comprehensive setup section.
- Execute the start script in the primary node.
- Repeat the setup and start script procedures on the remaining nodes to ensure uniform configuration.
Note
During this process, it’s important to be aware that there may be a brief period during which the CE will experience a temporary outage or downtime. It is recommended to keep a small maintenance window during the upgrade process.
Hardening Guidelines
- In order to establish the necessary connectivity between Docker services across various machines and facilitate the integration of nodes into the cluster, we have exposed the ports listed below from the Docker services. It is imperative that these ports remain accessible from all machines where the Netskope CE HA deployment is intended. To enhance security measures, it is also advisable to restrict access to these ports from other IP addresses.
The below ports will be used for the clustering of the MongoDB and RabbitMQ services. Also the UI ports are required to perform a health check from all the machines.- 4369 (A peer discovery service used by RabbitMQ nodes and CLI tools)
- 5672 (Used by AMQP 0-9-1 and AMQP 1.0 clients without TLS)
- 15672 (HTTP API clients, management UI and rabbitmqadmin without TLS)
- 25672 (Used for inter-node and CLI tools communication)
- 35672 (Used for CLI tools communication)
- 27017 (The default port for mongod and mongos instances)
- Selected UI port (Default 443 for HTTPS and 80 for HTTP) (To access the UI and internode healthcheck)
- As we are utilizing NFS for shared storage, it is important to configure the NFS volume in a manner that restricts access exclusively to Netskope CE instances. This precaution is of utmost importance in order to strengthen security measures.
Cluster Node Count Requirements
As a part of MongoDb replication and RabbitMQ mirroring requirements in the event of a failure, it is crucial to ensure that the HA cluster remains operational with the majority of the CE nodes ACTIVE/ONLINE. An HA cluster with an odd number of CE nodes has a higher chance of remaining operational than a cluster with an even number of CE nodes.
| Total Number of CE Nodes in an HA cluster | Minimum Number of ACTIVE/ONLINE CE Nodes Required in an HA Cluster at any Given Time for Successful Operation |
|---|---|
|
3 |
2 |
|
4 |
3 |
|
5 |
3 |
|
6 |
4 |
|
7 |
4 |
|
8 |
5 |
|
9 |
5 |
Limitations
- You should ensure the availability of NFS volume.
- Running multiple redundant instances of the Netskope CE requires additional hardware and computing resources.
- In some cases, HA setups may introduce increased latency due to the need to replicate data or coordinate between active instances.
- Whenever there are modifications to IP addresses or node-related configurations, it will be necessary to execute both the setup and start scripts on all machines within the system to ensure that the changes are properly propagated and synchronized across the cluster. It is recommended to add all the required machines at once and use a fixed IP addresses for the machines.
- It is crucial to maintain the majority of nodes operational at all times, as the failure to do so would result in cluster failure. i.e. In a 3-node cluster, at least 2 nodes must be operational at any given time; similarly, in a 5-node cluster, at least 3 nodes should be up and running. The pattern continues accordingly for larger clusters. This is because MongoDB will not initiate the Primary election process under such circumstances. Additionally, we have implemented a “pause_minority” option for RabbitMQ to mitigate the challenges associated with network partition-induced inconsistencies. This should recover once the node comes back up and connects to the cluster again. Refer to Cluster Node Count Requirements to see the minimum required operational nodes in a cluster.
Ref: https://www.mongodb.com/docs/v5.0/core/replica-set-elections/#network-partition | https://www.rabbitmq.com/partitions.html#options - In rare cases, when a cluster is facing back-to-back node failures, there are chances of data loss in the RabbitMQ because the queue will become leader and mirror very frequently, and in such cases, other nodes may lose the data which is not synchronized yet.
Ref: https://www.rabbitmq.com/ha.html#behaviour - To use SSO, we will be able to add only one node’s IP address as a redirect URL. Optionally, we can configure the load balancer against all the IP addresses, and use IP address of the load balancer, to configure the SSO. And it will redirect the request to any available node.
- Migration from HA to standalone is currently not supported.
Troubleshooting HA in Cloud Exchange
- SE Linux must be disabled before running the HA. This is required to access the NFS server from the machine. And SE Linux won’t allow that.
- The ./stop script in HA will remove the MongoDB and RabbitMQ node from the cluster. And stop the services in that particular machine. It is crucial to have the services up while running the ./stop script. Otherwise the script might fail as the script won’t be able to create the Mongo client to remove the node.
- Make sure you have given permission to read and write both for the NFS server. Check if you are able to create a new file and are able to modify the permissions of the file.
- During migration, if you have any issues with node renaming, check the prerequisite and restore the backup from 1st step. Then retry the migration from 2nd step.
$ sudo rm -rf <path-to-ta_cloud_exchange>/data/mongo-data/data/*
$ sudo cp -R <temp-mongo-path>/*
<path-to-ta_cloud_exchange>/data/mongo-data/data/ - Make sure docker/podman services are running. If not, run the services using this command
$ sudo systemctl restart docker
- If the UI shows a down status for any container for a long period of time, check the status of the container and perform reboot if required. Use podman wherever applicable.
- Check for the container status. If all the services are running move to 2nd step. Otherwise, run the start script again to recover the container.
$ docker ps
- Check for the MongoDB cluster status. Execute the commands below to run the command inside the MongoDB container.
$ docker compose exec -- mongodb-primary bash
$ mongosh -u root -p $MONGO_INITDB_ROOT_PASSWORD
$ rs.status()
If the status shows anything other than PRIMARY and SECONDARY for long period of time, run this command to restart the container on a specific machine.
$ docker compose restart mongodb-primary
- Check for the RabbitMQ cluster status. Execute the commands below to run the command inside the RabbitMQ container.
$ docker compose exec -- rabbitmq-stats bash
$ rabbitmqctl cluster_status
Check the running node section in the output and figure out the connected and running nodes. Restart the RabbitMQ container if required.
$ docker compose restart rabbitmq-stats
- Check for the container status. If all the services are running move to 2nd step. Otherwise, run the start script again to recover the container.
- If any node experiences a worker lost error, like if the worker is not connected with RabbitMQ, restart the specific core container to recover the workers. This issue is likely to occurre when the RabbitMQ cluster is down for long period of time.
$ docker compose restart core
Deploy Cloud Exchange on Proxmox
Proxmox Server Prerequisites Requirements
VMsphear Client-side Checklist
Go to CPU Settings (Inside Edit Settings > CPU > Hardware virtualization).
Enable the Expose hardware assisted virtualization to the guest OS option.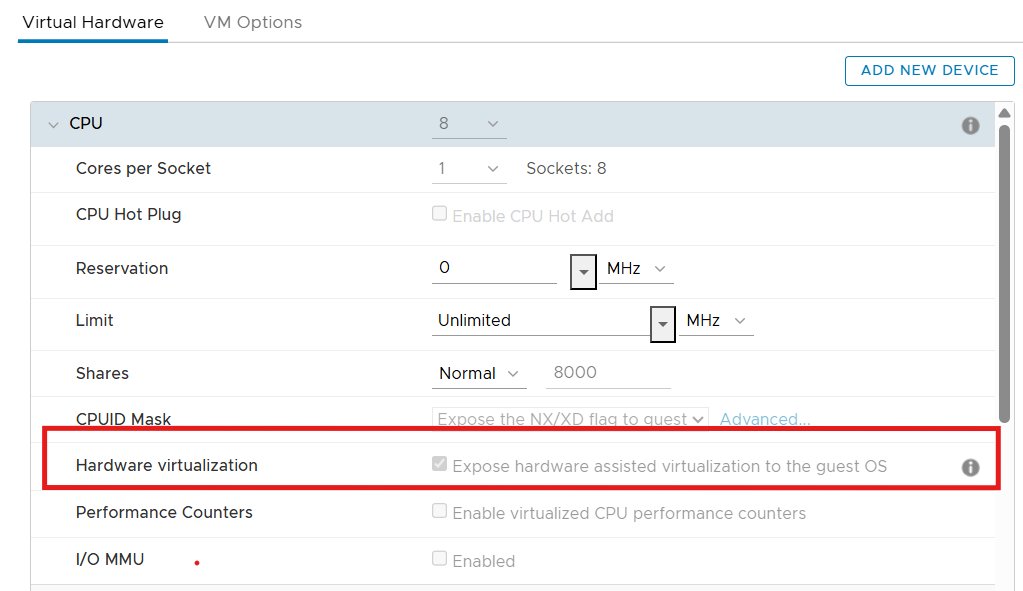
Hardware Requirements
- CPU: Minimum 8 cores recommended
- RAM: Minimum 16 GB
- Disk: Minimum 250 GB (SSD recommended)
- CPU Feature: Must support AVX
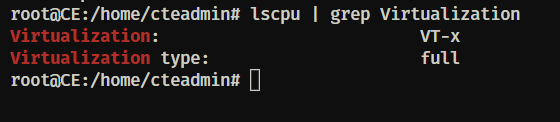
- Virtualization: Intel VT-x / AMD-V enabled in BIOS
Command
lscpu | grep virtualization
Proxmox Configuration Checklist
- Proxmox VE installed and accessible via Web UI.
- Storage configured (like local-lvm or custom storage)
Commandpvesm status

- Network bridge configured (lke vmbr0)
Command:brctl show
- Sufficient free resources available: CPU / RAM / Disk space
Configure Proxmox
- Download the latest CE OVA on your local machine following the instructions
here.
- Transfer the
.ovafile from your local machine to the Proxmox server where you want to deploy Cloud Exchange. - Extract the OVA.
Commandtar -xvf cloud-exchange-6.0.1-20260127.ova
This command will take 20-30 minutes to fully extract the
.vmdkfile.
Output

- Create the Cloud Exchange VM. After the
.ovffile is present, run this command. It may take 30-35 Mins.qm importovf 102 cloud-exchange.ovf local-lvm --format raw
Explanation
Parameter Meaning 102 VM ID cloud-exchange.ovf OVF manifest file local-lvm Proxmox storage –format raw Disk format 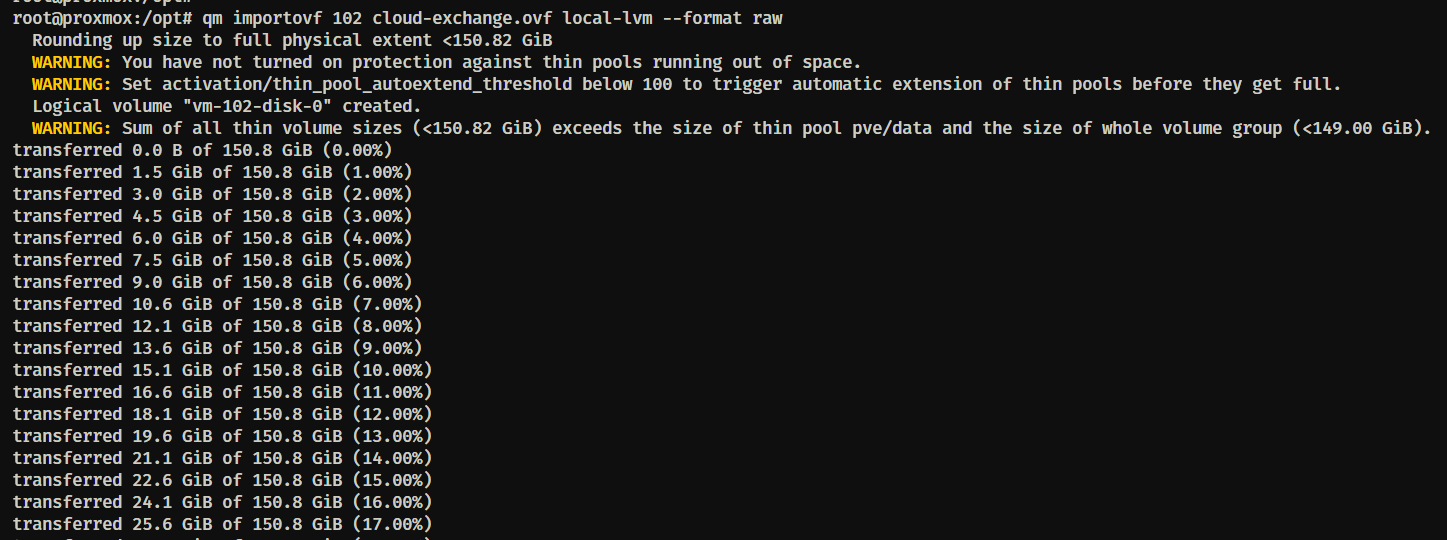
- Log in to the Proxmox UI.
You should see the 102 VM was created successfully.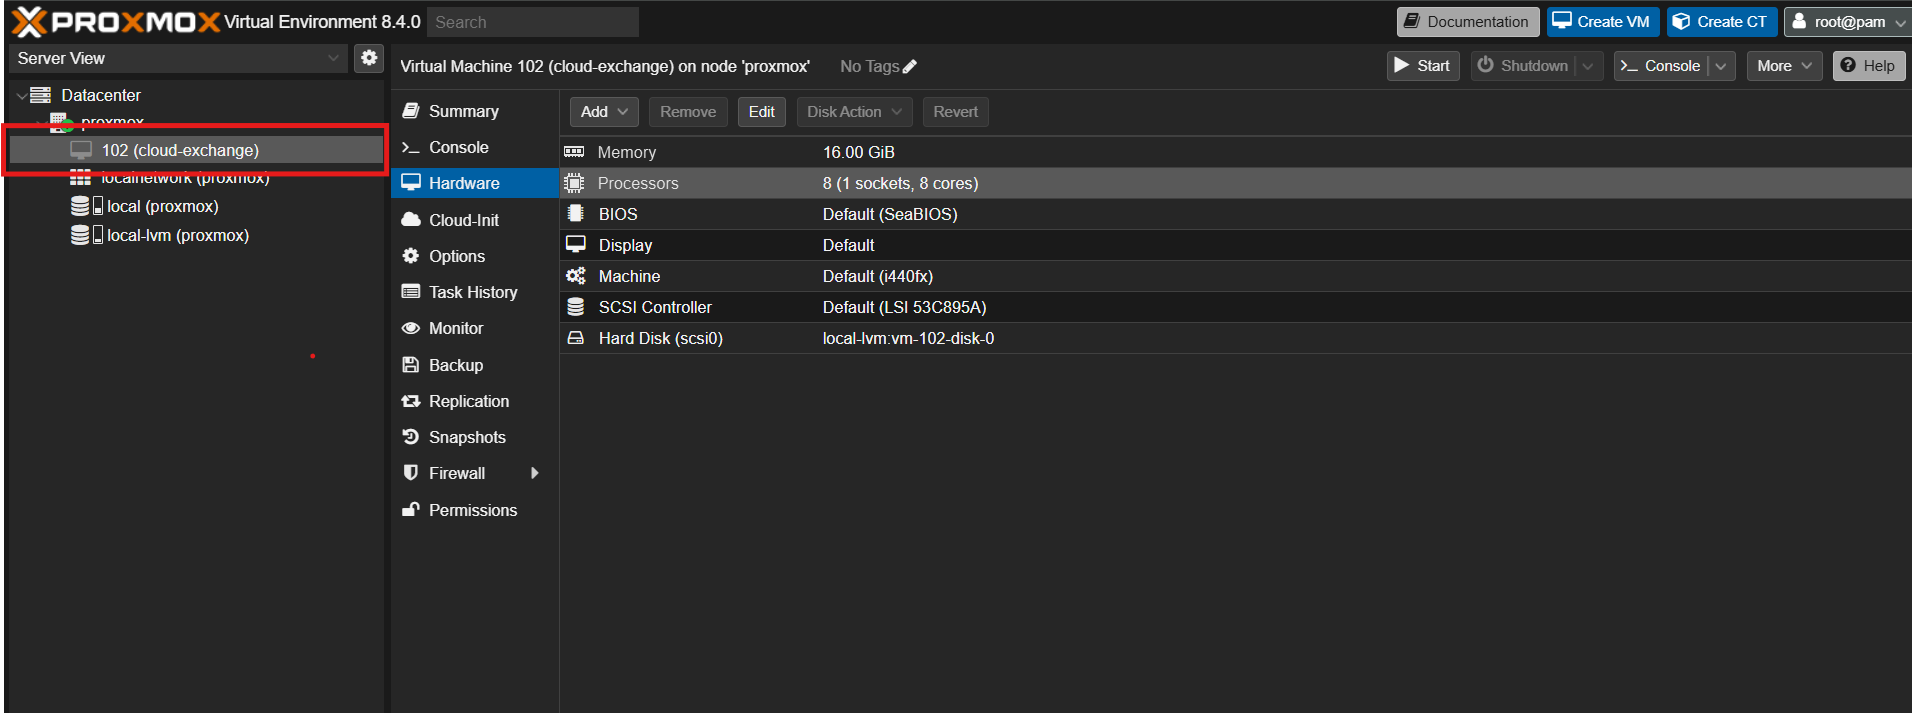
- Add a Network Device. Select the new VM 102. Select Hardware > Add > Network Device and set the configuration as needed (model “Intel E1000” should work).
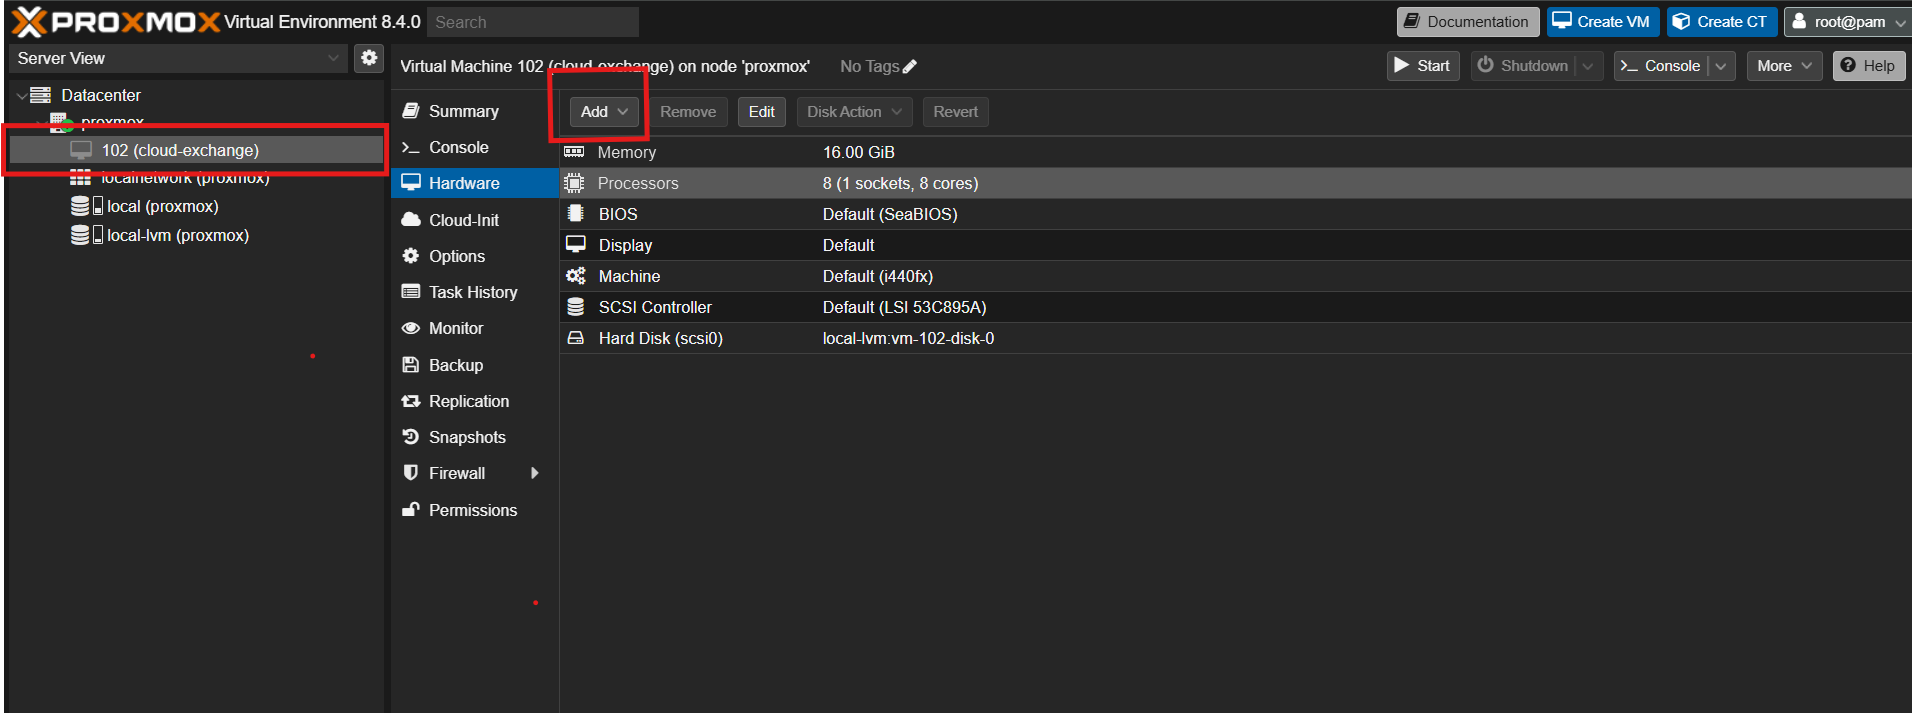
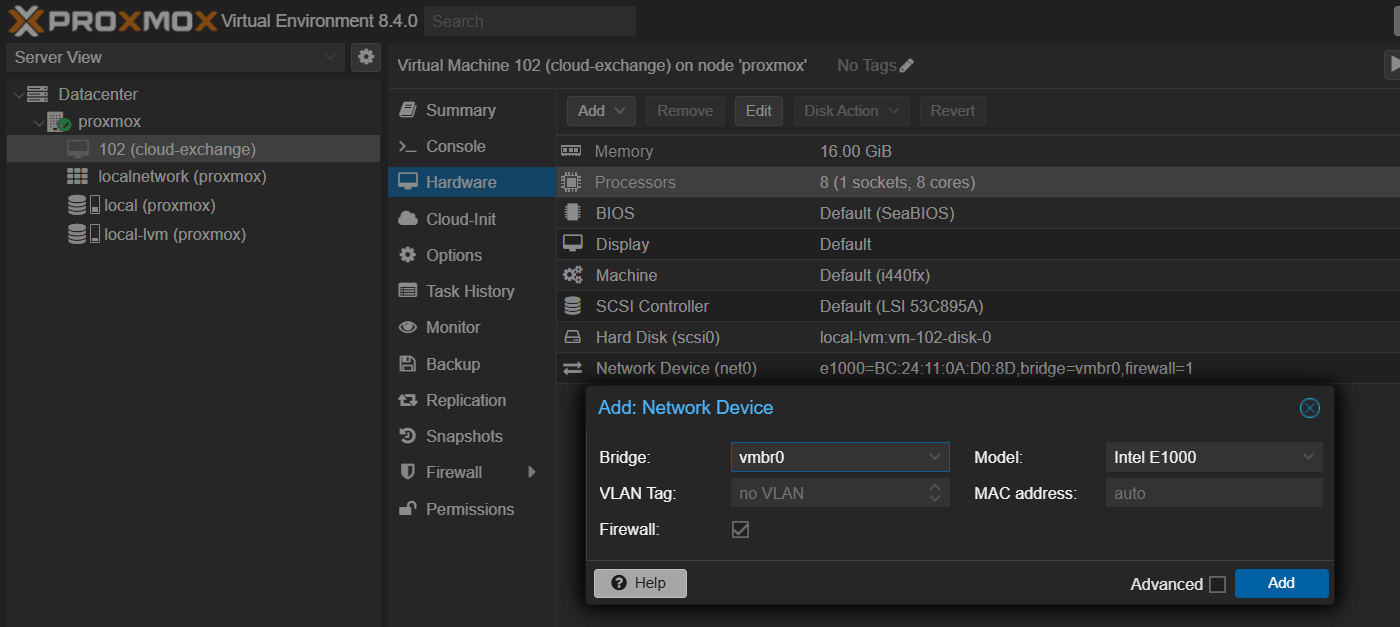
- Set the Processor Type to Host. Select Hardware, double-click Processors, and change Type to Host (it might be at the very bottom of the list).
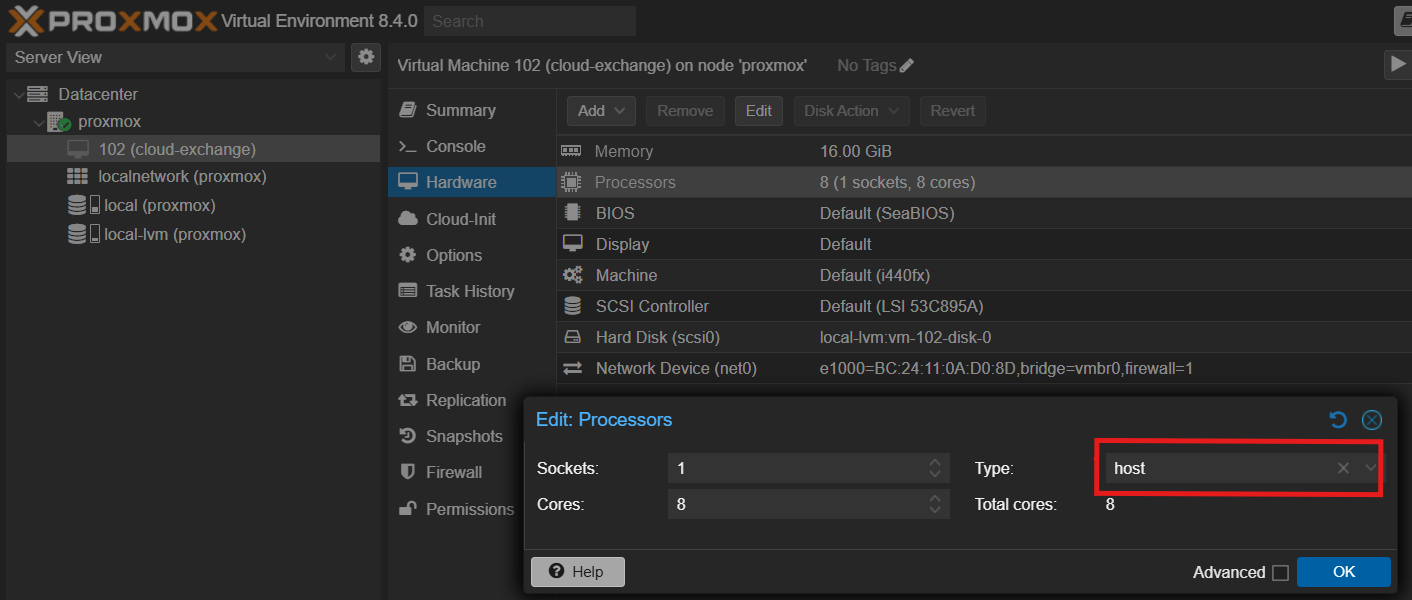
Shutdown the VM. - Now start the VM in Proxmox.
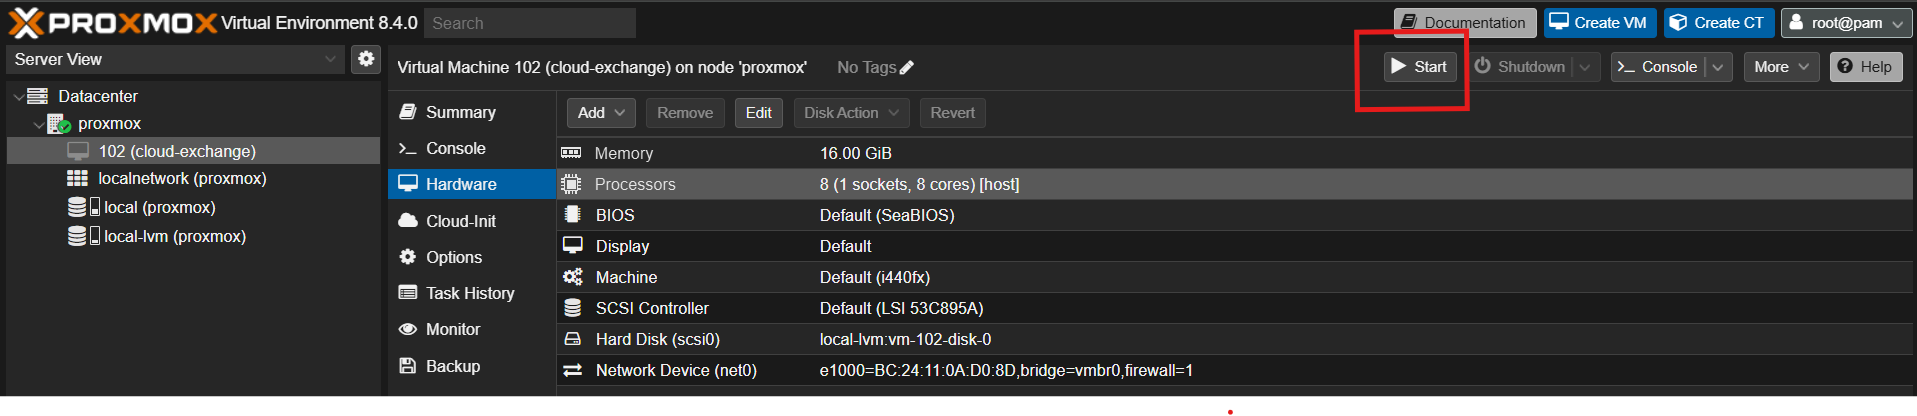
You may get this error after starting the VM:TASK ERROR: KVM virtualization configured, but not available. Either disable in VM configuration or enable in BIOS.
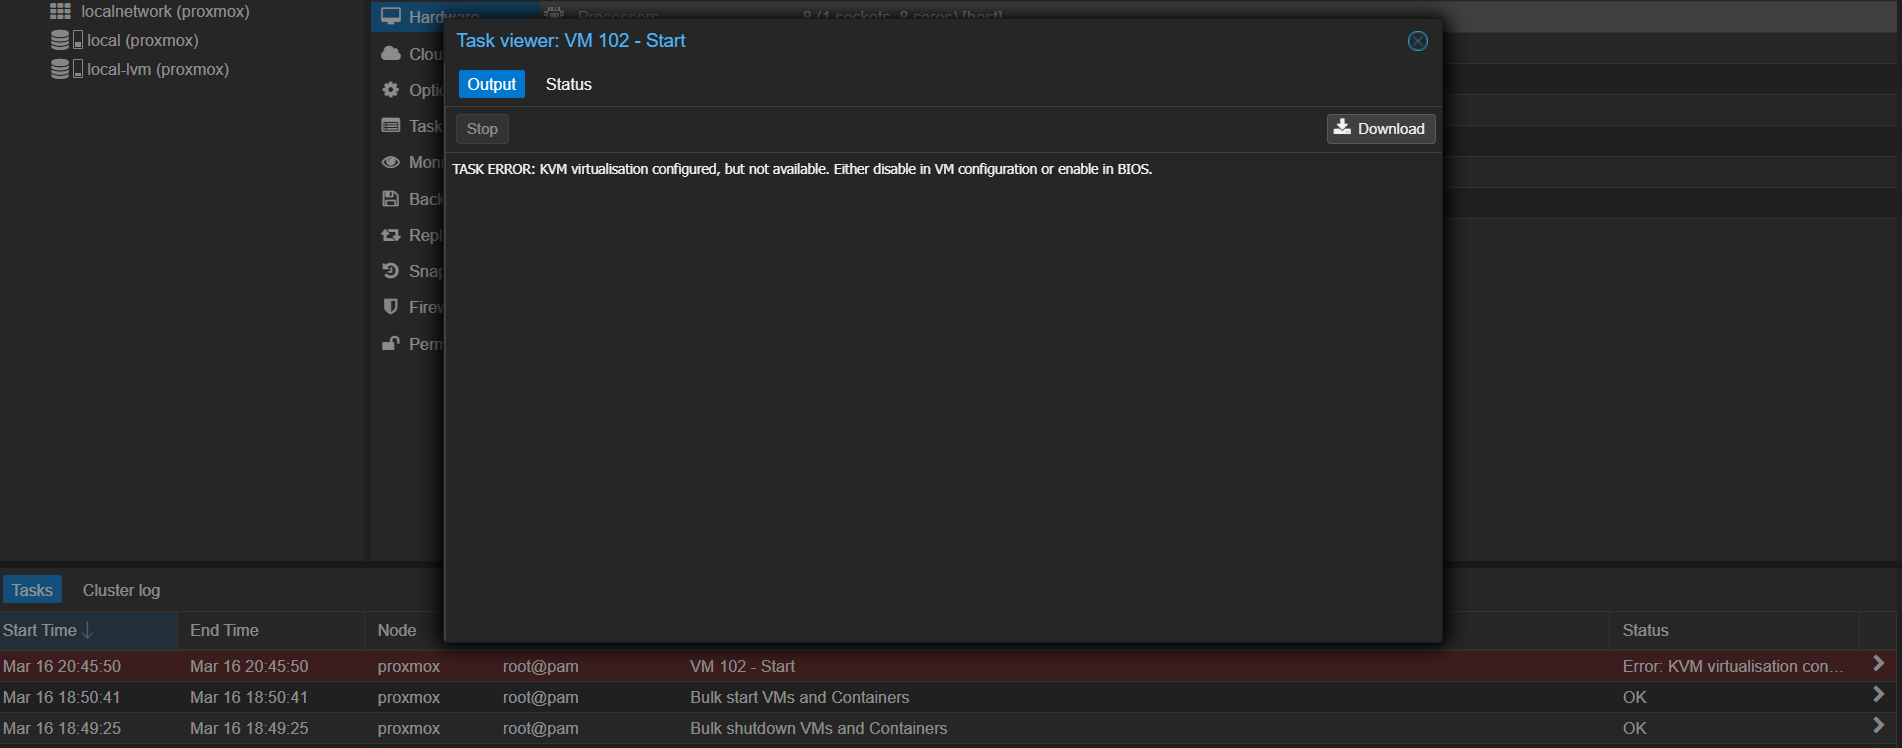 To solve this error, you need to check below check list in Vsphere server:
Enable Virtualization in vSphere
Go to VM > Edit Settings > CPU.
Enable this option: Expose hardware assisted virtualization to the guest OS
Add Advanced Parameter (If above options does not work, then try this)
Go to VM > Edit Settings > VM Options > Advanced > Edit Configuration.
Add a new parameter:vhv.enable = TRUE
Verify CPU Virtualization on the ESXi Host
Your physical ESXi host CPU must support: VT-x (Intel) or AMD-V. - After the Proxmox VM 102 starts, you should see this in the output.
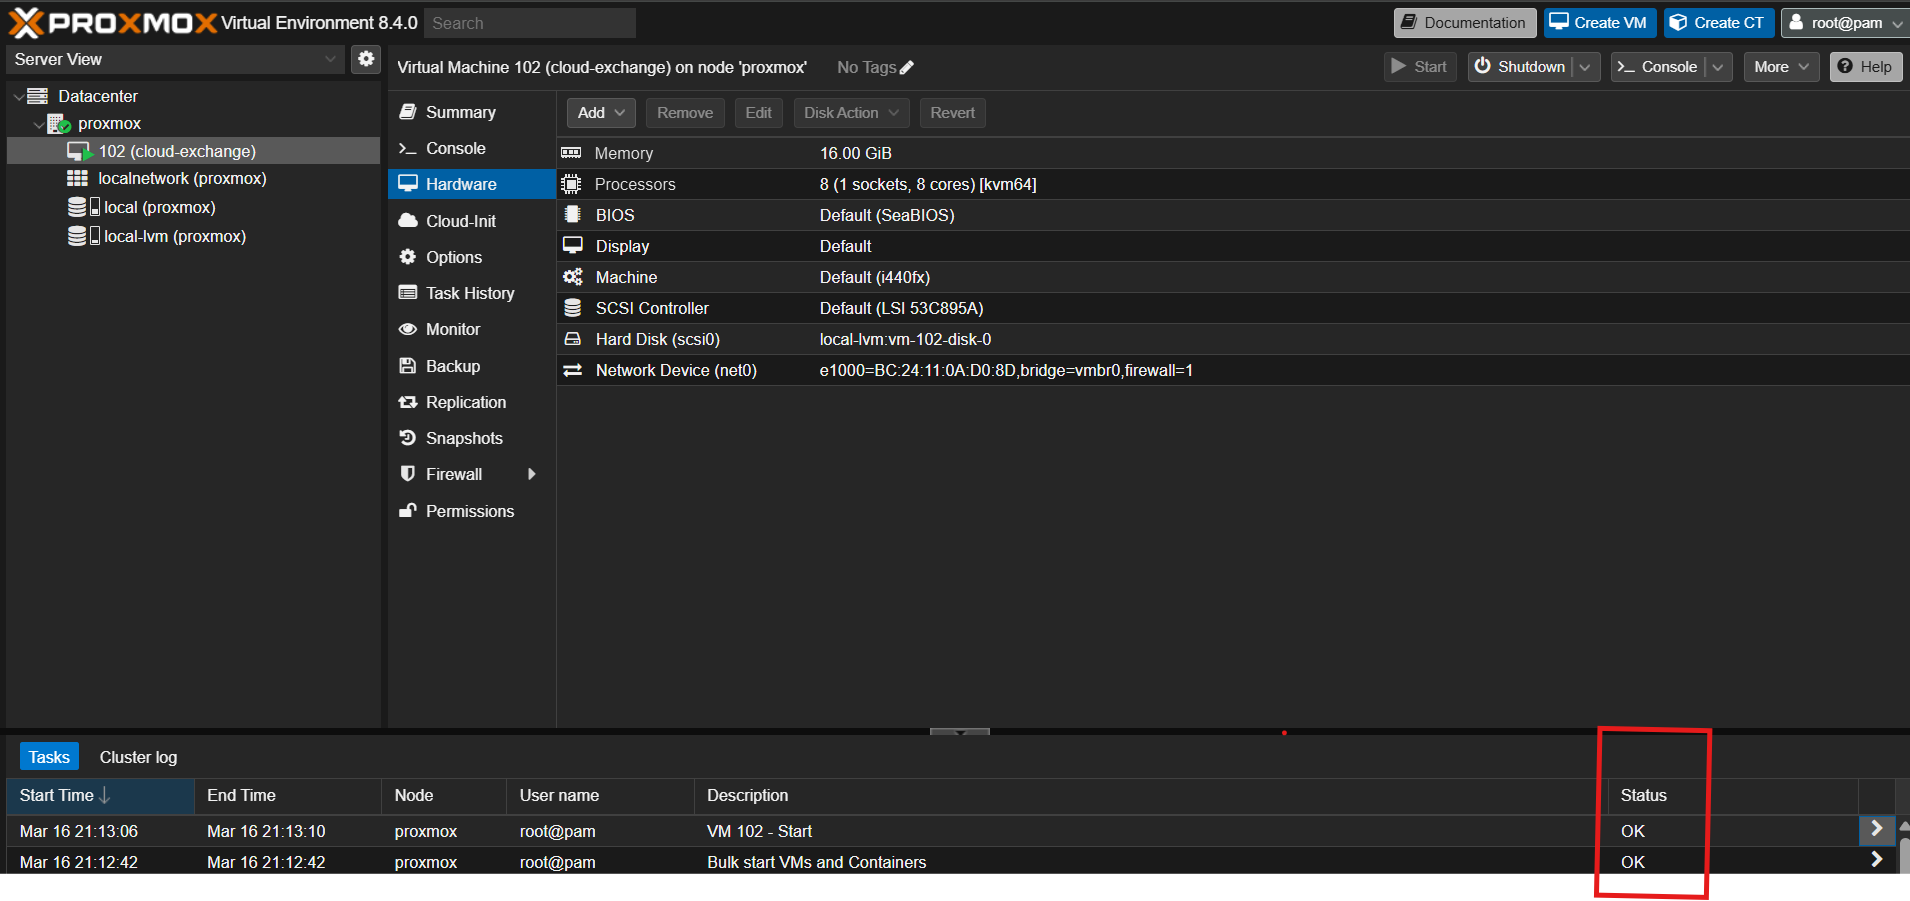
- Click Console.
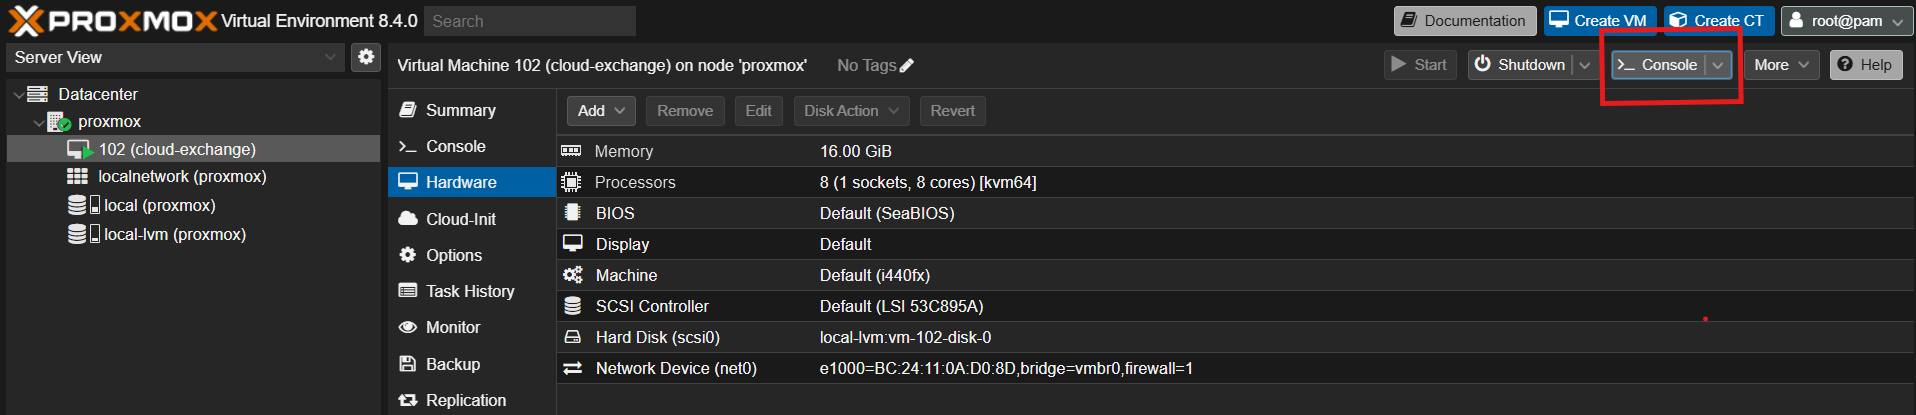
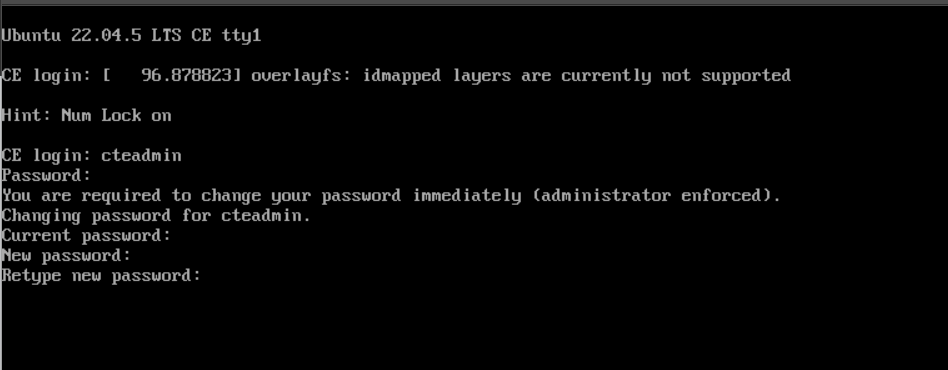
- This will open the shell to enter the Login and Password.
CE Login: cteadmin
Password: Cl0ud3xc4ang3!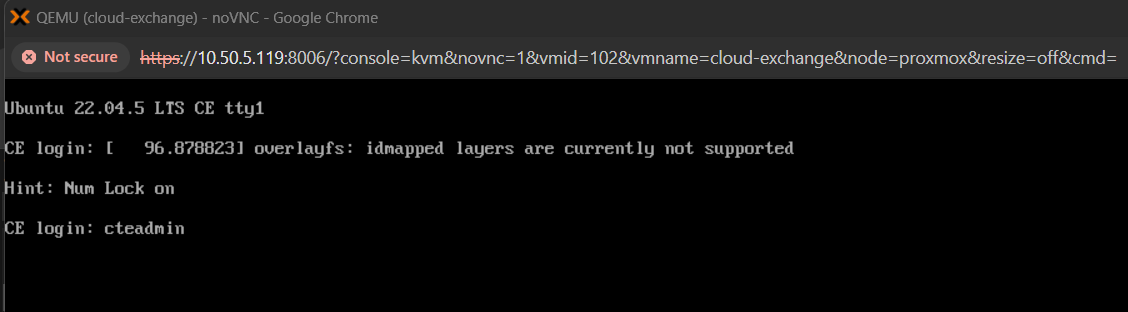
- Go to the Cloud Exchange directory:
cd /opt/cloudexchange/cloudexchange/
- Copy and edit the
cloudexchangeconfig file.sudo cp cloudexchange.config.example cloudexchange.config sudo vi cloudexchange.config
Add a Maintenance Password and JWT SECRET.
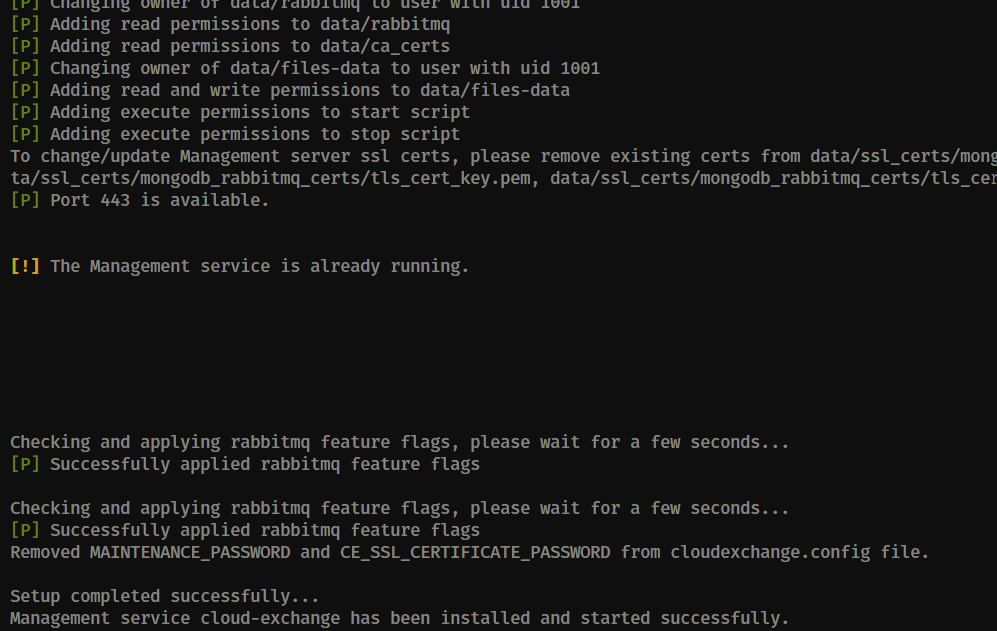
- Execute the setup script.
sudo python3 ./setup
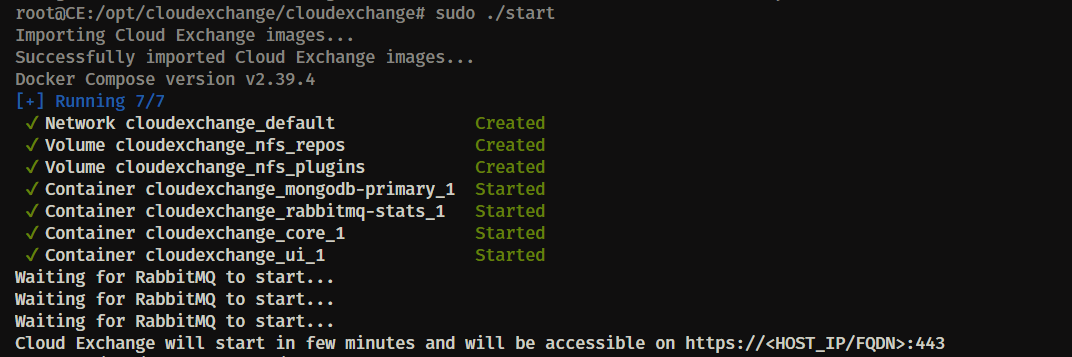
- Launch Cloud Exchange.
sudo ./start
- Wait for 5-10 minutes, and then access Cloud Exchange using the IP address of VM. (https://<ip>).
Default User Login
By default, a single user is created with administrative capabilities with these credentials:
Username: admin
Password: admin
You need to have Administrator level access to the application. You will have write access, and will be able to create new users as well.
On the first login, you will be required to change these credentials. After that, log in using your new credentials.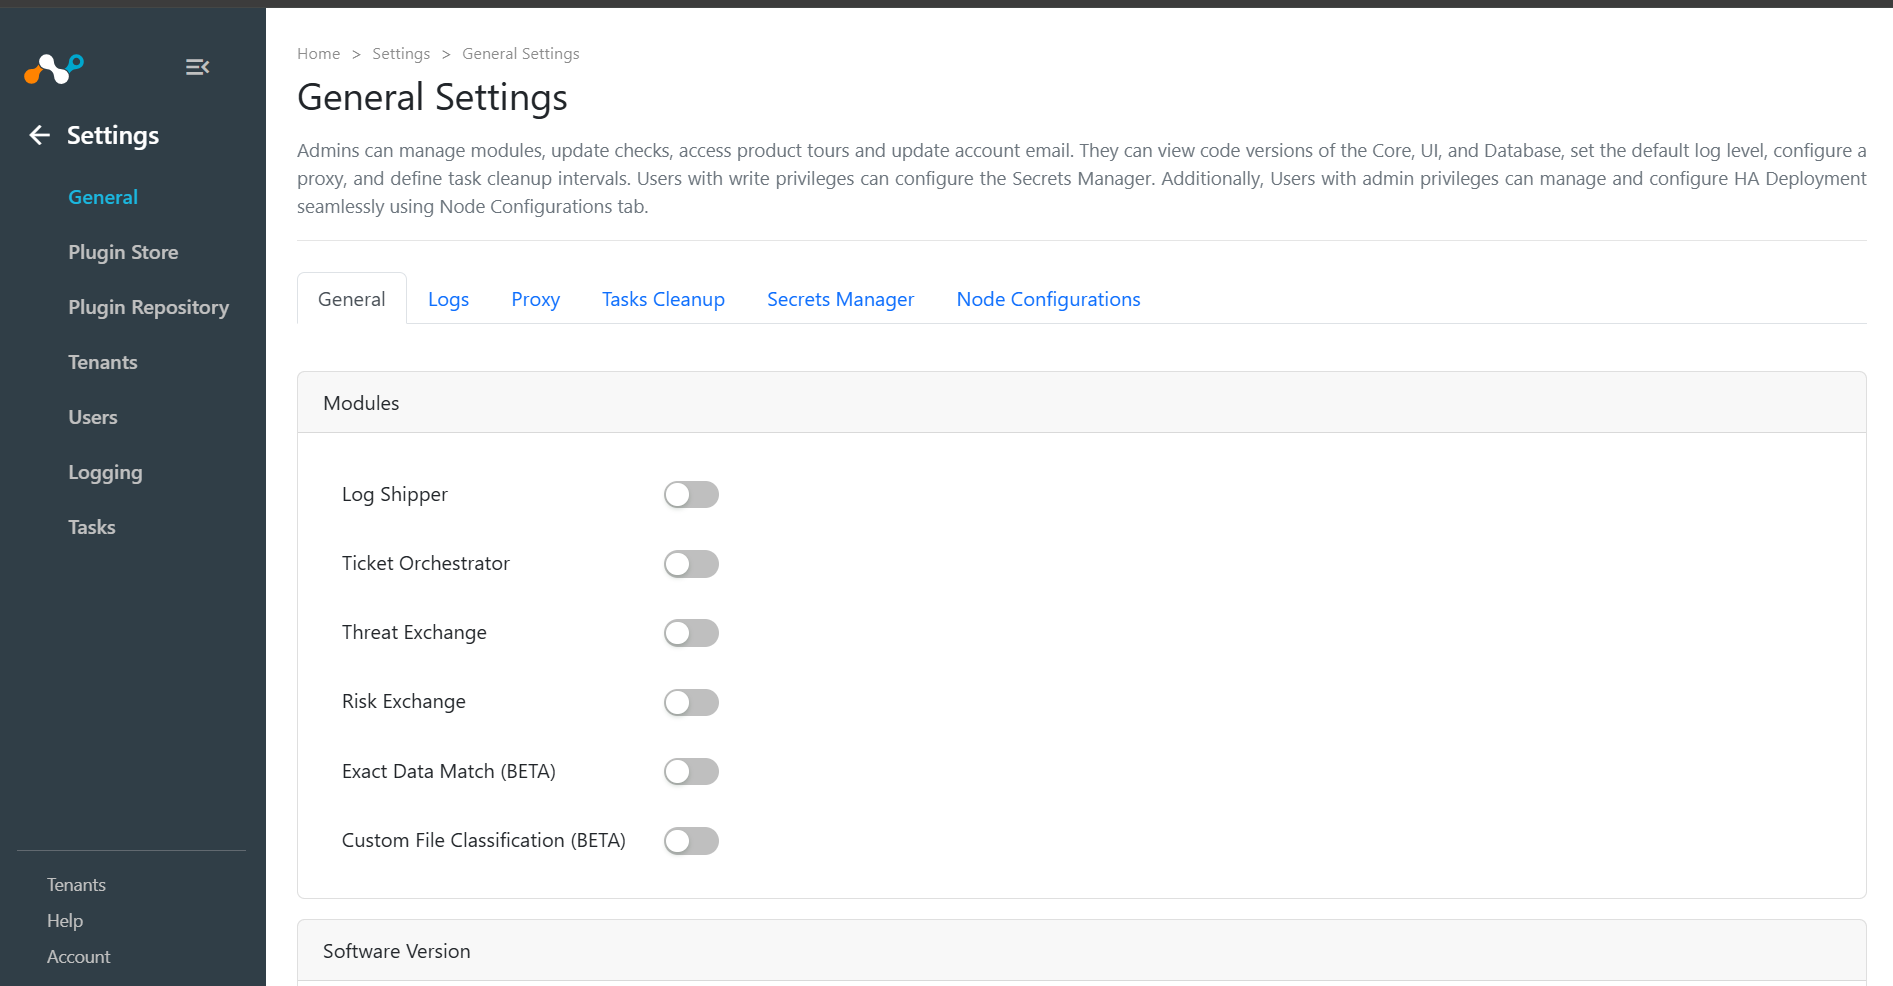
High Availability (HA) Setup Guide for Cloud Exchange on Linux Nodes with Azure Blob Storage
This section explains how to configure a High Availability (HA) environment for Cloud Exchange on Linux nodes using Azure Blob Storage as the NFS (Network File System) for shared storage.
Cloud Exchange System Requirements are present at:
- /en/cloud-exchange-kb-articles#prerequisite-for-ha-deployment-on-linux/
- /en/cloud-exchange-kb-articles#prerequisite-for-ha-deployment-on-linux
Prerequisites
System Requirements for HA Nodes
- 16 CPU CORES (Compute Intensive F16s series)
- 32 GB RAM
- 120 GB Available free disk space where CE will be installed; for example:
/home/root/ - 20 GB free space at
/var/libfor container storages.
NFS Setup with Azure Blob Storage
Network Configuration
Linux machines will be treated as HA nodes, and all nodes along with Storage accounts should be in the same Virtual network/subnet and same Azure region/zone.After configuring NFS File shares, refer to the steps below for Mount the NFS share.
Configure Cloud Exchange High Availability (HA)Validate Prerequisites
- Check Required Ports: Ensure the following ports are open and available on each node:
4369 RabbitMQ Communication Port 5672 AMQP Communication PORT 15672 RABBITMQ Administration Console 25672 RabbitMQ Internal Port 35672 Used FOR CLI Communications 27017 MongoDB Port 443 Service Health Check - Network Configuration: The Virtual Network should be one across all Nodes.
- Validate RAM, Disk space, and CPU.
sudo df -h
sudo free -h
sudo nproc - Git package, curl, and zip package:
sudo yum install -y git curl zip
- Install nfs-utils.
sudo yum install -y nfs-utils
- Python3 along with pip.
sudo yum install -y python3 python3-pip python3-devel
- Podman and podman-compose (Ref: https://podman.io/docs/installation#rhel8 )
sudo yum module enable -y container-tools:rhel8
sudo yum module install -y container-tools:rhel8
sudo yum install -y podman-plugins
sudo pip3 install podman-compose
sudo chmod +x /usr/local/bin/podman-compose
sudo ln -s /usr/local/bin/podman-compose /usr/bin/podman-compose - Check Podman and podman-compose version:
podman-compose —-version
podman –-version - Required python packages:
pip3 install "pyyaml>=6.0.0"
pip3 install "python-dotenv>=0.20.0,<=1.0.0"
pip3 install "pymongo>=4.1.1,<=4.3.3
Configure NFS In Azure Blob Storage
Mount NFS Storage in Each Nodes
- Go to NFS File Share Overview.

- Create a mounting directory as mentioned in mount Path (Also obtained from NFS FIle share overview guide) using this command:
sudo mkdir -p <mount_path>

Edit the/etc/fstabfile and the mounted configuration as mentioned below:cestorageha.file.core.windows.net:/cestorageha/shared-storage-nfs /mount/cestorageha/shared-storage-nfs nfs default 0 0cestorageha.file.core.windows.net:/cestorageha/shared-storage-nfswill be the source NFS directory present at the Azure Blob Storage NFS File share which will be obtained from sample command presents at Home > Respective Storage account > File shares > Newly created NFS File share > Overview./mount/cestorageha/shared-storage-nfswill be the mount path and created directory.- The other remaining part is NFS Configuration.

- Run this command:
sudo mount -a
Download the Installation Package
On each node, download the Cloud Exchange installation package using this command:
git clone https://github.com/netskopeoss/ta_cloud_exchange
Run the Setup Script on the Primary Node
Go to the Cloud Exchange directory. On the primary node, run the setup script with this command:
sudo ./setup
Run the Setup Script in the Secondary Nodes
On each secondary node, go to the Cloud Exchange directory. Run the setup script using the following command, replacing <mounting_dir> with the path to your NFS mounting directory:
sudo ./setup --location <mounting_dir>
Enable the CSV index
- On each node, edit the Podman Compose HA configuration file to enable CSV indexing:
$ vi podman-compose-ha.yml
- Locate the core section and add the following environment variable to enable network event streaming:
ITERATOR_EVENT_NETWORK=stream_network_events_rollsroyce
Update the RabbitMQ and MongoDB Tags
- RabbitMQ:
index.docker.io/
For each node, open the
podman-compose-ha.ymlfile.$ vi podman-compose-ha.yml
Update the RabbitMQ and MongoDB service image tags as follows:
- MongoDB:
index.docker.io/
Update the Core and UI Tags
- Go to NFS storage.
- Edit the
.envfile:$ vi config/.env
- Update the CORE_TAG and UI_TAG variables as follows.
CORE_TAG=crestsystems/cloudexchange:core-5.0.1-csv-hotfix
UI_TAG=crestsystems/cloudexchange:ui-5.0.1-csv-hotfix
Backup podman-compose-ha.yml
On each node, create a backup of the podman-compose-ha.yml file:
$ cp podman-compose-ha.yml podman-compose-ha.yml.backup
Start Cloud Exchange on the Primary Node
- Run the start script on the primary node:
$ sudo ./start
- Wait for the Migration completed message before proceeding to the next step.
Start Cloud Exchange on Secondary Nodes
After you receive the Migration completed message in the primary node, then execute the start script in the remaining nodes.
$ sudo ./start
Upload and Configure the Azure Sentinel Plugin
- Go to Settings > Plugin Repository in CE and click on upload plugin (⬆) button.
- Select the Zip file which is shared through the Support Case and click on the upload button.

- After the plugin is uploaded successfully, go to Settings > plugins to configure the uploaded plugin with the version 3.0.2.

Auto start Cloud Exchange when a RHEL machine reboots
Users can follow below steps to start Cloud Exchange podman containers automatically when the machine restarts.
Create a systemd Service File
Create a new systemd service file for Cloud Exchange using a text editor like nano or vim.
$ sudo nano /etc/systemd/system/netskope-cloud-exchange.service
2. Add the Service Configuration
Paste the following configuration into the file.
Remember to replace <ta-cloud-exchange-path> with the absolute path to your cloud_exchange directory.
[Unit]


Description=Cloud Exchange Podman Containers


After=network.target


[Service]


Type=oneshot


RemainAfterExit=yes


WorkingDirectory=<ta-cloud-exchange-path>


ExecStart=<ta-cloud-exchange-path>/start


ExecStop=<ta-cloud-exchange-path>/stop


TimeoutStartSec=0


[Install]


WantedBy=multi-user.target
Save the file and exit the editor.
If you’re using nano, press Ctrl+X, then Y and Enter.
If you’re using VIM, press ESC, then :wq! and Enter.
3. Save and Reload systemd
Reload the systemd daemon to make it aware of the new service file.
$ sudo systemctl daemon-reload
4. Enable the Service
Enable the service to start automatically on every boot.
$ sudo systemctl enable netskope-cloud-exchange.service
You should see a confirmation that a symbolic link has been created.
Now when the machine restarts, it will execute the start script of Cloud Exchange.
How to Identify your Cloud Exchange Deployment Type
There are multiple ways to identify the current Cloud Exchange deployment type:
- Using the Cloud Exchange UI
- On the Cloud Exchange home page, go to System Status > System Specifications and check the Deployment Type and Flavor fields. Explore the Dashboards – Netskope Knowledge Portal
- Using the
.envfile- Navigate to the CE working directory and run the following command:
grep '^CE_AS_VM=' .env - If the output is
CE_AS_VM=False, the deployment type is Containerized Deployment. - If the output is
CE_AS_VM=True, the deployment type is Cloud Exchange as a VM Deployment (CEasVM).
- Navigate to the CE working directory and run the following command:
- Checking the SSH username
- If you are using the
cteadminuser, the deployment type is Cloud Exchange as a VM Deployment (CEasVM). - If you are using any username other than
cteadmin, the deployment type is Containerized Deployment.
- If you are using the
- Checking the CE working directory
- If the CE working directory is
/opt/cloudexchange/cloudexchange, the deployment type is Cloud Exchange as a VM Deployment (CEasVM). - If the working directory is different from
/opt/cloudexchange/cloudexchange, the deployment type is Containerized Deployment.
- If the CE working directory is
Cloud Exchange Deployment Guide for SELinux Disabled, Permissive, and Enforcing Modes
Cloud Exchange Installation with SELinux Disabled
Cloud Exchange is not officially tested with SELinux enabled. To avoid installation, upgrade, or runtime issues, Netskope recommends disabling SELinux before deploying or upgrading Cloud Exchange.
Verify SELinux Status
Run the following command:
sestatus
If the output shows:
SELinux status: enabled
proceed with the steps below.
Stop Cloud Exchange Services
Navigate to the Cloud Exchange installation directory and stop all services:
./stop
Disable SELinux Permanently
Edit the SELinux configuration file:
sudo vi /etc/selinux/config
Modify the following parameter:
SELINUX=disabled
Save and exit the file.
Reboot the Server
Apply the configuration change:
sudo reboot
Verify SELinux is Disabled
After the server restarts, run:
sestatus
Expected output:
SELinux status: disabled
Start Cloud Exchange
Go to the Cloud Exchange installation directory and start the services:
./start
Validate Service Status
Verify that all Cloud Exchange containers and services are running successfully.
Cloud Exchange Installation with SELinux Permissive Mode
This section explains how to run CE on a RHEL 9.x standalone deployment. SELinux Permissive Mode allows SELinux to remain enabled while logging policy violations instead of enforcing them. This mode can be used when disabling SELinux is not permitted by organizational policy.
Verify Current SELinux Status
sestatus
Stop Cloud Exchange Services
Go to the Cloud Exchange installation directory:
./stop
Set SELinux to Permissive Mode
Temporarily change SELinux to permissive mode:
sudo setenforce 0
Verify:
sestatus
Expected output:
Current mode: permissive
Run Cloud Exchange Setup
Execute the setup script using:
./setup --ignore-failures
Start Cloud Exchange
./start
Validate Service Status
Verify that all Cloud Exchange containers and services are running successfully.
Cloud Exchange Installation with SELinux Enforcing Mode
Cloud Exchange can be deployed on RHEL 9.x systems running SELinux in Enforcing Mode. However, additional SELinux context modifications are required.
Important
Custom SELinux policies may impact Cloud Exchange functionality. Only the default SELinux policy is supported.
Verify SELinux Status
sestatus
Ensure SELinux is enabled and operating in:
Current mode: enforcing
Stop Cloud Exchange Services
Navigate to the Cloud Exchange installation directory:
./stop
Configure Required SELinux Context
Before running the setup, apply the following SELinux context:
chcon -t bin_t /Install_Path_of_CloudExchange/start_management_server
Note: Replace the command with your actual Cloud Exchange installation path. If you are unsure of the installation path, run the following command:
find / -name "ta_cloud_exchange" 2>/dev/null
Run the Cloud Exchange Setup
./setup --ignore-failures
Configure Mounted Volume Permissions
Apply the required SELinux context to the Cloud Exchange data directory:
chcon -Rt svirt_sandbox_file_t ./data/
This allows containers to read and write to mounted volumes.
Start Cloud Exchange
./start
Validate Service Status
Verify all Cloud Exchange containers and services are running successfully.
How to Update Network Configurations (IP, Subnet, Gateway, or DNS) on Linux Hosts (CE as a VM)
This article provides generic, step-by-step guidance on how to update network configuration parameters on a Linux server utilizing Netplan. Follow this process if you need to modify any of the following parameters due to a server migration, IP reallocation, or subnet change:
- Static IP Address
- Subnet Mask / Prefix
- Default Gateway
- DNS Nameservers
Prerequisites
- Administrative privileges (sudo or root access) on the host machine.
- Target networking configuration details ready (new IP address, gateway, subnet mask, and DNS IPs).
Configuration Steps
- List the interface configuration files in the directory:
ls -la /etc/netplan/

- Create a secure backup copy (replace netskope_netplan_sample.yaml with the exact filename discovered in your directory):
sudo cp /etc/netplan/netskope_netplan_sample.yaml /etc/netplan/netskope_netplan_sample.yaml.bak

- Open the target YAML configuration file using a preferred text editor:
sudo vi /etc/netplan/netskope_netplan_sample.yaml
- Modify the parameters under the respective interface name (e.g., eth0). You can dynamically update any specific network parameter value using the generic template structure below.
network:


 ethernets:


 eth0:


 addresses:


 - 10.168.67.57/24 # <-- Change IP Address and Subnet Mask here


 gateway4: 10.156.67.254 # <-- Change Default Gateway here


 nameservers:


 addresses:


 - 10.156.67.21 # <-- Change Primary DNS here


 - 10.156.67.22 # <-- Change Secondary DNS here


 search: []


 version: 2
Important Formatting Note: YAML files are strictly reliant on spaces for structural indentation. Do not use tabs. Ensure the bullet points (-) match the exact spacing structure shown above. - Restart the system network management engine.
sudo systemctl restart systemd-networkd
- Commit and activate your changes.
sudo netplan apply
- Run the following verification commands to ensure the operating system has absorbed the new network targets.
ip a


ip route


cat /etc/resolv.conf


Upgrades, Migrations, and Lifecycles
Upgrade Steps for Cloud Exchange v3.x or v4.x Containerized to Cloud Exchange v5.0.1 Containerized
Important
Contact your SE/AM if you have questions regarding CE installation, deployment, configuration, and upgrade/migration.
Use the upgrade method if the host machine/OS is unchanged, and you have GitHub and docker hub connectivity to get the latest upgrade package.
If the host machine is getting changed, then you should use the migration method. Currently, If you want to use CE as a VM, then only migration is supported since you will be deploying the new host machines via OVA/AMI/VHDX. If you are moving from standalone to HA, you should also use the migration method because you will need to set up multiple host machines as per the HA requirement.
Make sure to take a backup before proceeding for upgrade.
Prerequisites
- Before initiating an upgrade or migration, ensure your instance meets the system requirements for Cloud Exchange.
- Ensure you have the maintenance password readily available, as it will be needed to complete certain steps in this process.
Important
If the maintenance password is lost, the data could not be retained.
Notes
Migration from HA to standalone is currently not supported. RabbiMQ data migration is not supported due to the change of queue type from Classic to Quorum queue.
Upgrade to 5.0.1
Upgrade to 5.0.1 Standalone
From 3.x or 4.x or 5.0.x Standalone
You should update all your Netskope tenants with a V2 token that has access to all the dataexport endpoints before proceeding with the upgrade.
- Before proceeding, ensure that all prerequisites have been met. Verifying these requirements in advance is essential to avoid potential issues during the process.
- Go to the existing ta_cloud_exchange directory with the docker-compose.yml file. Stop the Cloud Exchange containers.
sudo ./stop
- If the output of the ./stop command is ./stop: No such file or directory, execute the following command.
sudo docker compose down -v
- If the output of the ./stop command is ./stop: No such file or directory, execute the following command.
- If you have made any local changes to the docker-compose.yml file, reset those using (you might need sudo).
sudo git reset --hard
- Checkout Cloud Exchange v5.0.1.
sudo git checkout v5.0.1
- Pull the latest changes.
sudo git pull origin v5.0.1
- Execute the setup script.
sudo python3 ./setup
- Launch Cloud Exchange.
sudo ./start
- Checkout Cloud Exchange Main
sudo git checkout main
- Close all of your Cloud Exchange browser instances and log in again in Incognito mode, or clear the browser cache before logging in.
The Cloud Exchange UI is now accessible with the system’s IP: http(s)://<ip>.
Once your Cloud Exchange is up and running on version 5.0.1, you can proceed with the upgrade to version 5.1.1 by following the recommended upgrade steps.
Upgrade Steps for Cloud Exchange v5.0.1 or v5.1.0 Containerized to Cloud Exchange v5.1.1 Containerized
Important
Contact your SE/AM if you have questions regarding CE installation, deployment, configuration, and upgrade/migration.
Use the upgrade method if the host machine/OS is unchanged, and you have GitHub and docker hub connectivity to get the latest upgrade package.
If the host machine is getting changed, then you should use the migration method. Currently, If you want to use CE as a VM, then only migration is supported since you will be deploying the new host machines via OVA/AMI/VHDX. If you are moving from standalone to HA, you should also use the migration method because you will need to set up multiple host machines as per the HA requirement.
Make sure to take a backup before proceeding for upgrade.
Prerequisites
- Before initiating an upgrade or migration, ensure your instance meets the system requirements for Cloud Exchange.
- Ensure you have the maintenance password readily available, as it will be needed to complete certain steps in this process.
Important
If the maintenance password is lost, the data could not be retained.
Notes
Migration from HA to standalone is currently not supported. RabbiMQ data migration is not supported due to the change of queue type from Classic to Quorum queue.
Upgrade to 5.1.1 Containerized
Upgrade to 5.1.1 Containerized Standalone
From 5.0.1 or 5.1.0 Standalone
You should update all your Netskope tenants with a V2 token that has access to all the dataexport endpoints before proceeding with the upgrade.
- Before proceeding, ensure that all prerequisites have been met. Verifying these requirements in advance is essential to avoid potential issues during the process.
- Go to the existing ta_cloud_exchange directory with the docker-compose.yml file. Stop the Cloud Exchange containers.
sudo ./stop
- If the output of the ./stop command is ./stop: No such file or directory, execute the following command.
sudo docker compose down -v
- If the output of the ./stop command is ./stop: No such file or directory, execute the following command.
- If you have made any local changes to the docker-compose.yml file, reset those using (you might need sudo).
sudo git reset --hard
- Checkout Cloud Exchange 5.1.1.
sudo git checkout 5.1.1
- Pull the latest changes.
sudo git pull origin 5.1.1
- Execute the setup script.
sudo python3 ./setup
- Launch Cloud Exchange.
sudo ./start
- Checkout Cloud Exchange Main
sudo git checkout main
- Close all of your Cloud Exchange browser instances and log in again in Incognito mode, or clear the browser cache before logging in.
The Cloud Exchange UI is now accessible with the system’s IP: http(s)://<ip>.
Once your Cloud Exchange is up and running on version 5.1.1, you can proceed with the upgrade or migration to the latest version by following the recommended upgrade and migration steps.
Upgrade Steps for Cloud Exchange v5.0.1 or v5.1.0 VM Standalone Deployment to Cloud Exchange v5.1.1 VM Standalone Deployment
Make sure to take a backup before proceeding for upgrade.
- Before proceeding, ensure that all prerequisites have been met. Verifying these requirements in advance is essential to avoid potential issues during the process.
- Go to cloudexchange directory and stop the standalone deployment.
cd /opt/cloudexchange/cloudexchange
sudo ./stop - Load the Cloud Exchange public key as a trusted GPG key. Note that when upgrading from a standalone to a high-availability (HA) deployment, the existing standalone node will serve as the primary node in the HA setup.
curl -fsSL https://cloud-exchange-store.s3.us-east-1.amazonaws.com/cloudexchange/upgrade-packages/cloud-exchange-public.gpg | sudo gpg --dearmor -o /etc/apt/trusted.gpg.d/cloud-exchange.gpg
- Add an s3 URL as the deb package source.
echo "deb https://cloud-exchange-store.s3.us-east-1.amazonaws.com/cloudexchange/upgrade-packages stable main" | sudo tee /etc/apt/sources.list.d/cloud-exchange.list
- Update the sources.
sudo apt update
- Upgrade the cloud exchange and wait for the process to be completed.
sudo apt install cloud-exchange=5.1.1-2
Notes
Before running Step 7, ensure all prerequisites are met for the targeted version.
- Execute the setup script using the below command.
sudo python3 ./setup
- Execute the start script using the below command.
sudo ./start
- Close all of your Cloud Exchange browser instances and log in again in Incognito mode, or clear the browser cache before logging in.
The Cloud Exchange UI is now accessible with the system’s IP: http(s)://<ip>.
Once your Cloud Exchange is up and running on version 5.1.1, you can proceed with the upgrade or migration to the latest version by following the recommended upgrade and migration steps.
Upgrade an Underlying OS of Cloud Exchange on a VM
To upgrade Cloud Exchange on a VM from Ubuntu 20.04 to Ubuntu 22.04, perform the steps after meeting the listed prerequisites. The steps will require reboot of Cloud Exchange as VM machine hence plan the upgrade accordingly. The steps are divided into two parts: before reboot and doing the reboot.
Prerequisites
- You should have sudo privileges to run the commands in the script.
- Internet Connectivity for the following URLs:
- Ubuntu Official Repositories:
- Additional Sources:
- Ubuntu Release Upgrade Servers:
- Python Package Index (PyPI):
- Root credentials are required to upgrade underlying OS from 20 to 22. Below are the root credentials for OVA.
- Username: root
- Password: M5#w6V+.T^8gv?%,
Before Rebooting
Setting Up Non-Interactive Mode
The script starts by setting the environment variable to ensure that no interactive prompts interfere with the execution.
cd /opt/cloudexchange/cloudexchange
sudo ./stop
export DEBIAN_FRONTEND=noninteractive
Disabling Additional APT Sources
sudo sed -i 's/^/#/' /etc/apt/sources.list.d/*.list
Updating and Upgrading the System
sudo apt update
sudo apt-get -o Dpkg::Options::="--force-confold" -o Dpkg::Options::="--force-confdef" -y upgrade
sudo apt-get -o Dpkg::Options::="--force-confold" -o Dpkg::Options::="--force-confdef" -y dist-upgrade
sudo apt autoremove -y
Preparing for Release Upgrade
sudo apt install -y update-manager-core
Rebooting the System
sudo reboot
Performing Distribution Upgrade
export DEBIAN_FRONTEND=noninteractive
sudo do-release-upgrade -f DistUpgradeViewNonInteractive
Fixing Incomplete Package Configurations
sudo apt update
sudo dpkg --configure -a
Installing Python Packages
sudo pip3 install "pyyaml>=6.0.0"
sudo pip3 install "python-dotenv>=0.20.0,<=1.0.0"
sudo pip3 install "pymongo>=4.6.3,<=4.7.3"
Re-enabling APT Sources and Final Upgrade
sudo sed -i -e 's/^#//' -e 's/focal/jammy/g' /etc/apt/sources.list.d/*.list
sudo apt update
sudo apt upgrade -y
sudo apt autoremove -y
Reboot the System
sudo reboot
Migrate existing Cloud Exchange from one machine to another
If you are using Containerized standalone and migrate to another Containerized standalone deployment.
- Stop the container.
sudo ./stop
- Create a zip file for Cloud Exchange folder.
sudo zip -r ce_backup.zip ta_cloud_exchange
- Transfer ce_backup.zip folder to new machine
- Unzip the folder.
unzip ce_backup.zip
- Run Setup script.
- sudo ./setup
- Start the container.
sudo ./start
Deprecation for in-tenant EDR integration and transition to Cloud Exchange for all EDR integrations.
Netskope will now only support Endpoint Detection and Response integrations with Netskope Threat Exchange. The in-tenant EDR integration will no longer be available after December 1, 2025.
With the introduction and continuous improvement of Cloud Exchange it is now the more advanced platform for EDR and threat intelligence integrations.
Netskope Cloud Threat Exchange (CTE) is part of Cloud Exchange which allows to easily and securely share threat data like malicious URLs and file hashes between their existing security tools.
The Threat Exchange module supports integrations with multiple third-party security vendors.
With CTE we can automatically send and receive threat data in near real-time, improving protection for endpoints, firewalls, web gateways and cloud security tools.
Get started with EDR Integrations in Cloud Exchange
1. To deploy Cloud Exchange, you’ll need a dedicated system (VM). Cloud Exchange supports deployment on multiple platforms. For deployment guide click here
2. After deployment, you can access the Cloud Exchange web console where you can enable the Cloud Threat Exchange (CTE) module. Refer Enable modules for more.
3. Configure your Netskope tenant
4. Start using the Threat Exchange module.
Business Rules in Threat Exchange : Business rules determine what data gets shared. You can customize these rules based on specific fields within the threat data. Here’s an example of a business rule.

Illumio Plugin for Threat Exchange Module Deprecation
The Illumio plugin for the Threat Exchange Module in Netskope Cloud Exchange will be deprecated around mid-year 2026. Review this document to learn how to retain Illumio support through Risk Exchange.
Recommended Replacement
Users currently leveraging this plugin for their Threat Exchange use cases should migrate to the Illumio plugin for Risk Exchange to maintain functionality.
Workflow Example: Fetching Workloads to Update Private Apps
If you previously used the Threat Exchange Illumio plugin to fetch workloads (IP Addresses, Hostnames) and update them in Private Apps via the Netskope Threat Exchange plugin, follow this new workflow using the Risk Exchange module:
- Configure the Netskope Risk Exchange plugin. This replaces the Netskope Threat Exchange plugin. The plugin guide is here.
- Configure the Illumio plugin for Risk Exchange. This replaces the Threat Exchange Illumio plugin. The plugin guide is here.
- Establish the required configurations for the Add hosts to Private App action from the Risk Exchange plugin to resume your workflow. Details are explained in the aforementioned plugin guides.
Note
The Illumio plugin for Risk Exchange doesn’t support IoC Retraction.
For any questions about this migration or workflow, contact Netskope Support for more information.
Microsoft Azure Sentinel Plugin for Log Shipper Module Deprecation
Microsoft has announced the deprecation of Azure Monitor Data Collector APIs for custom logs. If you use the existing Netskope Cloud Exchange Microsoft Azure Sentinel plugin, your configuration depends on these deprecated Data Collector APIs and will remain functional only while Microsoft continues to support the underlying APIs. You should plan to migrate to the new Microsoft Azure Log Analytics Workspace plugin, which uses Microsoft’s latest Log Ingestion APIs.
For the configuration/migration of Microsoft Azure Log Analytics Workspace plugin, please refer to the following documentation Microsoft Azure Log Analytics Plugin for Log Shipper.
Refer to the Microsoft’s Deprecation Announcement from here.
What is changing?
Microsoft is moving from the legacy Data Collector API model to the newer Log Ingestion API model for custom log ingestion into Azure Monitor Logs and Microsoft Sentinel-backed Log Analytics workspaces.
To align with Microsoft’s supported architecture, Netskope is introducing a new Cloud Exchange Log Shipper destination plugin named Microsoft Azure Log Analytics Workspace. This plugin is built on Microsoft’s latest Log Ingestion APIs and provides you with a unified ingestion experience for both:
- Existing Microsoft Azure Sentinel use cases
- Current Microsoft Azure Monitor integration workflows
Customer Impact
- If you use the existing Microsoft Azure Sentinel plugin, it will continue to function as long as Microsoft supports the underlying Data Collector APIs.
- After Microsoft fully retires the deprecated APIs, support for your current Microsoft Azure Sentinel plugin configuration will end.
- You should migrate to the new Microsoft Azure Log Analytics Workspace plugin before Microsoft’s API retirement date.
- You control your migration timeline and can transition at your own pace before API retirement.
Recommended Action
- Review your current Cloud Exchange Log Shipper configurations that use the Microsoft Azure Sentinel plugin.
- Plan your migration to the new Microsoft Azure Log Analytics Workspace plugin.
- Validate your target Log Analytics workspace, Data Collection Endpoint, Data Collection Rule, table configuration, and Microsoft Entra application permissions required for Log Ingestion API-based ingestion.
- Test ingestion with the new plugin in your non-production or controlled configuration.
- Move your production log forwarding to the new plugin before .
The following tables help you compare the available Azure destination options and understand which plugin best fits your ingestion requirements. Use these comparisons to identify whether you need a unified table, separate tables by data type, current Microsoft ingestion APIs, or support for specific log formats such as JSON, CEF, Alerts, Events, and WebTx.
Table Configuration Options Comparison
| Option | Log Analytics | Azure Monitor | Azure Sentinel |
|---|---|---|---|
| Send everything into one table | ✅ | ✅ | ❌ |
| Send each data type into a separate table (Alerts / Events / WebTx) | ✅ | ❌ | ✅ |
| Option to choose which data types to ingest | ✅ | ❌ | ❌ |
| One column per Netskope field | ✅ (in per-data-type mode) | ❌ | ❌ |
Comparison Summary
| Capability | Log Analytics | Azure Monitor | Azure Sentinel |
|---|---|---|---|
| Uses Microsoft’s current ingestion API | ✅ | ✅ | ❌ uses the deprecated Data Collector API |
| Sends Alerts | ✅ | ✅ | ✅ |
| Sends Events | ✅ | ✅ | ✅ |
| Supports new Netskope alerts (Device, Content) | ✅ | ✅ | ❌ |
| Supports new Netskope event type (Client Status) | ✅ | ✅ | ❌ |
| Sends WebTx | ✅ | ❌ | ✅ |
| Supports CEF format | ✅ (for single table option) | ✅ | ❌ |
| Supports JSON format | ✅ (single table and per-table mode) | ✅ | ✅ |
| One unified table | ✅ | ✅ | ❌ |
| Separate tables per data type (Alert/Event/WebTx) | ✅ | ❌ | ✅ |
| Per-data-type field columns | ✅ | ❌ | ❌ |
| Latest authentication using Microsoft Entra application | ✅ | ✅ | ❌ |
Frequently asked questions
Q: Is the current Microsoft Azure Sentinel plugin being removed immediately?
A: No. Your current plugin will continue to function while Microsoft continues to support the underlying Data Collector APIs.
Q: When will support for the current Microsoft Azure Sentinel plugin end?
A: Support for your current Microsoft Azure Sentinel plugin configuration will end after Microsoft fully retires the deprecated Data Collector APIs. Microsoft has stated that these APIs will no longer be supported after .
Q: Which plugin should you use going forward?
A: You should use the new Microsoft Azure Log Analytics Workspace plugin for Azure Sentinel/Microsoft Sentinel and Azure Monitor log ingestion workflows.
Q: Does the new plugin support both Azure Sentinel and Azure Monitor workflows?
A: Yes. The Microsoft Azure Log Analytics Workspace plugin provides you with a unified ingestion experience for your existing Azure Sentinel use cases and current Azure Monitor integration workflows.
Q: Do you need to migrate immediately?
A: You can migrate at your own pace before Microsoft retires the deprecated APIs. However, Netskope recommends that you plan and validate your migration well before the retirement date to avoid ingestion disruption.
Final Recommendation/Guidance
You should treat the Microsoft Azure Log Analytics Workspace plugin as the forward-looking destination for Azure-based log ingestion from Cloud Exchange. Your existing Microsoft Azure Sentinel plugin configurations can remain in place during the transition period, but you should complete migration before Microsoft retires the Data Collector APIs to avoid service interruption.
References
For more details regarding the configuration of Microsoft Azure Log Analytics Workspace plugin, please refer to the following documentation here.
Steps to migrate Cloud Exchange to a New Storage Drive
This procedure explains how to move the existing Cloud Exchange installation to a newly added drive when the current storage is insufficient.
Prerequisites
- Take a full image backup of the Cloud Exchange server.
- Confirm the new drive is properly mounted.
- Ensure the new drive has sufficient storage and required permissions.
Example:
- Current CE directory:
/ta_cloud_exchange - New drive:
/newdrive
Migration Steps
- Go to the Cloud Exchange installation directory and stop the CE containers.
./stop - Move the complete Cloud Exchange directory to the new drive.
mv /ta_cloud_exchange /newdrive/ - Go to the new CE installation directory.
cd /newdrive/ta_cloud_exchange - Start Cloud Exchange.
./start
Wait approximately 3–4 minutes for all services to start, then verify the Cloud Exchange UI, confirm all existing configurations are available, ensure the required services/plugins are running, and validate the configured integrations.
Cloud Exchange Platform Administration and API Workflow
Proxy Configurations
PIP Proxy
Refer the global way of setting up proxy for pip: https://pip.pypa.io/en/latest/topics/configuration/#location
Find the configuration file: at /etc/pip.conf. Create a pip.conf file, if one is not present.
Example configuration:
[global]
proxy = http://<username>:<password>@<ip>:<port>
Any special characters in the proxy username/password needs to be URL-encoded.
A configured proxy can be verified using pip config list.
Ubuntu
To configure proxy settings for the APT package manager on Ubuntu systems, add the following configuration to /etc/apt/apt.conf. Create an apt.conf file if one is not present.
Example configurations:
Acquire::http::Proxy "http://USERNAME:PASSWORD@SERVER:PORT";
Acquire::https::Proxy "https://USERNAME:PASSWORD@SERVER:PORT";
Docker (For Ubuntu)
https://docs.docker.com/engine/daemon/proxy/#httphttps-proxy
RHEL
To configure proxy settings for YUM package managers on RHEL systems, add the following configuration to /etc/yum.conf. Create a yum.conf file if one is not present.
Example configurations:
proxy=http://SERVER:PORT
proxy_username=USERNAME
proxy_password=PASSWORD
RHEL with Podman
To configure a proxy in RHEL with Podman, run this command:
export HTTP_PROXY="http://<your.proxy.tld:port>"
export HTTPS_PROXY="http://<your.proxy.tld:port>"
export NO_PROXY="localhost,127.0.0.1,..."
Generate a V2 token with RBAC V3
Since the workflow for REST API V2 token provisioning is being deprecated, future token provisioning must be performed using the new service account creation and management process, which is integrated with RBAC V3.
Prerequisities
Authorized credentials to log into Netskope Tenant.
Generate a new V2 token with RBAC V3
- Log in to your Netskope tenant and go to Settings.

- Click Administration to expand the options.

- Click Administrators & Roles.

- Click Service Account.
- Enter a Service Account Name, select Netskope Cloud Exchange for the Role, and then provide the time for Generate token now with expiry. When finished, click Create.
- Make sure to copy the token as it will not be available after this modal pop-up is closed.
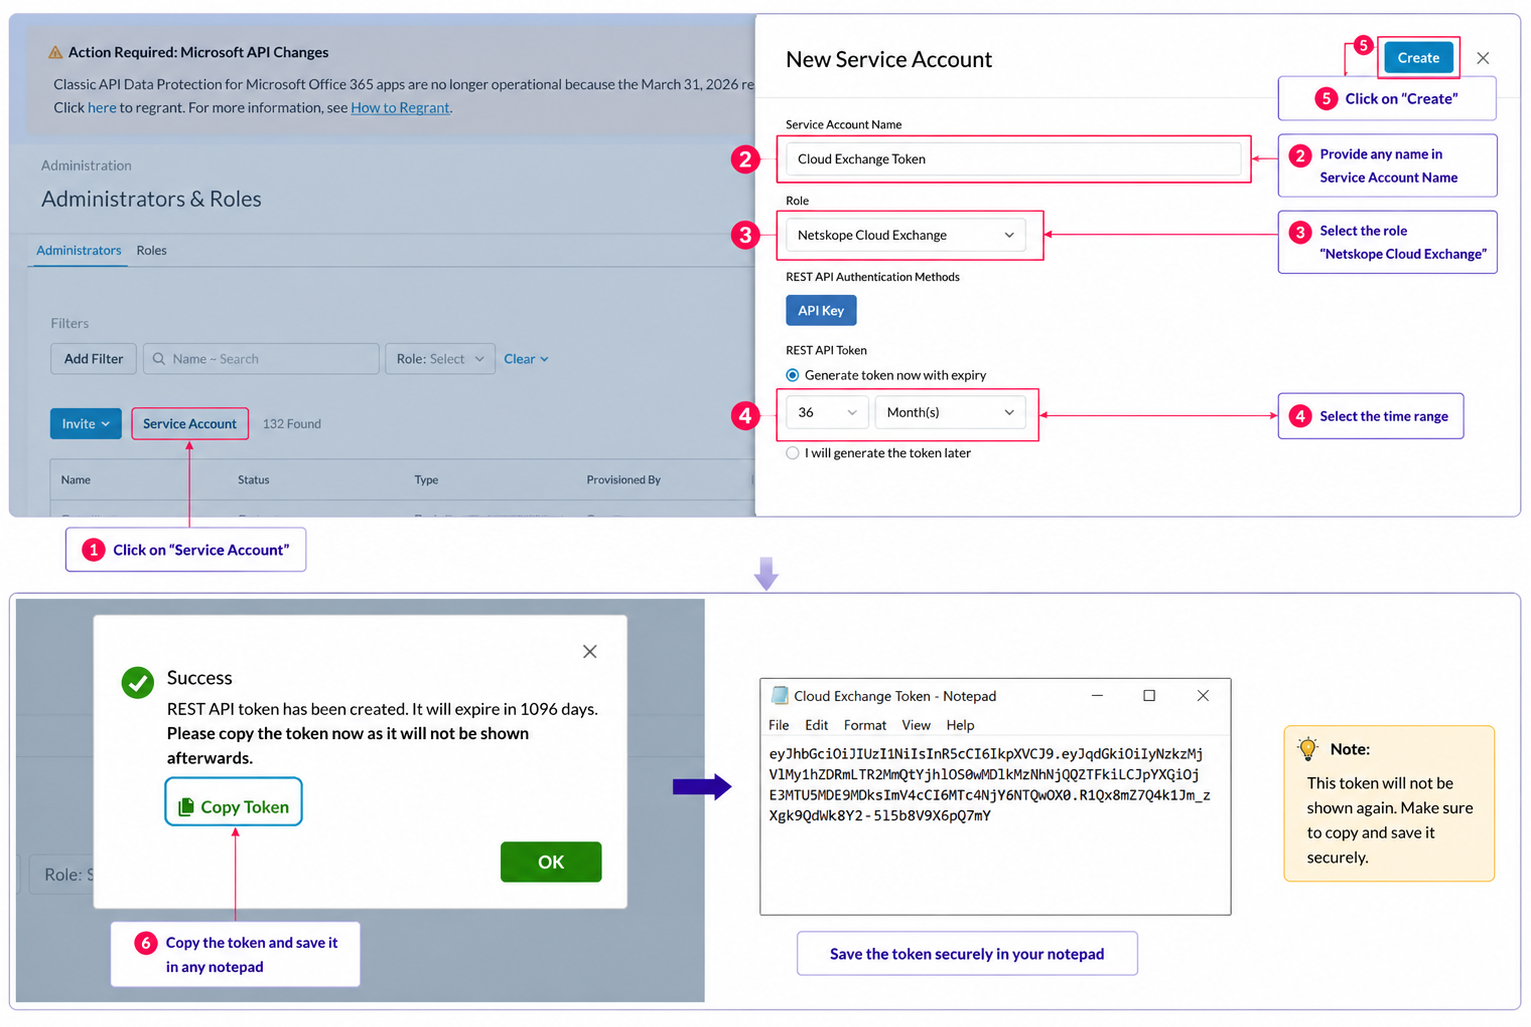
7. Navigate on the Cloud Exchange UI ( Home -> Settings -> Tenants)
8. Edit the configuration and Add your V2 Token

How to upload custom SSL certificate for secure UI access
This article provides a step-by-step guide for replacing the default SSL certificates in Cloud Exchange (CE) with custom CA-signed certificates. This process ensures secure HTTPS communication for the Cloud Exchange web interface.
Prerequisites
Before beginning, ensure you have the following:
- Backup: It is recommended to back up your existing certificate files before deletion.
- Certificate Files: A valid certificate in
.crtformat and its corresponding private key in.keyformat. - Terminal Access: SSH access to the Cloud Exchange host machine with
sudoprivileges.
Procedure
Upload and Locate Certificates
Transfer your custom certificate and key files to the Cloud Exchange host machine (using SCP, SFTP, or a similar method). Note the directory path where these files are stored.
Stop Cloud Exchange Services
# Navigate to Installation Directory
Move to the Cloud Exchange installation path. Typically located at: "ta_cloud_exchange/" or "/opt/cloudexchange/cloudexchange".

# Stop the containers
sudo ./stop
Clear Existing Certificates
- Navigate to the specific SSL directory and remove the old certificate files.
# Enter the SSL certificates directory
cd data/ssl_certs

# Remove old certificate and key
sudo rm -rf cte_cert.crt
sudo rm -rf cte_cert_key.key
Install New Certificates
- Copy your new certificate files into the
ssl_certsfolder and rename them to match the system’s expected naming convention.
# Copy the files

sudo cp <path/to/your/certificate.crt> .
sudo cp <path/to/your/certificate.key> .

# Rename the files: The system specifically looks for cte_cert.crt and cte_cert_key.key

sudo mv certificate.crt cte_cert.crt
sudo mv certificate.key cte_cert_key.key
Restart Cloud Exchange
# Navigate back to the Cloud Exchange directory.

cd ../..

# Start the containers

sudo ./start
Validation
- Open your browser and access to the Cloud Exchange UI.
- Click the lock icon in the address bar.
- Verify that the Certificate Information matches your newly uploaded custom certificate.
Changing the Cloud Exchange UI Port
This article provides step-by-step instructions on how to safely update the user interface (UI) port for Cloud Exchange. This process involves stopping the service, reconfiguring the configuration file using the provided template, and restarting Cloud Exchange.
Stop the Cloud Exchange Service
Before making any configuration changes, you must stop the currently running Cloud Exchange service. Run the following command in your terminal:
sudo ./stop
Remove the Old Configuration File
To ensure a clean configuration update, remove the existing cloudexchange.cofig file:
rm -rf cloudexchange.cofig
Create a New Configuration File from Template
Generate a fresh configuration file by copying the provided example template:
cp cloudexchange.cofig.example cloudexchange.cofig
Edit the Configuration File
Open the newly created configuration file in a text editor to update the port:
vi cloudexchange.cofig
Inside the file, locate the UI_PORT variable and modify it to your desired port number (the default is 443):
# Port number to use for the CE UI. Default 443
UI_PORT=<your_new_port_number>
Note: Save and close the file after making the change (in vi, press Esc, type :wq, and press Enter).
Run the Setup Script
Apply the new configuration changes by executing the setup script:
sudo python3 ./setup
Start Cloud Exchange
Once the setup is complete, start the Cloud Exchange service again to apply the new port settings:
sudo ./start
Verification
- Verify Port Allocation: Ensure that the new port you select is not already in use by another service on the host network.
- Accessing the UI: Remember to append the new port number to your URL when accessing the Cloud Exchange UI (e.g.,
https://<your-ip>:<new_port>).
Configuring Entra Attributes for Netskope Cloud Exchange Super Admin Access
Netskope Cloud Exchange supports role-based permissions that are mapped through custom Entra attributes assigned to users. Currently, some users are configured with the following attributes, which grant limited read/write access:
- netskope-ce-write
- netskope-ce-read
To elevate these users to Super Admin access, additional attributes must be added.
Required Entra Attributes for Super Admin Access
To grant a user full Super Admin permissions in Cloud Exchange, ensure all of the following attributes are configured on the user’s Entra profile:
| # | Attribute Name: |
| 1. | netskope-ce-write |
| 2. | netskope-ce-read |
| 3. | netskope-ce-admin |
| 4. | netskope-settings-write |
| 5. | netskope-ce-api |
All five attributes must be present. Omitting any one of them will result in reduced (non-Super Admin) permissions.
Verification
Confirm the user can access all Cloud Exchange modules (e.g., Settings) without restriction.
Note
If a user is provisioned with the netskope-ce-admin role through Entra ID, they will be granted Administrator privileges within Cloud Exchange.
With this role, the user will have full administrative capabilities, including but not limited to:
- Enabling or disabling any Cloud Exchange modules.
- Creating, modifying, and managing user accounts within Cloud Exchange.
- Accessing and managing administrative settings that are not available to users with read-only or write-only permissions.
After the netskope-ce-admin role is assigned through Entra ID and the user signs in again, the corresponding administrative permissions will be automatically applied in Cloud Exchange.
Comparison between Cloud Exchange Log Streaming vs Event Streaming Client
Netskope provides multiple methods for delivering Transaction Events to downstream SIEM and analytics platforms. The two options covered in this document are Cloud Exchange using AWS/Azure Log Streaming and the Event Streaming Client (ESC).
Cloud Exchange with AWS/Azure Log Streaming
Architecture
Netskope Tenant
↓
AWS S3/SQS or Azure Blob/Queue
↓
Cloud Exchange
↓
Log Shipper
↓
SIEM / XDR / Data Lake
Prerequisites
- Netskope Log Streaming enabled.
- Cloud Exchange deployed.
- Tenant Plugin and Log Shipper configured.
- AWS or Azure storage infrastructure configured.
- Destination SIEM/plugin configured.
Configuration Summary
- Configure Netskope Log Streaming.
- For AWS, configure S3 and SQS. For Azure, configure Blob Storage, Event Grid and Storage Queue.
- Configure the AWS/Azure Log Streaming plugin in Cloud Exchange.
- Configure Log Shipper Business Rules.
- Configure the destination plugin and Log Delivery.
- Validate the data flow from Netskope to the SIEM.
Key Benefits
- Supports multiple downstream integrations.
- Provides centralized business-rule processing.
Considerations
- Requires AWS/Azure storage infrastructure.
- Has more components to manage and troubleshoot.
- Adds Cloud Exchange and Log Shipper processing layers.
Event Streaming Client (ESC)
Architecture
Netskope Tenant
↓
gRPC/TLS
↓
Event Streaming Client
↓
Syslog
↓
SIEM
Prerequisites
- Event Streaming Client entitlement.
- Supported Linux server (RHEL or Ubuntu).
- Docker or Podman.
- Outbound connectivity from the client to Netskope, including gRPC/TLS port 50051.
- Syslog connectivity from the client to the SIEM.
Configuration Summary
- Create the required API authorization.
- Create the Event Streaming Client.
- Install the client on the Linux server.
- Create the required output format (JSON, CEF or ELFF).
- Configure the SIEM destination.
- Configure Transaction Event Log Streaming.
- Validate event delivery.
Key Benefits
- Direct streaming architecture.
- No AWS/Azure storage or queue infrastructure is required.
- Simpler deployment and troubleshooting.
- Supports JSON, CEF and ELFF formats.
- Supports field customization.
- Well suited for high-volume Transaction Event delivery.
Considerations
- Primarily focused on event streaming rather than broader Cloud Exchange workflows.
- Does not provide Cloud Exchange Business Rules and plugin-based integration capabilities.
- Additional integrations may require separate solutions.
Feature Comparison
| Capability | Cloud Exchange + Log Streaming | Event Streaming Client |
|---|---|---|
| Cloud Exchange required | Yes | No |
| AWS/Azure storage required | Yes | No |
| Transaction Event support | Yes | Yes |
| Multiple destination integrations | Yes | Limited |
| Business Rules | Yes | No |
| Direct SIEM streaming | No | Yes |
| Infrastructure complexity | Higher | Lower |
| Operational overhead | Higher | Lower |
| High-volume Transaction Events | Good fit | Excellent fit |
Summary
For customers whose primary objective is to deliver Netskope Transaction Events directly to a SIEM, Event Streaming Client is generally the recommended architecture because it provides a simpler and more direct streaming path.
For customers already using Cloud Exchange for multiple integrations and workflows, Cloud Exchange with AWS/Azure Log Streaming remains a suitable option and provides greater integration flexibility.
Related Articles
Comparison between Netskope Azure Log Analytics Plugin vs. Codeless Connector Framework (CCF)
Netskope provides two approaches for sending Netskope Alerts and Events to Microsoft Sentinel:
- Cloud Exchange Azure Log Analytics Plugin: Uses Cloud Exchange as an intermediary log-shipping platform.
- Codeless Connector Framework (CCF): Provides a direct integration between Netskope and Microsoft Sentinel without requiring Cloud Exchange.
Both solutions can deliver Netskope security data to Microsoft Sentinel, but they differ in architecture, scalability, flexibility, and infrastructure requirements.
Key Differences
| Capability | Cloud Exchange – Azure Log Analytics Plugin | Codeless Connector Framework (CCF) |
|---|---|---|
| Architecture | Netskope → Cloud Exchange → Azure Log Analytics → Sentinel | Netskope → CCF → Sentinel |
| Cloud Exchange Required | Yes | No |
| Deployment | Requires Cloud Exchange infrastructure | Native Microsoft Sentinel integration |
| Event Capacity | Supports high-volume ingestion; capacity depends on CE sizing and configuration | 14.4M events/day/endpoint limit |
| Planning Capacity | ~75M events/day per event type can be used as a deployment planning reference | 14.4M events/day per endpoint limit |
| Filtering | Advanced filtering using Log Shipper Business Rules | Limited compared with Cloud Exchange |
| Data Transformation | Supported | Connector-defined |
| Table Management | Single Table or Per Data Type | Connector-defined |
| Multiple Destinations | Supported – CE can act as a centralized integration layer | Primarily Sentinel-focused |
| Infrastructure Management | Requires CE deployment and maintenance | Minimal infrastructure management |
| Best For | High-volume environments requiring flexibility and control | Simple, direct Sentinel integration |
Which One Should You Choose?
Cloud Exchange Log Analytics Plugin
Recommended when the organization requires:
- Higher-volume or complex ingestion requirements
- Advanced filtering and data control
- Multiple SIEM/SOAR integrations
- Flexible table and data-type management
- An existing Cloud Exchange deployment
Codeless Connector Framework
Recommended when the organization requires:
- A simple and direct Netskope-to-Sentinel integration
- No Cloud Exchange infrastructure
- Lower deployment and maintenance overhead
- Event volumes within the 14.4M events/day/endpoint limit
Summary
CF provides a simpler, direct integration with Microsoft Sentinel and eliminates the need for Cloud Exchange.
Cloud Exchange Azure Log Analytics Plugin provides greater flexibility and control over the ingestion pipeline and is better suited for organizations with higher-volume or more complex integration requirements.
Plugin Management and Module Configuration
Ingesting Historical data from Netskope with Cloud Exchange
In addition to real-time log forwarding, the Log Shipper module also supports pulling historical events or alerts, which is useful for scenarios requiring past data, such as SIEM outages, system recovery or gap analysis
When to Use Historical Log Pulling
Users may need to ingest historical events from their Netskope tenant due to:
- SIEM/environment outages causing data loss
- Recovery efforts following failures
- Other use cases requiring backdated event capture
Steps to Pull Historical Data for a Configured SIEM Mapping
- Go to Log Shipper Module > SIEM Mappings
- Identify the SIEM mapping for which you want to pull historical logs
- Click the second action button, labeled “Pull Historical Data” (refer to image below)
- In the pop-up window:
– Select the desired start and end date-time (in UTC)
– Click “Pull” to initiate the task - Once submitted Cloud Exchange will begin retrieving logs from the selected time window based on the chosen SIEM configuration.


Validate Pull Historical Data
- We can validate the same through logging section, as shown in below example
- The above logs indicate that the historical pull task completed successfully up to the specified date, along with the number of events/alerts ingested from the tenant.

- The Below debug log indicates initiation of historical sync, highlighting the timeframe.

Important Notes:
- Historical log pulling does not affect real-time ingestion for the SIEM mapping.
- This feature is not supported for CSV-based iterator mechanisms, including Web Transaction Logs and Client Status Events.
Include detailed Audit Data in SIEM Logs via Netskope Log Shipper
Netskope’s Log Shipper (CLS) module within the Cloud Exchange platform enables efficient forwarding of logs (e.g., audit events) to SIEM systems. By default, audit logs sent to SIEMs only contain high-level summaries of administrative actions such as “Inline policy deleted” but lack specific details about what exactly was modified.
These missing details reside in other fields called “Supporting Data” and “Details”, which is present in the original audit logs within the Netskope tenant but not included by default in the SIEM log mapping.

Example
The following is an example of the default SIEM output missing supporting details:
<14>September 15 08:19:45 netskopece CEF:0|Netskope|TESTs|NULL|audit|NULL|High|auditLogEvent=Deleted Inline Policy auditType=admin_audit_logs suser=[EMAIL_ADDRESS] timestamp=1747298327
Solution: Add “Supporting Data” and “Details” to Mapping
To include detailed information about the configuration changes, you need to manually add the required field to your audit event mapping in the Log Shipper.
Steps to Update the Mapping File
- In Cloud Exchange, go to the Log Shipper module.
- Disable the SIEM Plugin temporarily.
- Confirm the mapping file name currently used by the SIEM plugin.
- Go to Settings > Log Shipper > Mapping.
- Locate the mapping file and choose Clone or Edit (if it’s already custom).
- In the mapping editor, go to: Events > Audit > Extension.
- Add the following fields: “Supporting Data”, “Details”
- Save the changes to the mapping file.
- Return to the SIEM Plugin configuration:
- Update it to use the modified mapping file.
- Re-enable the SIEM Plugin.
Resulting Output
After updating the mapping, the SIEM log will now include detailed configuration data:
<14>September 15 08:30:25 netskopece CEF:0|Netskope|TESTs|NULL|audit|NULL|High|auditLogEvent=Deleted Inline Policy Supporting_Data={"data_type": "policy","data_values": ["Non-admin updates policy"]} auditType=admin_audit_logs suser=[EMAIL_ADDRESS] timestamp=1747298327
Additional Reference: For more detailed guidance on working with mapping files, refer to the official documentation: Create/Edit a Mapping File – Netskope Docs
How to configure the Log Source Identifier in Netskope Cloud Exchange?
The Log Source Identifier is a configurable attribute used to tag logs with a unique identifier, making it easier to differentiate between multiple log sources in your Security Information and Event Management (SIEM) system. This is particularly useful when integrating multiple log sources into a centralized SIEM platform like Splunk, QRadar, or Rapid7.
In this guide, we’ll walk through how to configure the Log Source Identifier in the Syslog Plugin using Netskope Cloud Exchange, so your SIEM can distinguish between various log sources effectively.
Configure Required Plugins
Log Shipper Plugin: This plugin pulls logs (like alerts and events) from the Netskope tenant.
Syslog Plugin: This plugin is responsible for forwarding the logs to your SIEM platform (e.g, Splunk).

Set the Log Source Identifier in Syslog Plugin
- Go to the Syslog Plugin configuration within the Cloud Exchange UI and locate the field named Log Source Identifier in Configuration Parameters.
- Enter a custom name or identifier based on the log source (like
Log From My Netskope Tenant) and click Save to apply the configuration.

Validate in SIEM
After the configuration is complete, validate that logs are being received with the correct Log Source Identifier.
Example (for Splunk): You can run the following Splunk query to confirm:index=<your_index> "Log From My Netskope Tenant"
Replace "Log From My Netskope Tenant" with the actual identifier you configured. If logs appear, the configuration is successful.

Summary
Using the Log Source Identifier field in the Syslog Plugin allows for better log source separation and visibility in your SIEM platform. By configuring this correctly, you enhance the manageability and observability of your Netskope logs within your security infrastructure.
How to Migrate a Beta Plugin to a General Availability (GA) Plugin
The Cloud Exchange performs a plugin availability check every 24 hours.
After the plugin is GA, you will receive a notification banner displayed on the plugin repository page. This banner indicates that a migration is available for a configured Beta plugin.
Migration Steps
Follow these steps to complete the migration:
- Locate the Banner: Go to your plugin repository page. Look for and identify the notification banner indicating the availability of the GA version.
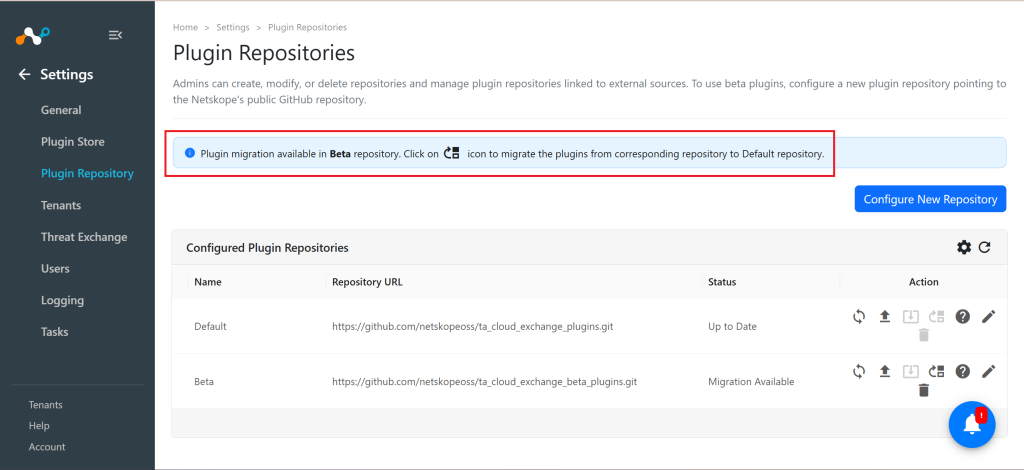
- Initiate Migration: Click Migrate plugin presented within the notification banner.
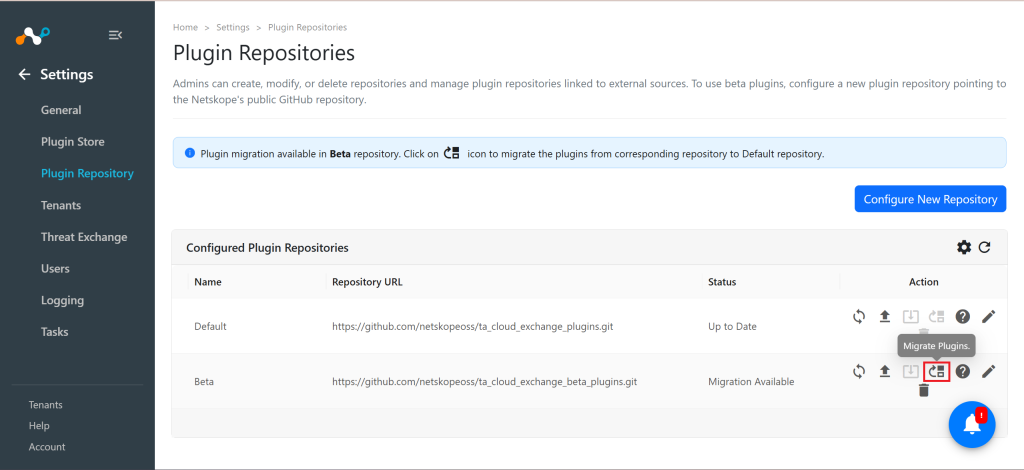
- Select the Plugin: A list of available plugins (which includes the new GA version) will be displayed. Select the GA version of the plugin you wish to migrate to.
- Confirm and Save: Click Save.
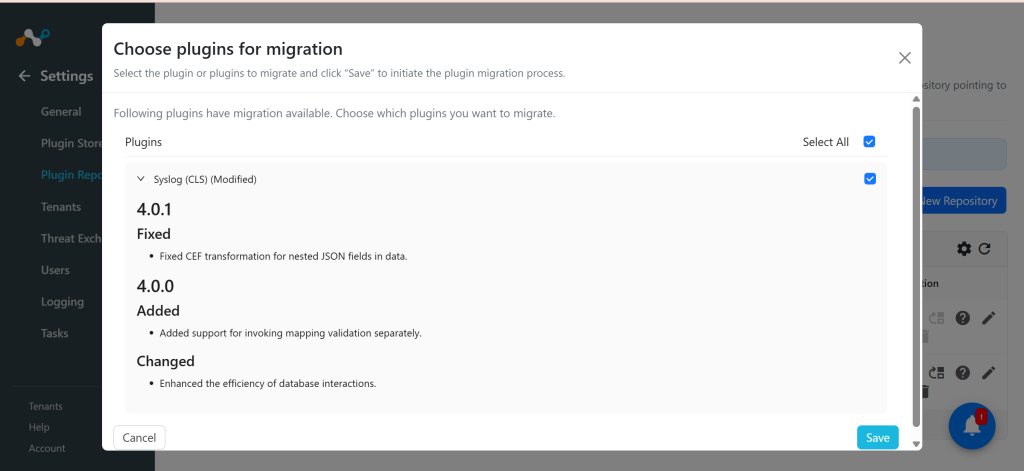
- Migration Process: The system will now begin the process of migrating your configuration from the old Beta plugin to the new GA plugin.


After this process is complete, your system will be using the more stable and officially supported GA plugin.
Remove inactive IoCs from Netskope if IoCs retraction not supported
This article explains how to remove the IoCs from Netskope that have already removed from the source. Some plugins do not support IoCs retractions like STIXTAXII and Web Page IOC Scraper.
Note: You need to follow this only if the plugin does not support IoCs retraction. Else you can directly configure IoCs retraction for remove IoCs
You can reconfigure the plugin using aging criteria “1”. Follow these steps to achieve this.
- Remove the existing plugin including data assigned to that plugin.
- Now configure a new plugin and configure aging criteria “1”.
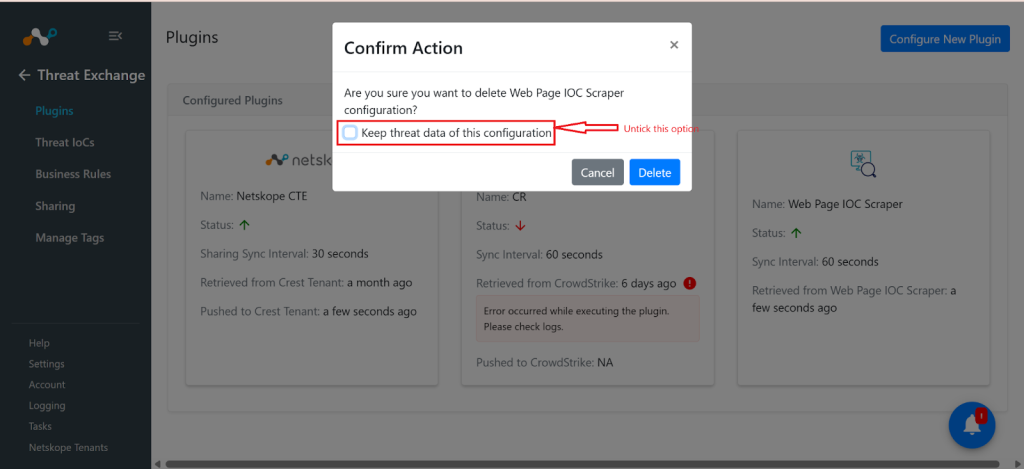
- Now all the IoCs which got removed from source, will also be marked as expired in cloud exchange in one day.
- After this, you can enable settings to delete expired IoCs from Cloud Exchange. For this you can follow the below steps.
- In to Cloud Exchange, go to Settings > Threat Exchange, enable Delete Inactive IoC(s) Indicators, and click Save.
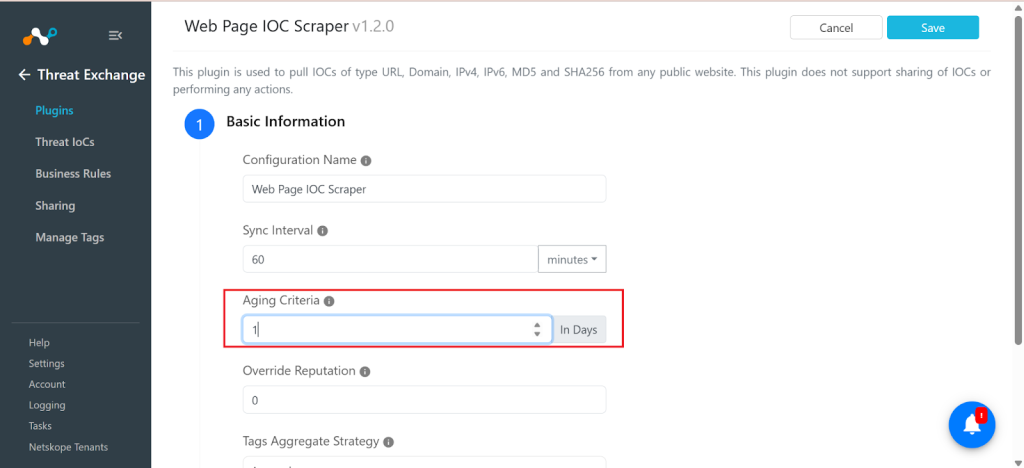
- Now all the IoCs deleted from source will automatically be removed from Netskope after a day.
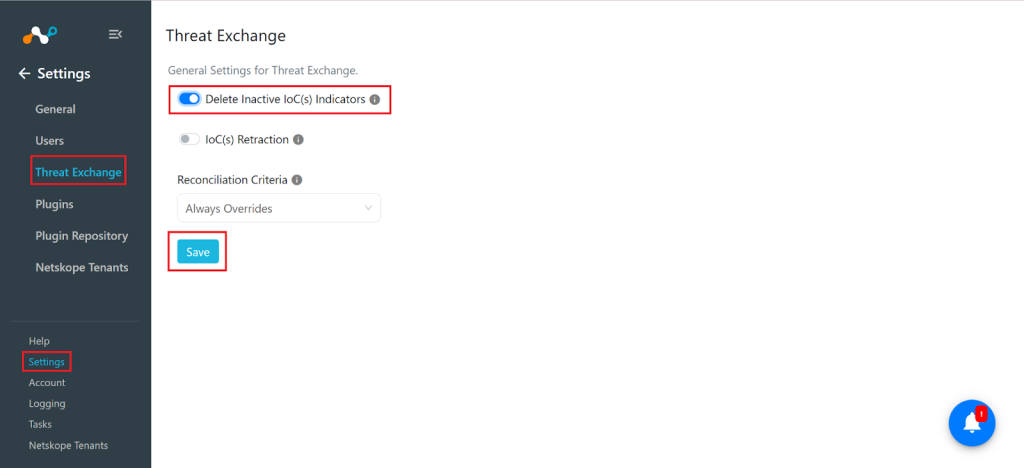


Cloud Exchange Platform Logs Error Notification Setup for Slack
This section is designed to guide you through the process of setting up notifications in Slack for Cloud Exchange errors. This will allow customers to be promptly informed about any critical issues or errors encountered during the Cloud Exchange operations. Follow the steps below to configure notifications for various Cloud Exchange modules, ensuring you get notified whenever an error occurs.
Overview
To keep customers informed of critical errors in Cloud Exchange, we have implemented a Slack notifier plugin. This allows you to receive real-time alerts directly to your Slack channel whenever an error occurs in any of the Cloud Exchange modules. By setting up business rules tailored to specific modules, you can ensure that only relevant errors trigger notifications, making it easier to monitor and address issues quickly.
Notifier for Slack Configuration
If you are freshly installing the plugin, configure the Slack Notifier Plugin by following the steps outlined in the Notifier Plugin for Ticket Orchestrator document. Once done, refer to this document to configure the business rules. If you have already configured Notifier, you can directly follow this document to edit the existing business rules. Below is how to configure the business rule for each Cloud Exchange module:
Cloud Exchange Platform Errors
This section covers general Cloud Exchange Platform errors that are not tied to any specific module. These errors may include system-wide issues.
Steps to Configure the Business Rule
- In Cloud Exchange, go to a Cloud Exchange module (like Ticket Orchestrator) and click Business Rules, and then create or edit an existing business rule.
- Edit the rule as shown.

- Click Save.
Log Shipper Module Errors
This section covers errors specific to the Log Shipper module in the Cloud Exchange environment. Any errors generated related to this module will trigger a notification to Slack.
Steps to Configure the Business Rule
- In Cloud Exchange, go to Log Shipper > Business Rules and create or edit an existing business rule.
- Edit the rule as shown.

- Click Save.
Ticket Orchestrator Module Errors
This section covers errors specific to the Ticket Orchestrator Module in the Cloud Exchange environment. Any errors generated related to this module will trigger a notification to Slack.
Steps to Configure the Business Rule
- In Cloud Exchange, go Ticket Orchestrator > Business Rules and create or edit an existing business rule.
- Edit the rule as shown.

- Once done save the rule.
Threat Exchange Module Errors
This section focuses on the Threat Exchange module, which manages threat intelligence sharing across the Cloud Exchange platform. Errors in this module will trigger notifications to keep you informed about security-related issues.
Steps to Configure the Business Rule
- In Cloud Exchange, go to Threat Exchange > Business Rules and create or edit an existing business rule.
- Edit the rule as shown.

- Click Save.
Risk Exchange Module Errors
This section covers errors specific to the Risk Exchange module in the Cloud Exchange environment. Any errors generated related to this module will trigger a notification to Slack.
Steps to Configure the Business Rule
- In Cloud Exchange, go to Risk Exchange > Business Rules and create or edit an existing business rule.
- Edit the rule as shown.

- Click Save.
Queue Configuration
Queue configuration is a crucial step where you can map the appropriate fields.
Map Fields: In this section, you can map values between alerts and notifications. Alert attributes can be accessed using the “$” symbol in the custom message field.
For example, in the screenshots below, we have mapped the values $errorCode, $alertType, and $message. As a result, when you receive the notification in Slack, it will display the information as specified here.
Map fields in queue configuration.

For example, we attempt to save the plugin while leaving the Event Types and Alert Types fields empty, it will result in an error. This error will trigger a notification on Slack.
Verified that error generated for CLS module.

Notification generated on slack.

Cloud Exchange Error Codes
Here are links to sections that provide detailed descriptions of various Cloud Exchange Error Codes. These sections cover specific error codes related to different modules within the Cloud Exchange platform, offering in-depth explanations of each error type, and its causes.
How to delete an existing Client Status Iterator?
Follow these steps to delete an existing Client Status.
- Go to Settings > Tools.
- Click REST API V2.
- Click API Documentation.
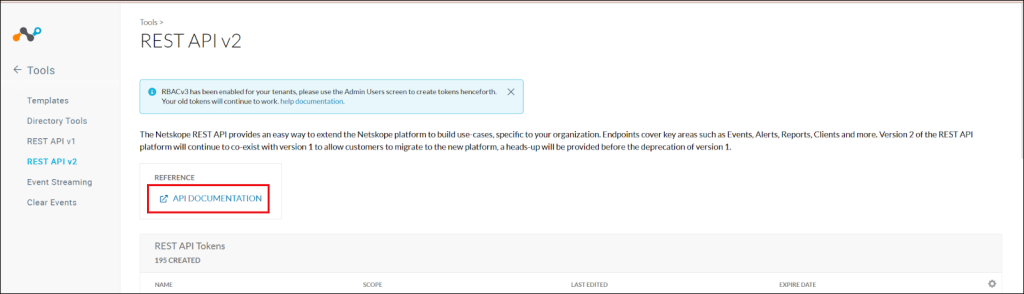
- After you open the API Documentation, you need to click Authorize.
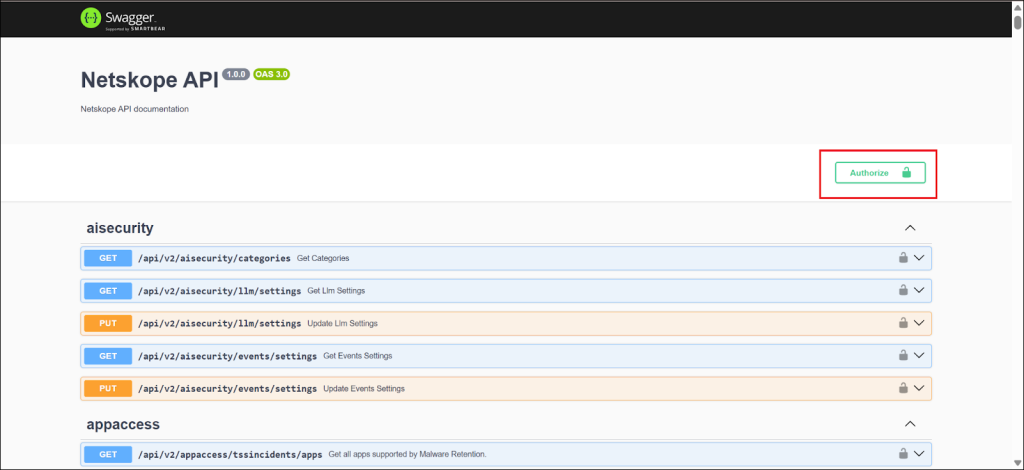
- Use your REST API V2 token for authentication.
- Now search for the Create a new Iterator endpoint and click Try it now.
- Provide any name for Iterator and for eventtype, select create a client status event iterator.
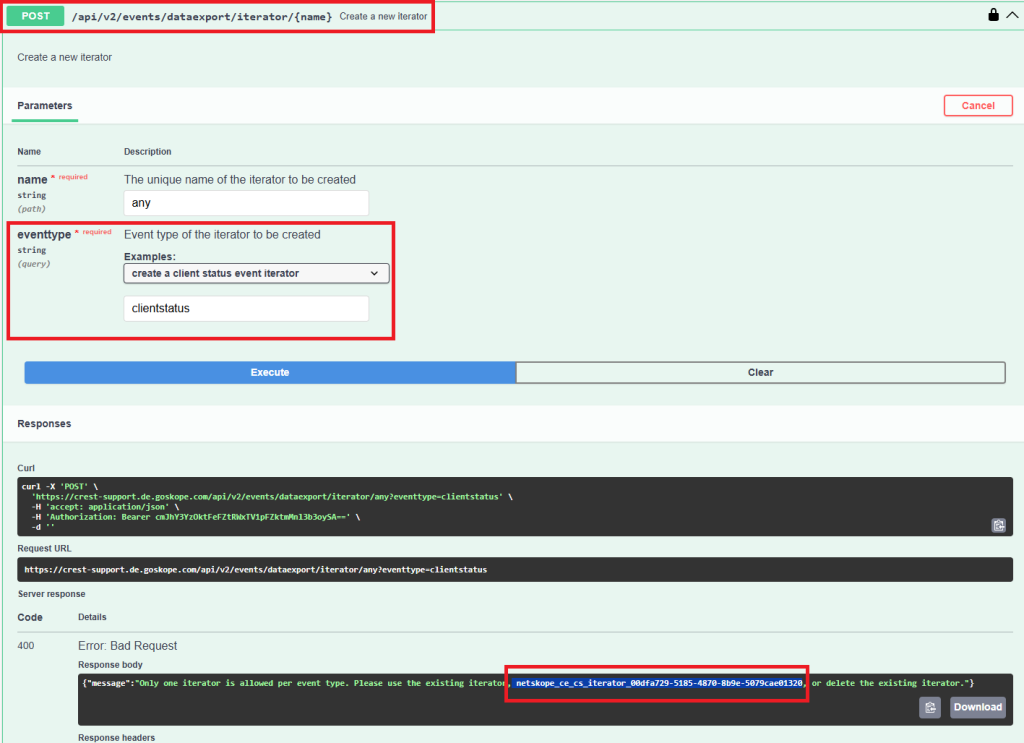
- Click Execute.
- If client status is already created, you will get the name of the iterator.
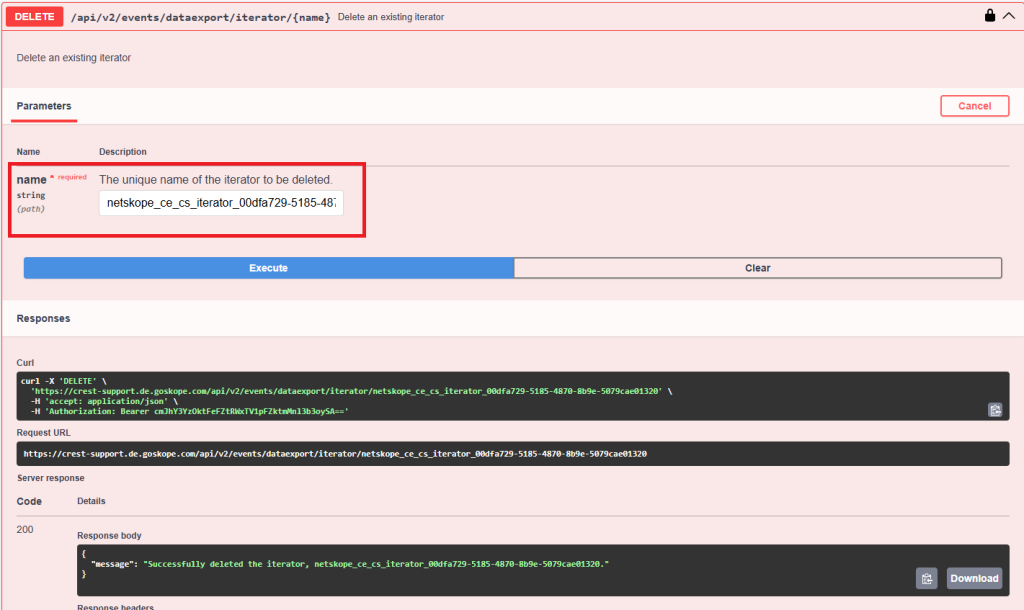
- Copy this name and go to delete an existing iterator and click Try it now.
- Paste the name of the iterator you copied and click Execute.
- Check the server response to confirm that the iterator was successfully deleted.


Client Status Events Mappings
This table below provides mapping details to help correlate Client Status event fields received by your SIEM/SOAR with the corresponding events in the Netskope Portal.
| Netskope Field Name | Code Received at SIEM/SOAR | Netskope Portal Field Value |
|---|---|---|
| last_seen_device_event.event | 0 | Tunnel Down |
| 1 | User Disabled | |
| 2 | Admin Disabled | |
| 3 | Disconnected SF | |
| 4 | Disconnected GRE | |
| 5 | Disconnected IPSec | |
| 6 | Disconnected DPOnPerm | |
| 7 | Tunnel down due to error | |
| 8 | Tunnel down due to error in Modern S | |
| 9 | Disconnected Config Notready | |
| 10 | Change in Network | |
| 11 | System Shutdown | |
| 12 | Disconnected By Uninstall | |
| 13 | Disconnected Enrollment Token Error | |
| 14 | Disconnected Fail Closed | |
| 15 | User Enabled | |
| 16 | Admin Enabled | |
| 17 | Tunnel Up | |
| 18 | Tunnel Event | |
| 19 | Enroll | |
| 20 | UnEnrolled | |
| 21 | Dem Heartbeat | |
| 22 | Installed | |
| 23 | UnInstalled | |
| 24 | Installation Failure | |
| 25 | System power-up | |
| 26 | Device Posture Change | |
| 27 | User Disabled By OTP | |
| 28 | OTP Timer Expired Auto Enabled | |
| 29 | Uninstallation Failure | |
| 30 | Upgraded | |
| 31 | Upgrade Failure | |
| 32 | Rollback Success | |
| 33 | Rollback Failure | |
| 34 | CA Installation Failure | |
| 35 | CA Installation Change | |
| 36 | CA Installation Success | |
| 37 | Tunnel down due to Express Connect | |
| 38 | Admin Deleted | |
| -1 | NS Tunnel Unknown | |
| last_seen_device_event.actor | 0 | System |
| 1 | User | |
| 2 | Admin | |
| 3 | Reboot | |
| 4 | Network Joined | |
| 5 | System Wakeup | |
| 6 | Domain Joined | |
| 7 | Move from Wi-Fi to Ethernet Network | |
| 8 | Wi-Fi Network Changed | |
| 9 | Private Key Revoked | |
| 10 | Service Started | |
| -1 | Unknown | |
| last_seen_device_event.status | 0 | Enabled |
| 1 | Disabled | |
| 2 | Fail Closed | |
| 3 | Uninstalled | |
| 4 | Managed | |
| 5 | Unmanaged | |
| 6 | Not Configured | |
| 7 | Errored | |
| 8 | Backed Off | |
| 9 | Dormant | |
| -1 | Unknown | |
| 999 | Admin Deleted | |
| last_seen_device_event.npa_status | 0 | Disconnected |
| 1 | Disabled | |
| 2 | Steering Disabled | |
| 3 | Unable to Enroll | |
| 4 | Allowed | |
| 5 | Connected | |
| 6 | Connected User Tunnel | |
| 7 | Connected Prelogon Tunnel | |
| 8 | Enabled | |
| 9 | Connecting | |
| 10 | Disconnecting | |
| 11 | Disconnected By OTP | |
| 12 | OTP Timer Expired Auto Enabled | |
| 13 | Errored | |
| -1 | Unknown | |
| user_info.device_classification_status | 0 | Unmanaged |
| 1 | Managed | |
| 2 | Not Configured | |
| -1 | Unknown | |
| host_info.os | 0 | Windows |
| 1 | Windows Server | |
| 2 | Mac | |
| 3 | Android | |
| 4 | iOS | |
| 5 | Chrome OS | |
| 6 | Linux | |
| 7 | Unknown OS |
Workaround for Upgrading the CTO HaloITSM Plugin v2.0.0
Summary: When upgrading an existing CTO HaloITSM plugin to the updated version (v2.0.0), the plugin workflow may break because the newer version includes configuration parameters that were not present in earlier versions. As a result, users may be unable to save the plugin during the upgrade. Use the workaround below to complete the upgrade and restore the existing plugin workflow.
Issue
After upgrading from an older CTO HaloITSM plugin version, users may be unable to save the plugin because the configuration parameters have changed in the updated version. During the upgrade flow, select Skip when prompted so the upgrade can complete, and then edit the plugin configuration afterward.
Workaround steps
- During the plugin upgrade, select Skip when prompted.
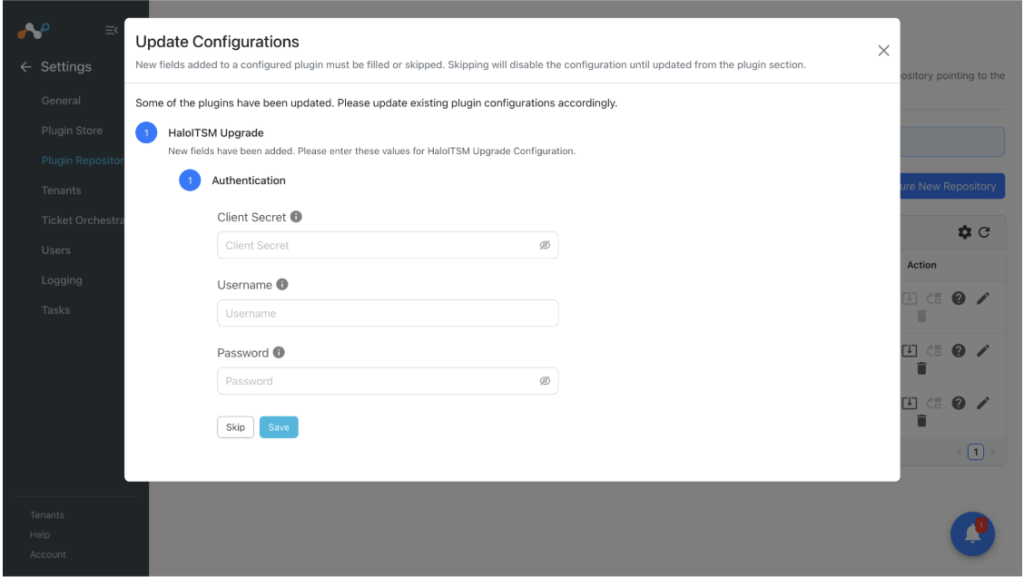
- Go to the Plugins page and edit the upgraded CTO HaloITSM plugin.
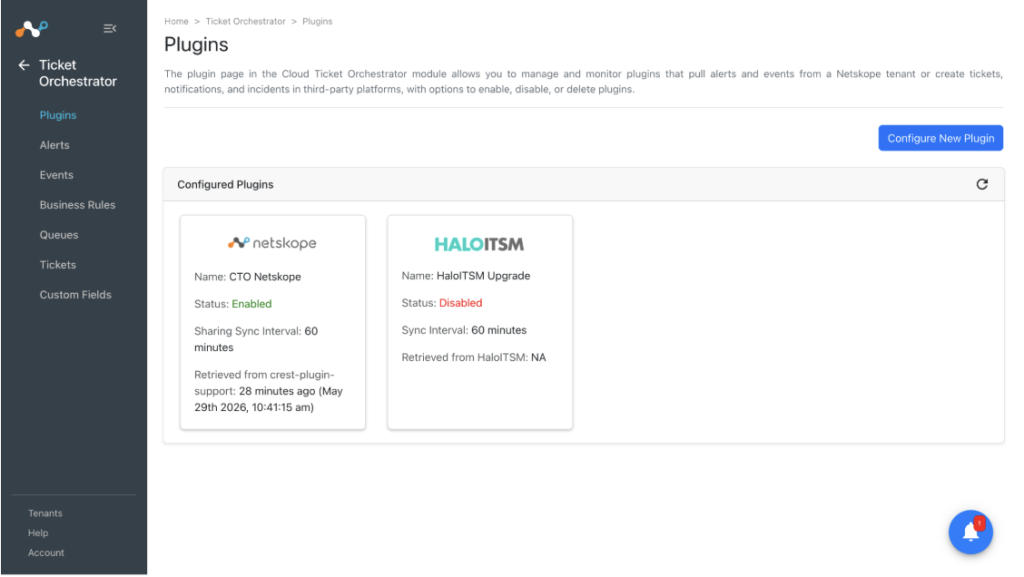
- Enter the required authentication details, and then click Next.
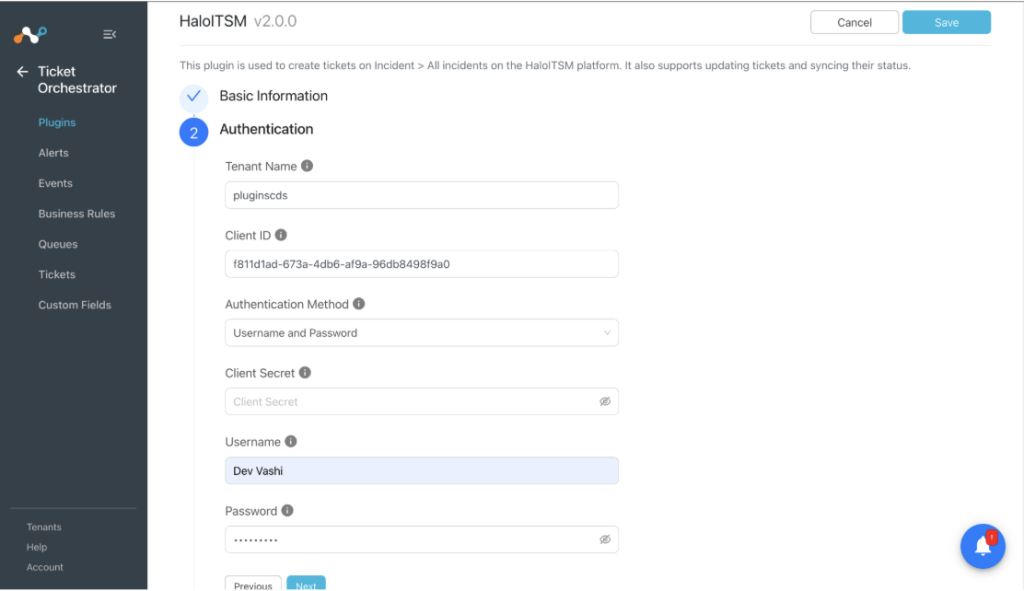
- Select the required ticket type, and then click Save.
Important: To change the ticket type, users must save the plugin from the Configuration Parameters tab. If users update the ticket type and save the plugin from the Mapping Configuration, Authentication, or Basic Information tab, the change will not be reflected.
- Enable the plugin.


Mapping configuration guidance
Mapping Configuration is introduced in CTO HaloITSM plugin version 2.0.0. Use this tab to map Netskope Cloud Exchange fields with HaloITSM fields.
If you want to keep the default Mapping Configuration, save the plugin from the Configuration Parameters tab.
If you have an already configured queue, reconfigure the queue after upgrading the plugin. Earlier plugin versions used hardcoded mapped fields, so queue reconfiguration is required after the upgrade.
Configure Cloud Exchange Log Shipper to Share Netskope Alerts and Events with Multiple Destinations
This article outlines the end-to-end workflow required to configure Cloud Exchange for seamlessly sharing Netskope Alerts and Events with multiple third-party destinations (such as Syslog, QRadar, etc.).
Verify System Requirements
Before beginning the configuration, ensure that your Cloud Exchange deployment meets the necessary System Requirements to handle multi-destination ingestion smoothly.
Refer to the System Requirements documentation for specific hardware and resource metrics.
Configure the Netskope Tenant
Establish the primary data connection by linking your Netskope Tenant to Cloud Exchange.
Refer to the Tenant Plugin guide to set up your tenant credentials and API access.
Configure the Netskope Log Shipper Plugin
Configure the Log Shipper plugin to start fetching data from your tenant.
Refer to the Log Shipper Plugin guide for detailed setup steps.
Configure Destination Plugins
Configure the plugins for each third-party platform where you want to send your logs. For example, if you wish to ingest Alerts and Events into both Syslog and QRadar, you must configure both individual plugins within Cloud Exchange.
Refer to the 3rd Party Destination Plugins article for specific implementation guides for each supported vendor.
Configure Business Rules
Set up Business Rules to filter data according to your organization’s compliance or operational requirements.
- You can design custom Business Rules tailored to specific criteria.
- Alternatively, you can use the built-in default All Business Rule to share all available Alerts and Events without filtering.
Refer to the Business Rules article for step-by-step logic creation.
Configure Log Delivery
The final step is to tie your log source, destination plugins, and business rules together by setting up the log delivery.
Refer to the Log Delivery article to activate your Log Ingestion workflow.
Cloud Exchange EDM Module Dataset Sizing Guidance
Summary
The Cloud Exchange (CE) EDM module provides an end-to-end solution for fetching raw data stored in CSV, DB etc, hash generation, and uploading Exact Data Match data to your Netskope tenant. It supports pulling customer data from multiple source types via dedicated plugins — including Linux file share servers (via SFTP), MySQL and Oracle databases, and SMB-based file shares.
CE automates the full workflow through interval-based plugin lifecycle tasks, which handle data pulling, hash generation, and upload in a single pipeline. Any newly added records in the source are automatically reflected in the tenant according to the configured plugin interval. A manual sync option is also available to trigger the plugin lifecycle task on demand when an immediate update is required. CE EDM module also supports Sanitization, Normalization, Remove quotes, Remove stopwards kind of customization on pulled data.
Performance Results
The following records were used to validate EDM module functionality and performance.
| File Name | Rows | Columns | Unique Values | File Size |
|---|---|---|---|---|
| 1M_edm_dataset.csv | 1000000 | 25 | 300000 | 1.3 GB |
Detailed Performance Results
Below table shows EDM processing time which also depends on the EDM plugin configuration options like sanitization, normalization, dictionary creation, and stopword removal across multiple columns.
Performance Results with Plugin Configuration
| File Used | Remove Quotes | Sanitization (Columns) | Normalization (Cloumns) | Dictionary Creation (Columns) | Remove Stopwords | Proceed Without Sanitization | Plugin used | Hash Generation Time | Upload Processing Time | Total Time Taken |
|---|---|---|---|---|---|---|---|---|---|---|
| 1M_edm_dataset.csv | disabled | 0 columns | 2 columns | 0 columns | disabled | disabled | Linux File Share v1.1.0 | 2 minutes and 35 seconds | 2 minutes and 7 seconds | 4 minutes and 42 seconds |
| 1M_edm_dataset.csv | enabled | 3 columns | 3 columns | 3 columns (Case Sensitive – 2 columns, Case Insensitive- 1 column ) | enabled | disabled | Linux File Share v1.1.0 | 36 minutes and 30 seconds | 2 minutes and 30 seconds | 39 minutes |
Guidance
The numbers above are performance benchmarks for the Cloud Exchange (CE) EDM module. CE supports hash generation and upload of up to 1M records via the EDM module. If your dataset exceeds 1M rows, use the DLPx hash generation script + Python upload script based solution instead; see local hash generation for more details.
Term Definitions
- Remove Quotes: Enable if the CSV encloses field values in double quotes (e.g., when values contain commas). Quoted fields are parsed as a single column; improper quote placement can cause rows to be skipped.
- Sanitization (Columns): Validates and cleans the selected columns before hash generation. A cell is marked invalid if it has only one character, contains digits, matches a stopword (only when Remove Stopwords is enabled), or contains non-alphanumeric characters (which are stripped). (Default: none)
- Remove Stopwords: When enabled, cells matching a word from the stopword list are marked invalid during sanitization.
- Normalization (Columns): Standardizes the value in the selected columns before hash generation, so minor formatting differences in the source data don’t cause a valid match to be missed. String columns are converted to title case (e.g., JOHN DOE becomes John Doe); number columns have dashes, dots, and spaces removed (e.g., 123-45.678 becomes 12345678). (Default: none)
- Dictionary Creation (Columns): Creates a dictionary of unique values for the selected column(s), which can be used in a DLP rule in the Netskope tenant. (Default: none)
- Proceed Without Sanitization: If unchecked, all data is included in hash generation. If checked, only data that passed sanitization (the “Good File” content) is used for hash generation.
Migrating from URL Lists to Destination Profiles in Cloud Exchange
This article provides guidance for migrating an existing workflow from URL Lists to Destination Profiles within Cloud Exchange. It outlines the migration process while preserving the existing use case and highlights important considerations related to known limitations in Cloud Exchange version 6.1.0.
For this example scenario, an existing SIEM integration using Anomali ThreatStream XDR is configured to share IoCs to a Netskope URL List. The article demonstrates how to migrate this workflow to use Destination Profiles instead.
Existing Configuration Example
In this example, the current environment consists of the following configuration:
Plugins Configured in Cloud Exchange
The following plugins are already configured:
- Anomali ThreatStream XDR.
- Netskope Threat Exchange.

Existing Business Rule
A business rule currently exists that:
- Receives IoCs from Anomali ThreatStream XDR.
- Filters the IoC types required for sharing to Netskope.

Existing Sharing Configuration
The current sharing configuration performs the following action:
- Pushes the received IoCs into an existing URL List named: Crest PS URL List.


The workflow currently operates as:
Anomali ThreatStream XDR → Business Rule → Sharing Configuration → Netskope URL List
Migration Steps for URL List to Destination Profile
Follow these steps to migrate the existing URL List workflow to a Destination Profile.
Create a Copy of the Existing Business Rule
Since an existing plugin and workflow are already configured:
- In Threat Exchange, go to Business Rules.
- Locate the existing business rule currently used for URL List sharing.
- Click the Copy icon for the rule.
- Provide a new name for the duplicated rule.
- Save the newly created business rule.


Creating a copy of the existing business rule avoids impacting the current production workflow during migration.
Create a New Sharing Configuration for Destination Profile
Using the newly created business rule:
- Go to Sharing.
- Create a new sharing configuration.
- Select the newly created business rule.
- Under Target, select: Add to Destination Profile
- Select one of the following options:
- Choose an existing Destination Profile
- Select Create New Profile to create a new Destination Profile
- Save the sharing configuration.

The updated workflow will now become:
Anomali ThreatStream XDR → New Business Rule → New Sharing Configuration → Netskope Destination Profile List
Validate IoC Synchronization
After the configuration is completed:
- Go to Logging in Cloud Exchange.
- Verify successful execution of IoC push activities.
- Log in to your Netskope tenant.
- Go to Policies > Destination Profiles.
- Verify that the newly created or selected Destination Profile contains the expected IoCs.

Additional Notes
By creating a duplicate business rule and configuring a new sharing workflow using Destination Profiles, you can migrate existing URL List-based IoC sharing without disrupting current production configurations.
Do note that there is a known limitation in Cloud Exchange version 6.1.0 regarding Destination Profile configurations. While configuring a single Destination Profile works as expected, attempting to configure multiple Destination Profiles may result in validation errors during setup.
As a recommended workaround, if multiple URL Lists currently exist:
- Use one workflow configured with a Destination Profile.
- Continue using one workflow configured with a URL List.
- Separate the configurations using different Business Rules.
This approach helps avoid validation issues while maintaining IoC sharing functionality during the migration process.
Do note that a fix for the issue related to configuring multiple Destination Profiles is planned to be included in an upcoming Cloud Exchange release. Customers are advised to monitor future Cloud Exchange release notes for availability and implementation details.
References
If you’re unable to Configure Multiple Destination Profile, refer to this documentation.
For Cloud Exchange Release Notes Version 6.1.0, refer to this documentation.
For more details on Destination Profile, review this documentation.
Include Additional Event Fields in SIEM Logs via Cloud Exchange Log Shipper
Netskope’s Log Shipper (CLS) module within Cloud Exchange uses mapping files to determine which event fields are forwarded to a SIEM platform. The default mapping files are designed to include the most commonly used fields, but they may not contain every field available in the original event data stored in the Netskope tenant.
As a result, users may notice that a specific field is visible in the Netskope Events or Audit UI but is not present in the logs received by their SIEM. In most cases, this occurs because the field is not included in the default Log Shipper mapping file.
Example
A user is searching for a particular event field (for example, a policy attribute, user attribute, or metadata field) in their SIEM logs. The field is visible in the corresponding event within the Netskope tenant but does not appear in the SIEM output.
This indicates that the field exists in the source event but is not currently mapped for export by the Log Shipper.
Solution: Add the Required Field to the Mapping File
To include additional event fields in the logs sent to your SIEM, create or modify a custom mapping file and add the required field(s). After updating the mapping, configure the SIEM plugin to use the customized mapping file
Steps to Update the Mapping File
- In Cloud Exchange, go to Log Shipper.
- Temporarily disable the SIEM Plugin.
- Identify the mapping file currently assigned to the SIEM plugin.
- Go to Settings > Log Shipper > Mapping.
- Locate the mapping file and select Clone (recommended) or Edit if you are already using a custom mapping.
- Navigate to the category that corresponds to the logs you are forwarding (for example, Alerts, Events, etc).
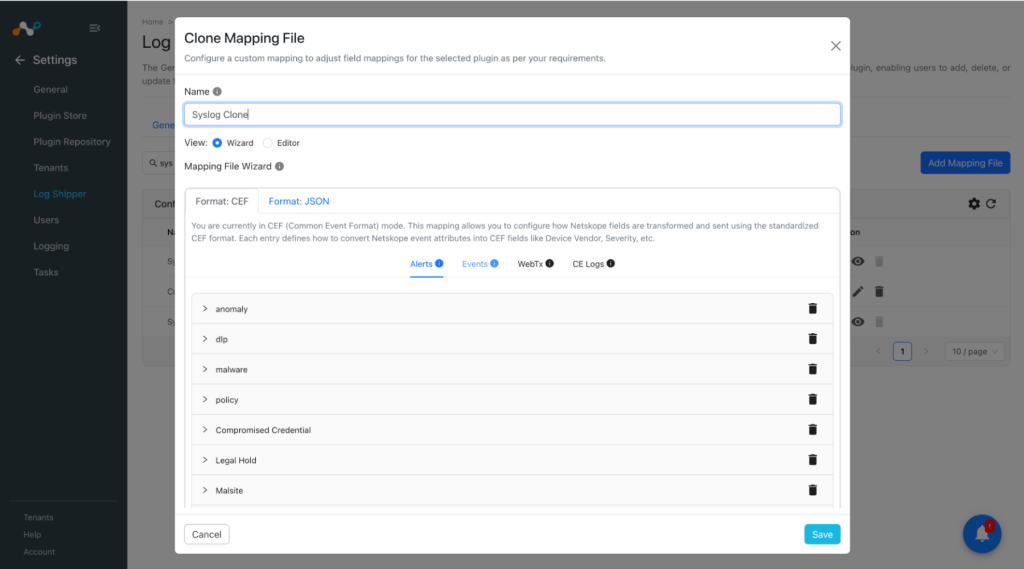
- Navigate to the specific type of log and expand the Extension menu.
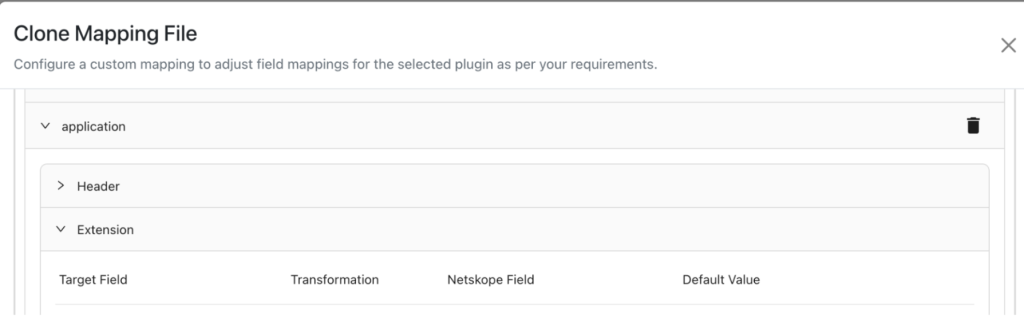
- Go to the bottom of the Extension menu and click Add. Select the required field from the Netskope Field dropdown menu that you want to add. Provide the name of the field as needed for identification in the SIEM. Click Save.
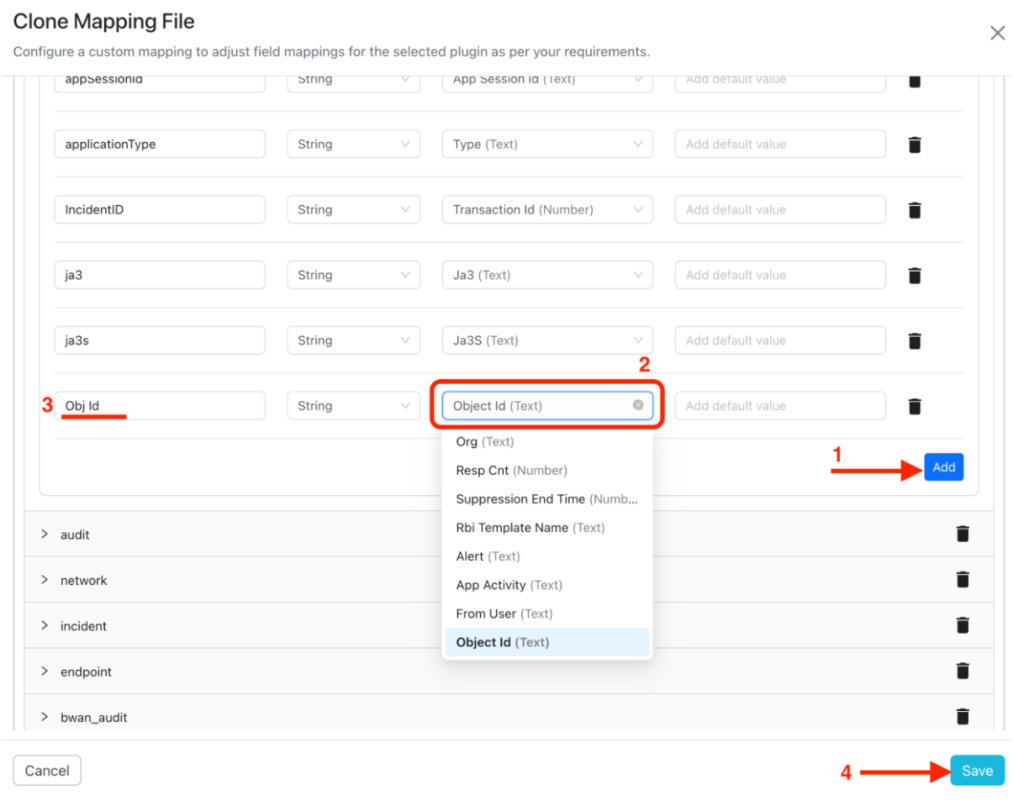
- Return to the SIEM Plugin configuration.
- Select the newly created or updated mapping file.
- Re-enable the SIEM Plugin.


Result
After the updated mapping is applied, newly forwarded logs will include the additional field(s), allowing them to be searched, parsed, and correlated within the SIEM platform.
Note
- Only new events generated after the mapping change will contain the newly added fields. Previously forwarded logs are not updated retroactively.
- Ensure that the field you intend to add is present in the original event data within the Netskope tenant. If the field is not available in the source event, it cannot be exported through the Log Shipper mapping.
- If the required field is not available in the mapping dropdown, search using its backend field name instead of the displayed label.
Reference Example

- Compare the field shown in the event details with the available mapping fields.

- If the field is not found, hover over the field name in SkopeIT to view its backend field name.

- Search for the backend field name in the mapping field search box and select the appropriate field.



Why is a Cloud Exchange Plugin Grayed Out and Not Configurable?
If a plugin appears grayed out and cannot be selected during a plugin upgrade in Cloud Exchange, it typically means that the plugin is not supported by the currently installed Cloud Exchange version.
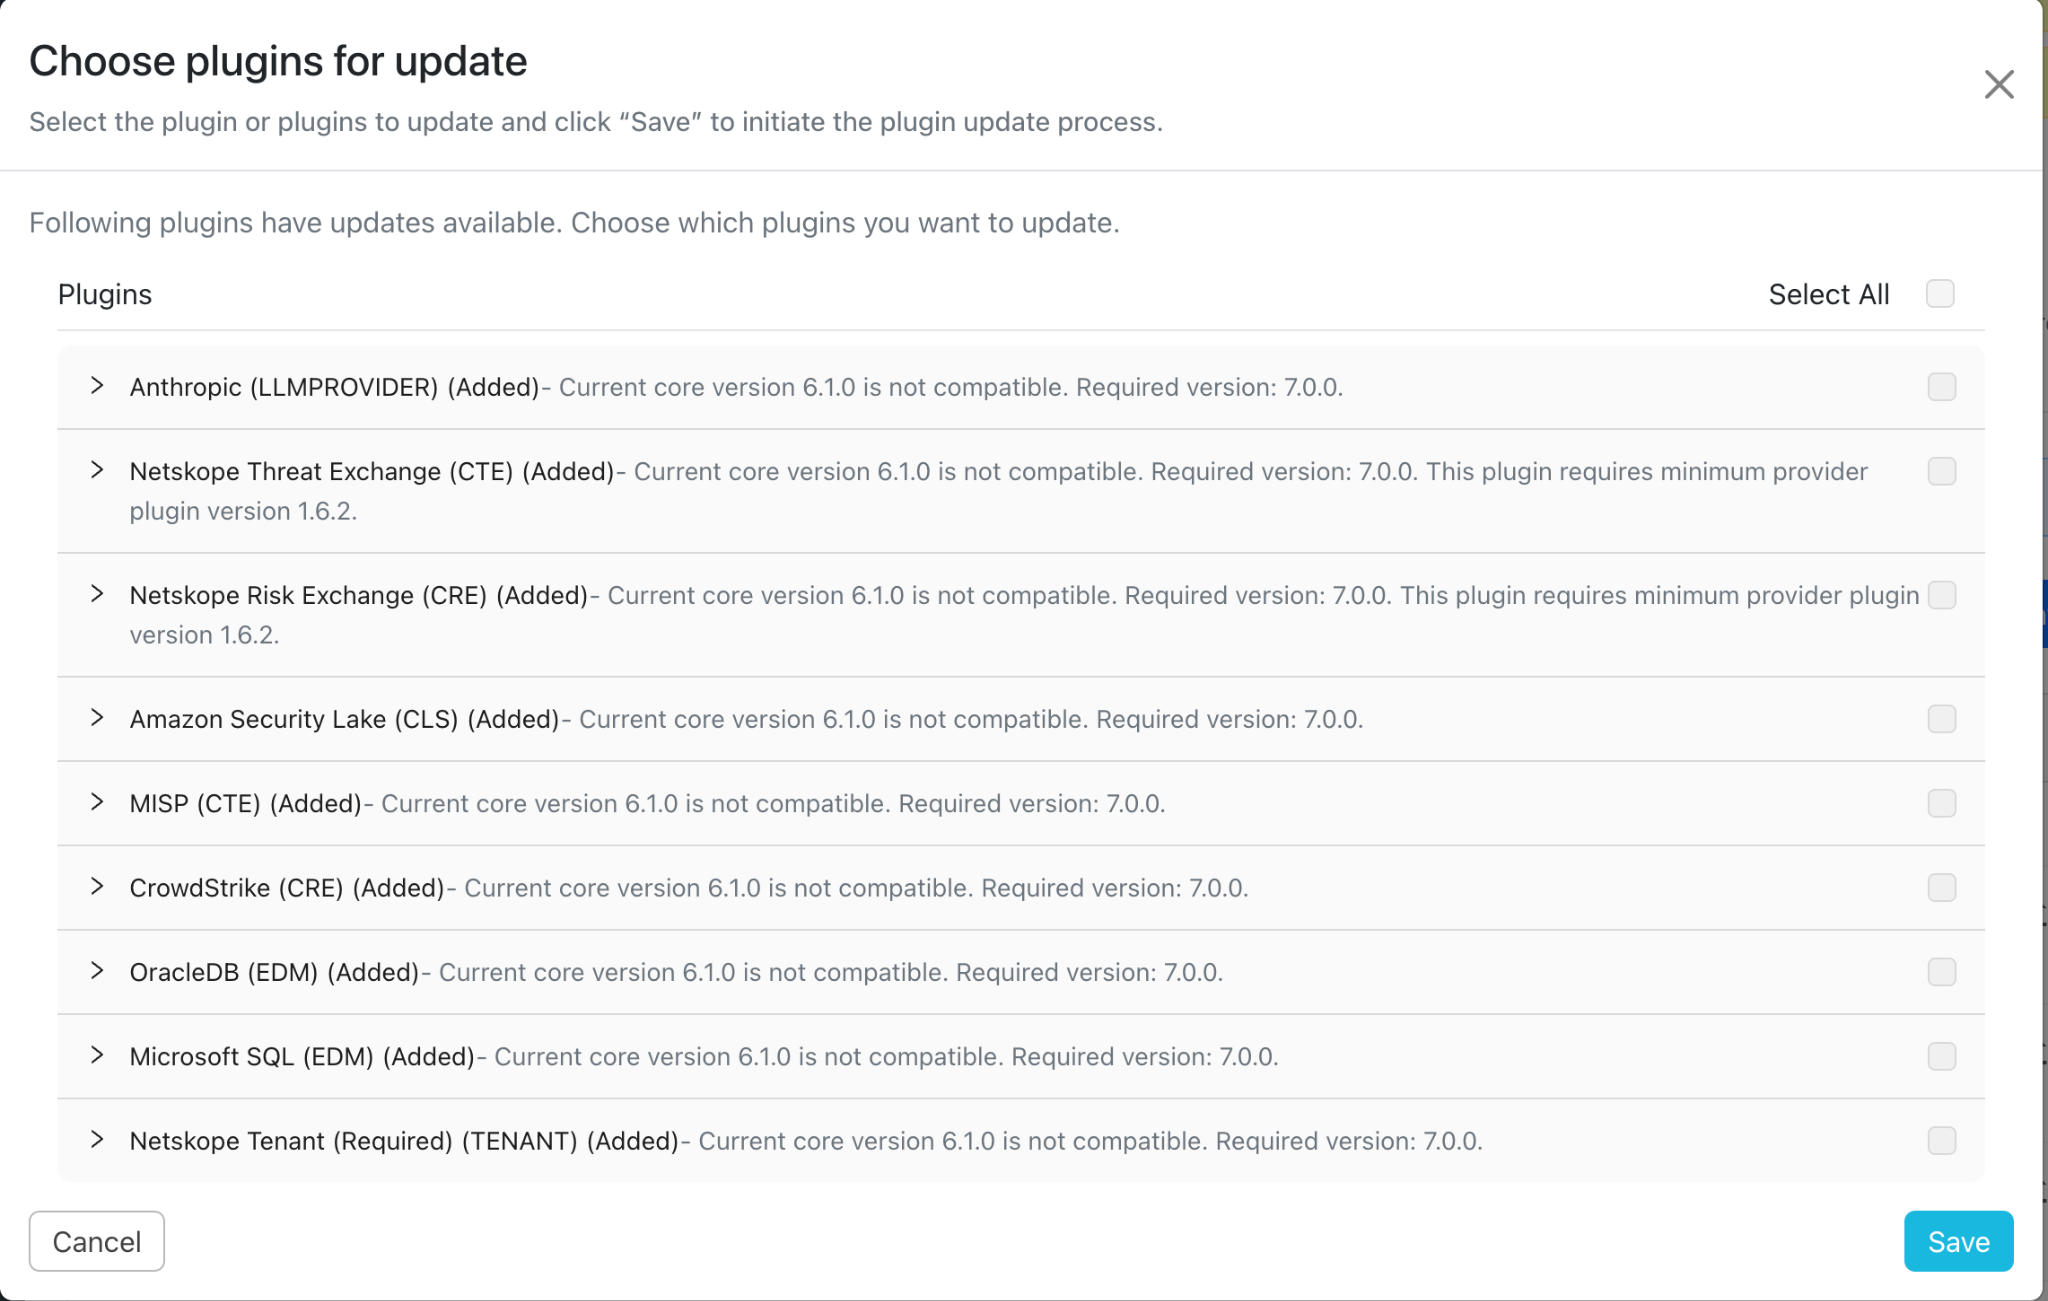
Grayed-out plugins show their version compatibility message in gray text (actual version numbers shown will vary by release).
What the Grayed-Out Text Means
As shown in the screenshot above, each incompatible plugin is listed with a message in gray text, indicating the currently installed Cloud Exchange version and the minimum version required for that plugin. Some plugins may also show a minimum required provider plugin version in addition to the core version. This grayed-out text is not an error; it is Cloud Exchange telling you exactly which version(s) you need before that plugin can be selected and configured.
Example
In the screenshot above, several plugins are grayed out because the Cloud Exchange version currently installed does not meet the minimum version each plugin requires. A few plugins additionally require a minimum provider plugin version. Once Cloud Exchange (and where applicable, the provider plugin) is upgraded to meet the stated requirement, the plugin becomes selectable and can be configured.
Resolving Plugin Version Requirements and Compatibility
- Note the Required version shown in gray next to the plugin (this is the minimum Cloud Exchange core version needed).
- If a minimum provider plugin version is also listed, confirm that requirement separately. Both conditions must be met.
- Check the Cloud Exchange version currently installed in your environment (shown as Current core version in the dialog).
- If your installed version is older than the required version, upgrade Cloud Exchange to a supported version.
- After upgrading, refresh the plugin update screen. The plugin will no longer be grayed out and can be selected and configured.
You can view all released Cloud Exchange versions, their release dates, and support status on the Cloud Exchange Product Life Cycle page:
Good to Know: Support Policy
Netskope actively supports the two most recent Cloud Exchange releases (the current version and the one before it). If your environment is running a version older than that, we recommend planning an upgrade rather than waiting on a single release, since older versions fall outside active support.
Always refer to the latest plugin configuration guide for the exact supported versions and prerequisites before performing an upgrade.
How to Customize Map Fields Configuration in the Ticket Orchestrator Module
The Map Fields feature in the Ticket Orchestrator module allows you to map Netskope alert and event fields to the destination ticketing platform. By default, each destination field can be mapped to a single Netskope field.
In addition to mapping a single Netskope field to a destination field, the Custom Message option enables you to combine multiple Netskope alert/event fields into a single formatted message. This custom message can be configured for any supported target field, allowing you to populate the field with multiple values and static text as required.
This article demonstrates how to configure a custom message using the ServiceNow plugin as an example. The same configuration approach applies to any Ticket Orchestrator plugin that supports the Map Fields feature.
Prerequisites
- A configured Ticket Orchestrator integration.
- A configured Business Rule.
- A supported ticketing platform (ServiceNow used in this example).
- A configured Queue.
Access the Map Fields Configuration
To access the Map Fields configuration:
- Go to Ticket Orchestrator.
- Select the appropriate Business Rule.
- Choose the required Configuration (Plugin).
- Select the desired Queue.
- When done, the Map Fields section will appear as below.
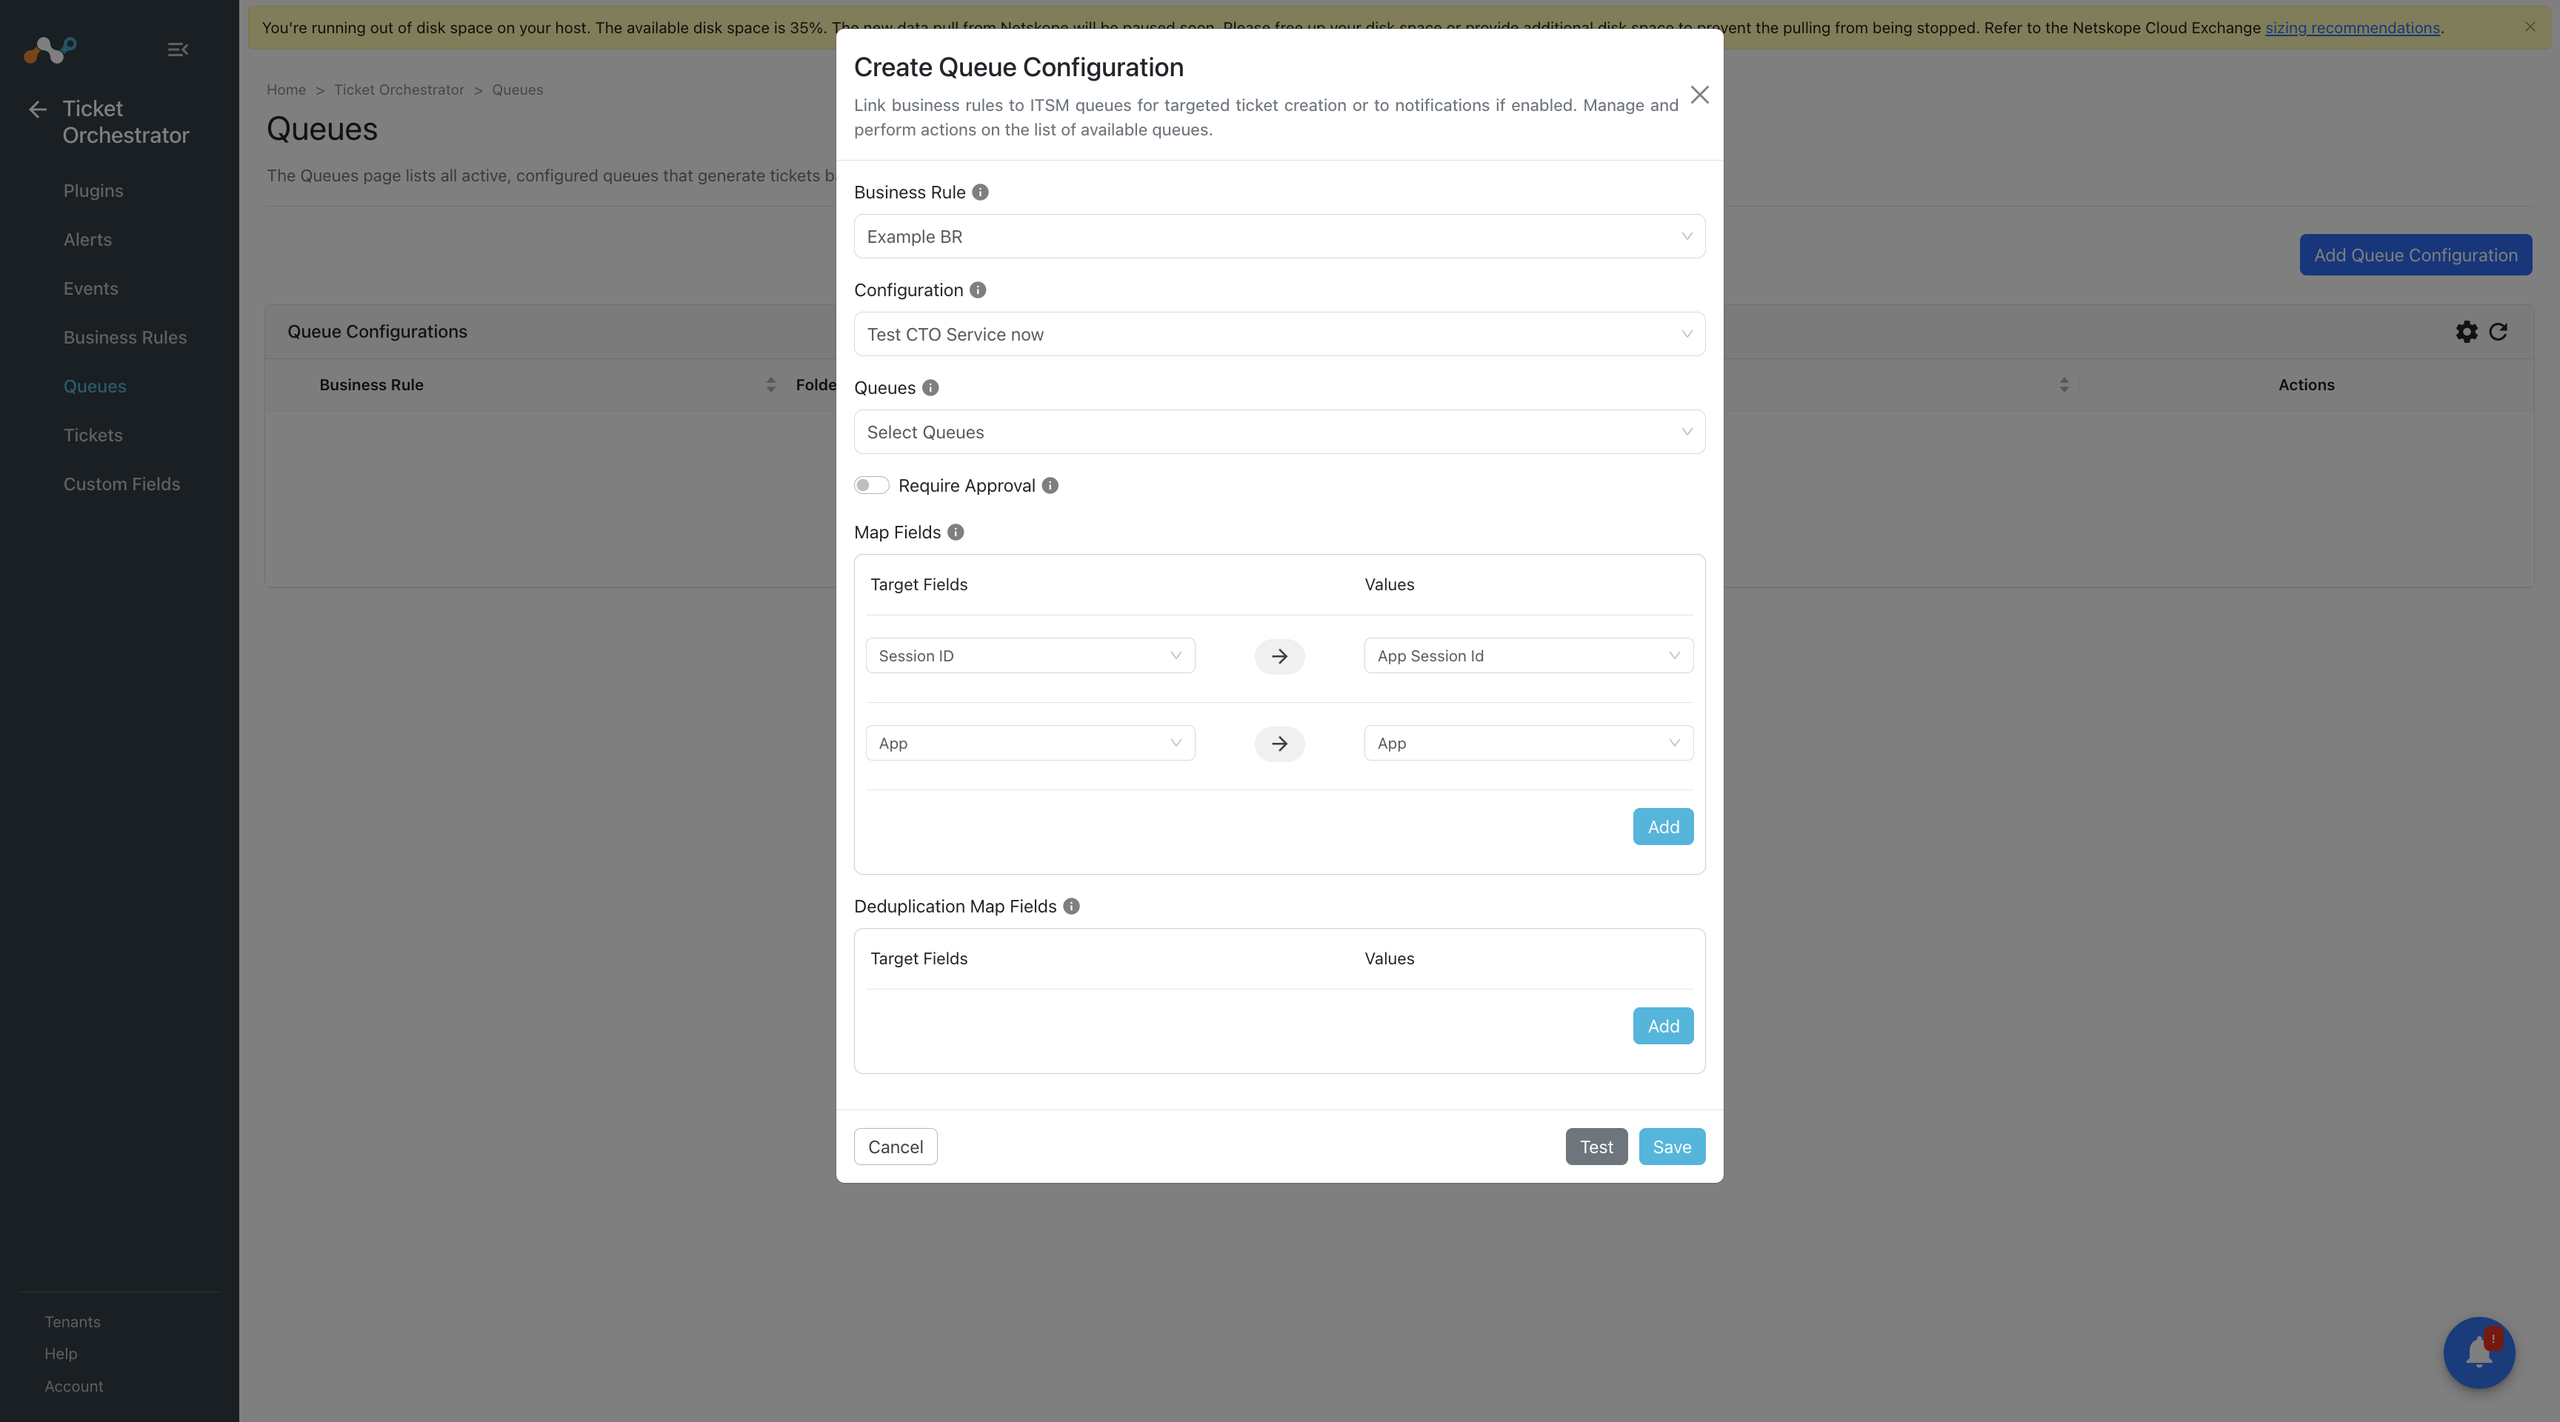
Configure a Custom Message
Locate the destination field that you want to customize.
Common examples include:
- Short Description
- Description
Instead of mapping a single Netskope field, you can create a custom message by combining multiple alert or event fields into one destination field.
After selecting Custom Message in the Value section, a text box will appear below the field. You can enter your custom message in this text box, as shown in the example below.
Example
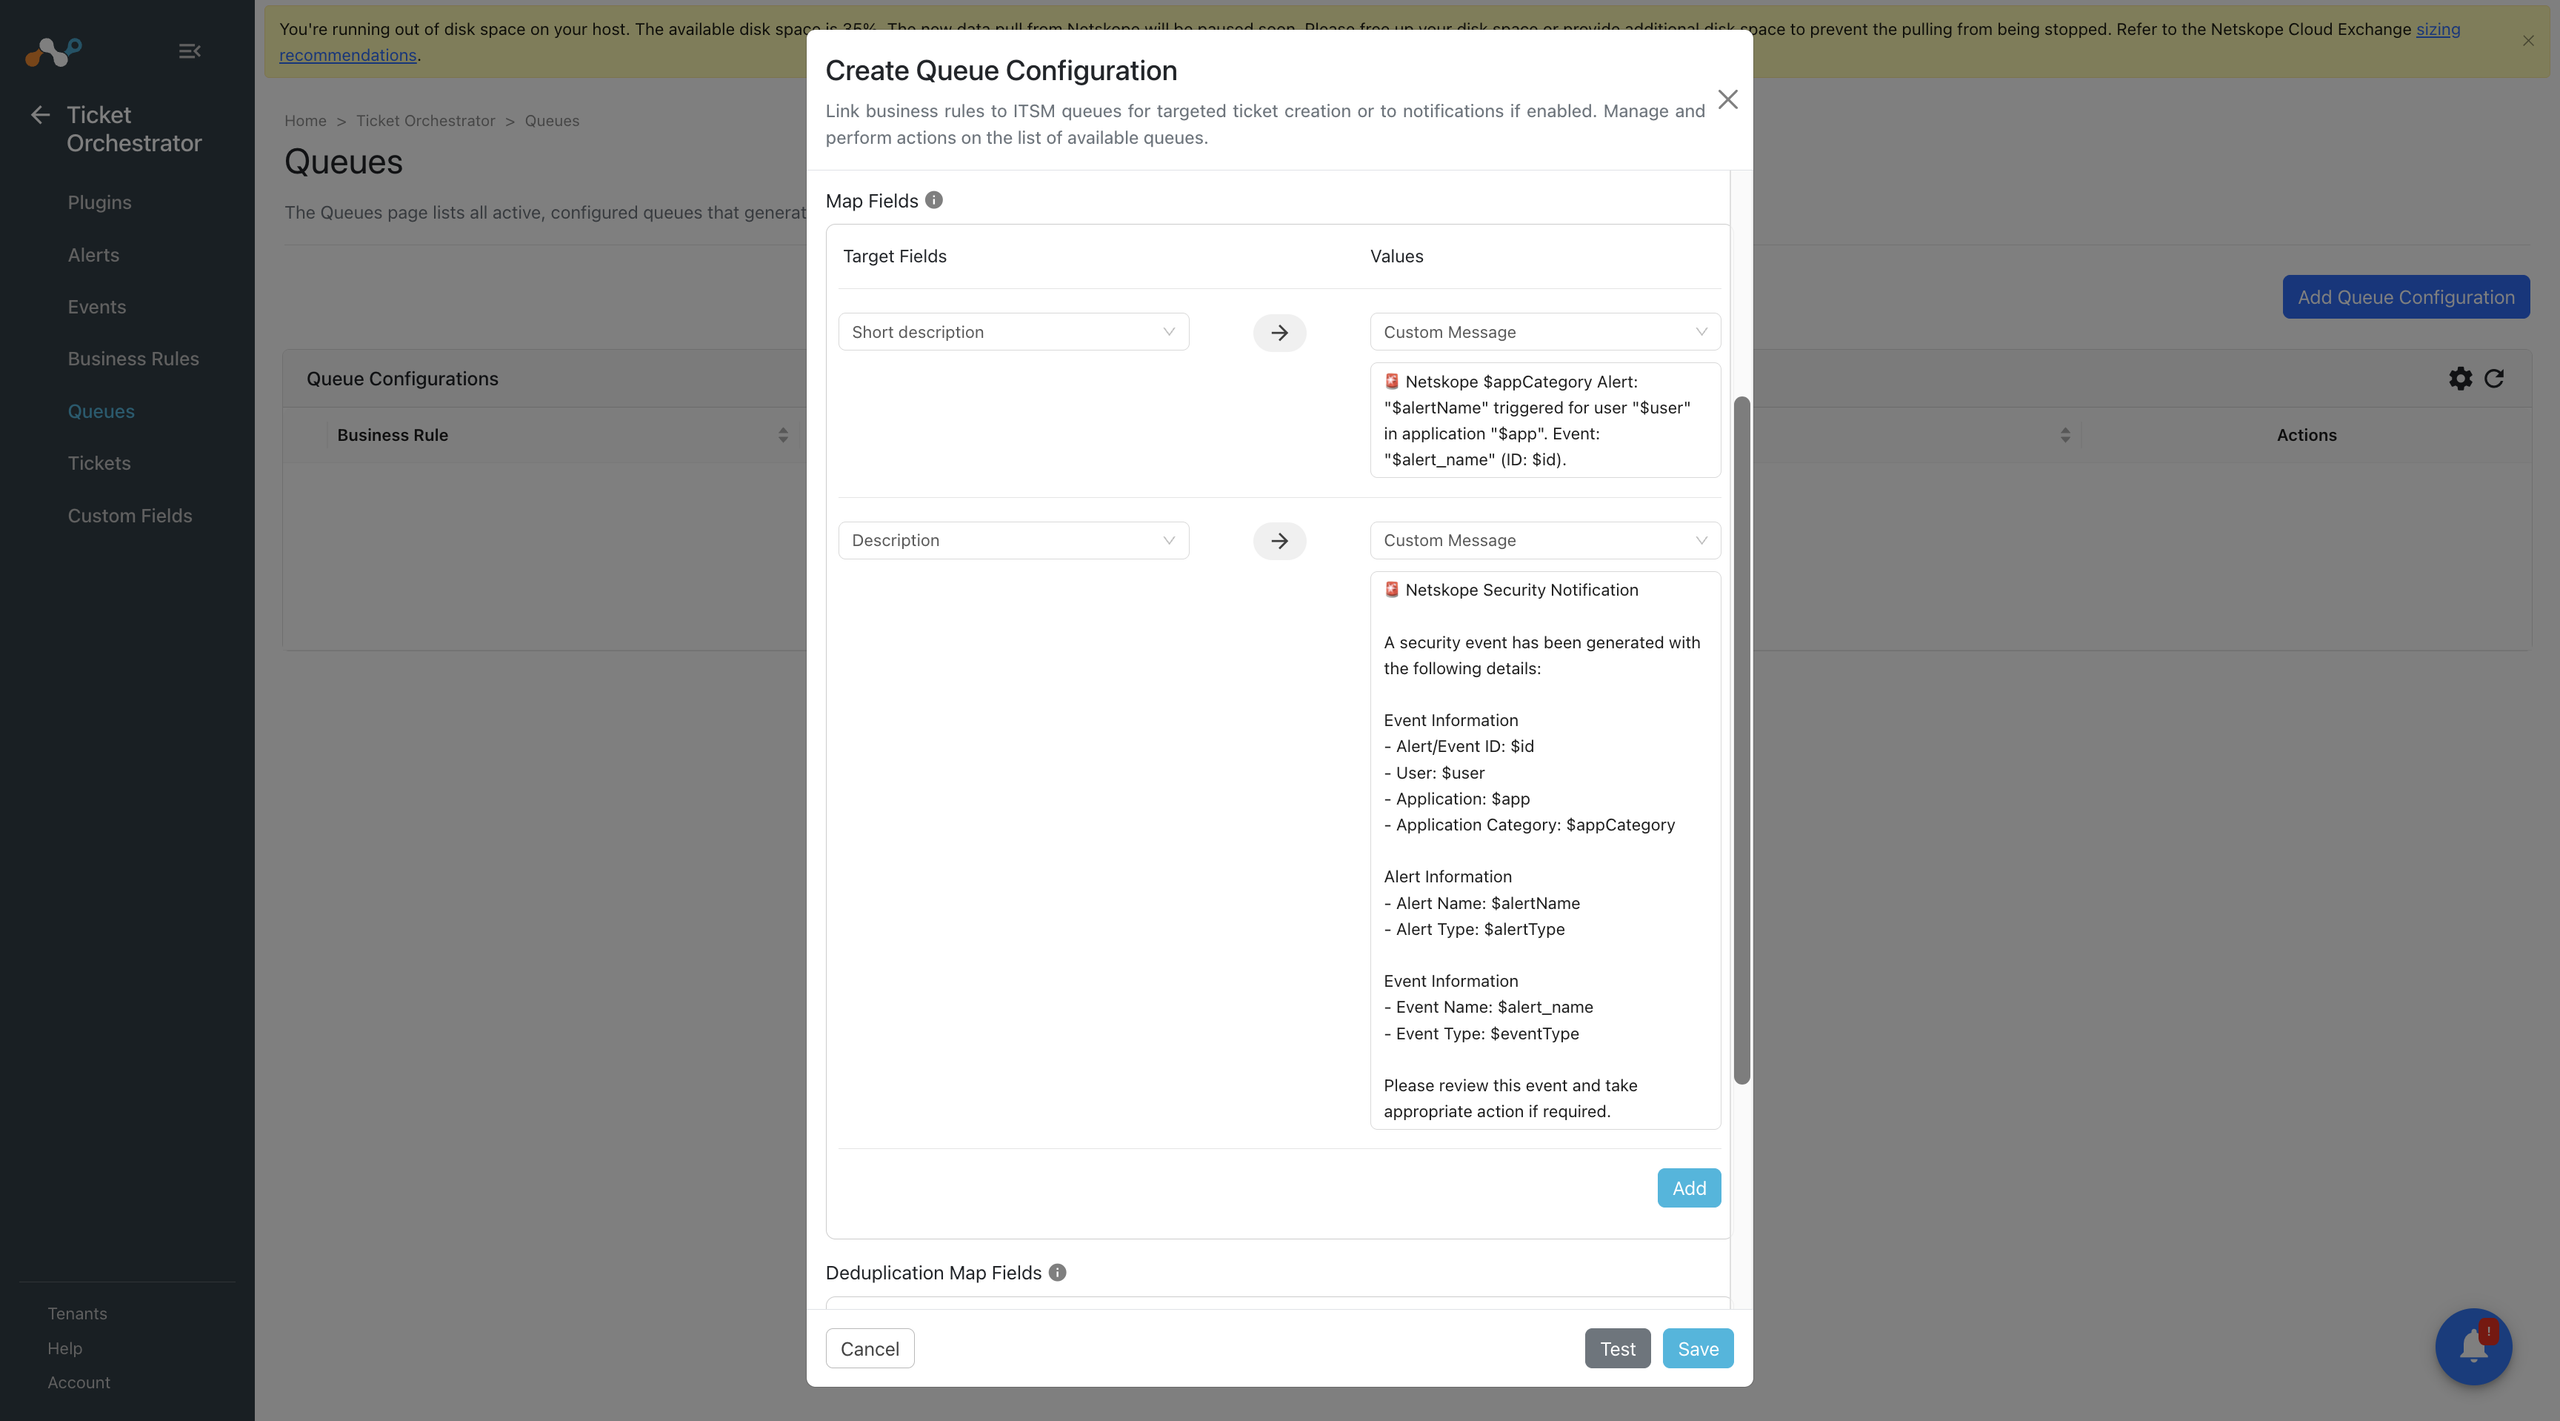
When a ticket is created, the variables ($id, $user, $app, $appCategory, etc.) are automatically replaced with the corresponding values from the Netskope alert or event.
Select Available Fields
To view all available Netskope fields:
- Click inside the custom message editor.
- Type the “$“ character.
- A dropdown list containing all available alert/event fields will appear.
- Select the required field from the list.
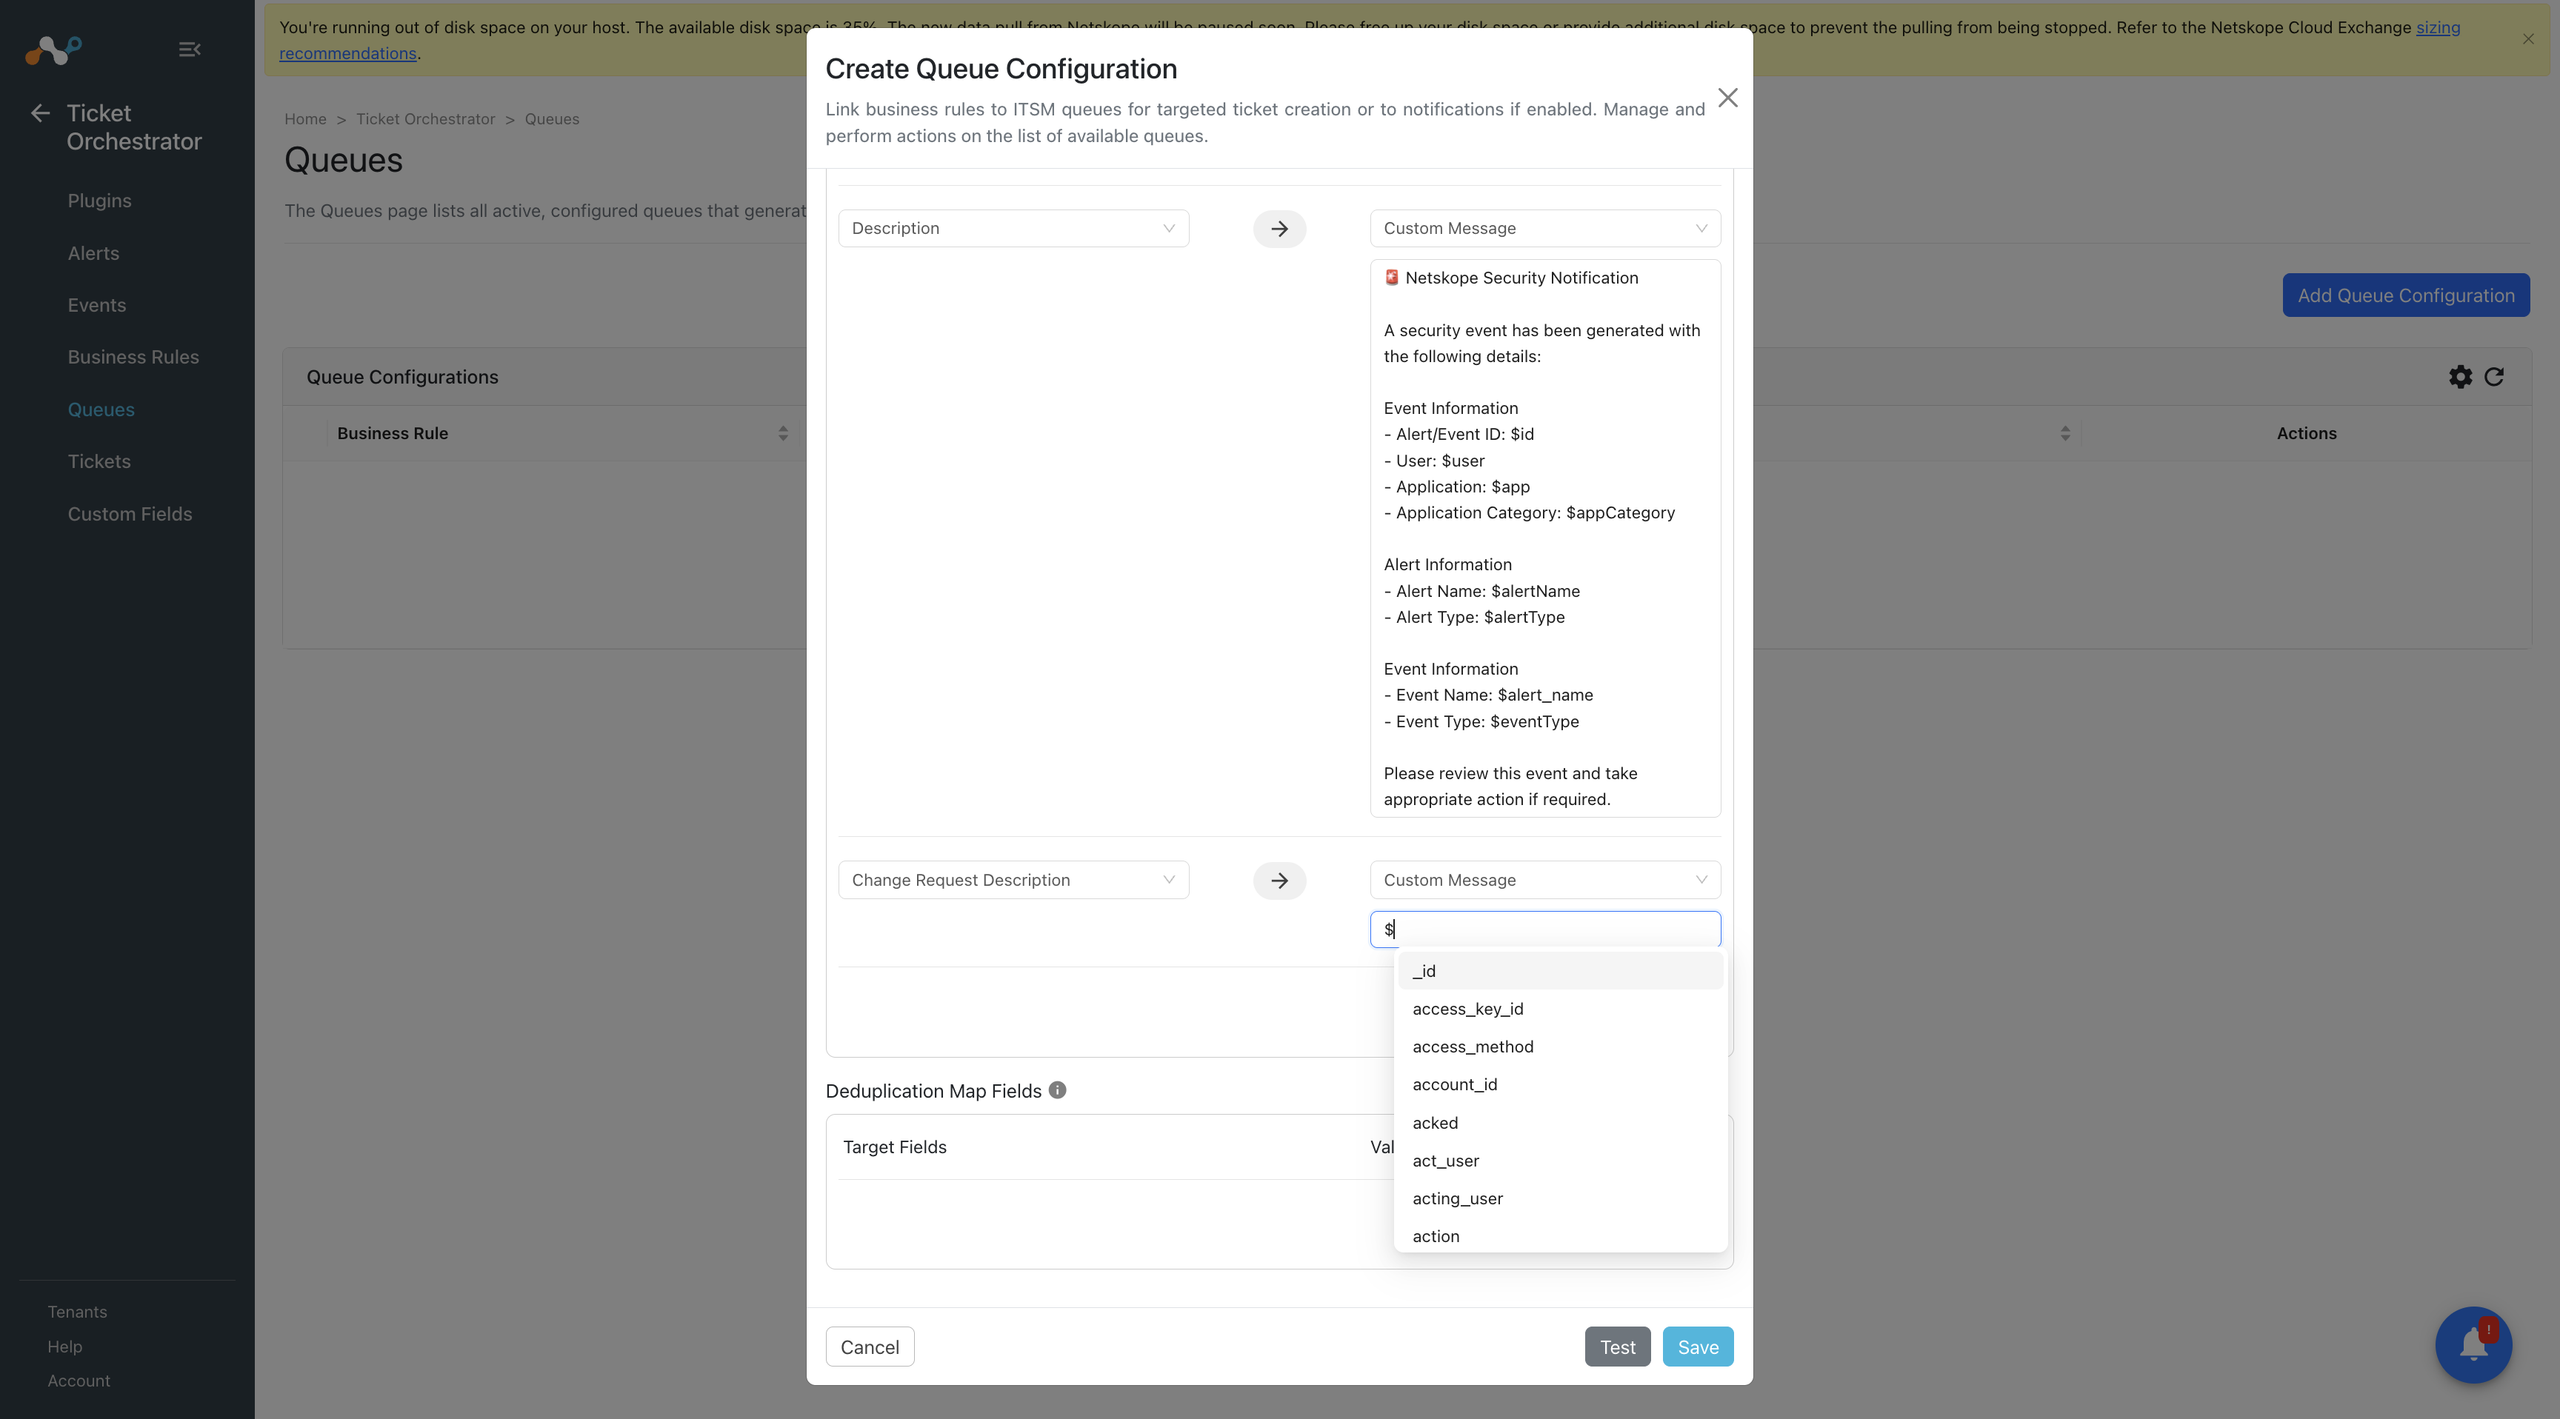
You can use any available Netskope field to build a custom message based on your organization’s requirements.
After completing the custom message:
- Click Save to save the Queue configuration.
- Wait for a new alert or event to be received from Netskope.
- Once processed, Ticket Orchestrator will create a ticket in the configured ticketing platform (ServiceNow in this example) using the customized field values.
The resulting ticket will contain a consolidated message with multiple Netskope attributes populated into a single destination field, providing analysts with more contextual information.