Enhanced Reports Customize Dashboards with the Widget Library
Enhanced Reports Customize Dashboards with the Widget Library
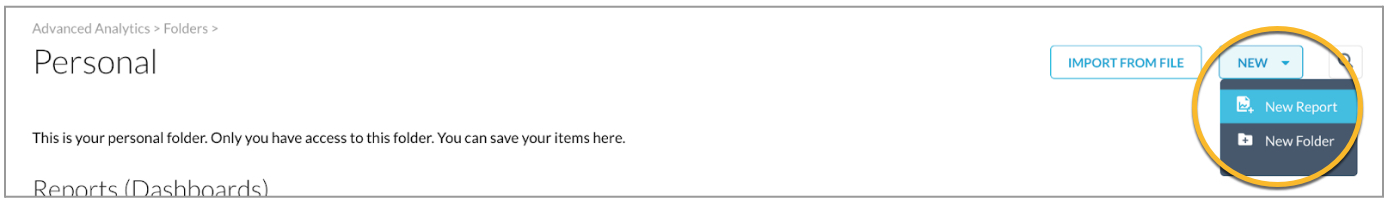
Admins can create a New Report or New Folder from the Personal or Group pages. Navigate to Enhanced Reports > Personal or Group folder > New.
You can select widgets from the widget library menu. In addition, you can search widgets by name or tags.

Filtering and Limiting Data
You can limit the data you see based on criteria you specify. For example, you might want to filter the results to the last three months, or for a certain user. You can also limit the number of rows displayed, or the number of pivot columns displayed. This page introduces you to filtering and limiting data.
Filtering Data Overview
You can restrict the data you’re viewing to items of interest by adding filters. For example, you might limit the results to certain dates, users, locations, or anything else that is part of your data. Any field in your data can become a filter.
You don’t necessarily need to add a dimension or measure to your results in order to filter on it. For example, you can create a report that filters the event date to just the last 90 days, even though your report only shows Application and Number of Events.
There are several different types of filters:
Basic Filters — Most of the time you’ll use this type of filter. In these cases the system provides appropriate drop-down lists, calendar widgets, and text fields you can use to put in your restriction.
Basic Filters
There are several different ways to add a basic filter:
You’ll see that a filter appears in the Filters section above your results. To remove a filter, click the X to its right.
To add a filter:
-
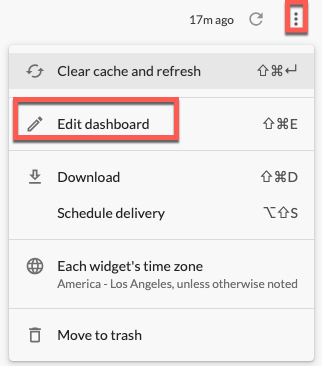
Select Edit Dashboard from the three-dot Dashboard actions menu. Ensure you have at least one query tile added to your dashboard.
-
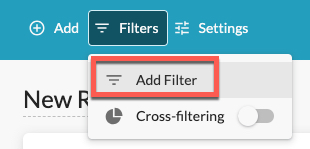
Select Filters in the top toolbar, and then select Add Filter.
-
An Add Filter window displays. Make your selections and click Add.
Standard Types of Filter Options
The available options for the filter depend on its type.
For example, a time dimension will have options to select a time range, while a numeric dimension will have options like equal to or greater than.
For text dimensions, the system helps you choose filter values by displaying a list of existing data values for that field. As you type, the system narrows the list to just those values that include that text.
If you need to enter a special character in your filter, such as , or “, you can do so by adding a leading backslash (\). For example, to filter on Santa Cruz, CA, you would enter Santa Cruz \, CA.
Entering multiple values into a filter, where appropriate, creates an OR condition, meaning all of the values are applied to the filter.
If you would like to filter on a large set of values, you can paste a long list of values into the filter field. However, the maximum number of values you can paste may be limited by your browser or other elements along your network.
Click the + to the right of a filter to add another option to the filter. The new option will appear as either an OR condition or an AND condition, depending on the type of filter option.
The Difference Between Filtering Dimensions and Filtering Measures
Filters are applied differently to dimensions and measures.
Filtering Dimensions: Restricts Raw Data Before Calculations
When you filter on a dimension, you are restricting the raw data before any calculations are made.
Filtering Measures: Calculates First, Then Restricts the Results
When you filter on a measure, however, you are restricting the results after the measure has been calculated.
Limiting Data
Sometimes you want to see only a subset of the complete results from your report. You can do this by setting a row limit, a column limit, or both.
Without a set row limit, the system supports up to 5,000 rows. The system supports an unlimited number of columns for unpivoted reports, although we recommend that you have 50 or fewer columns for browser performance. The system supports up to 200 columns for pivot reports but sets a default column limit of 50 columns.
Row Limits
When you set a row limit, the system will only display up to the number of rows you have set. You are warned if you might be hiding data by setting a row limit that is too low. Your sort order is important in these situations; the system first applies the sort, and then applies the limit.
If you reach a row limit, you will not be able to sort row totals or table calculations.
The Netskope UI displays up to 5000 rows of data as a visualization. Admins can adjust this limit up to 100K in the UI but the visualization will not populate but the data field will display values. In addition, Netskope does not limit your downloads. You can adjust the download options at the widget level.